INVITE-ONLY SCRIPT
Auto Fibonacci Retracement Levels
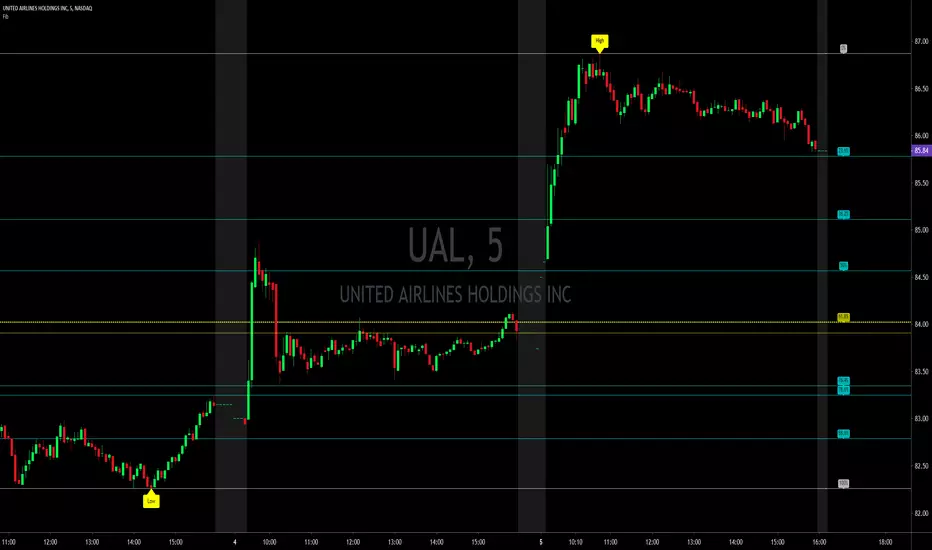
A Fibonacci retracement is a popular tool that traders can use to identify support and resistance levels, and place stop-loss orders or target prices.
The indicator connects any two points that are relevant, a high and low point.
The percentage levels provided are areas where the price could stall or reverse.
Levels should not be relied on exclusively. For example, it is dangerous to assume the price will reverse after hitting a specific Fibonacci level. It may, but it also may not.
Fibonacci retracement levels are most frequently used to provide potential areas of interest. If a trader wants to buy, they watch for the price to stall at a Fibonacci level and then bounce off that level before buying.
The most commonly used ratios include 23.6%, 38.2%, 50%, 61.8% and 78.6%. These represent how much of a prior move the price has corrected or retraced.
招待専用スクリプト
このスクリプトへのアクセスは作者が許可したユーザーに制限されており、通常はお支払いが必要です。お気に入りに追加することはできますが、許可を申請して作者が許可した後でなければ使用することはできません。 詳細については DarkSideTrader にお問い合わせいただくか、以下の作者の指示に従ってください。
スクリプトの動作を理解していて作者も100%信頼できるということでなければ、TradingViewとしてはお金を払ってまでスクリプトを利用するのはお勧めしません。そのかわりに、コミュニティスクリプトでオープンソースの優れたスクリプトが無料で見つけられることが多々あります。
作者の指示
″
チャートでこのスクリプトを利用したいですか?
注: アクセス権をリクエストされる前にこちらをご覧ください。
Follow us
Twitter twitter.com/darksidetrader
YouTube youtube.com/channel/UCAR8aMbticG9ePJrxeZ8mjw
Join Chat Room discord.gg/N4HSqJN96X
Website tradersofwallst.com
Live
9:00 AM EST to 2:30 PM EST
Twitter twitter.com/darksidetrader
YouTube youtube.com/channel/UCAR8aMbticG9ePJrxeZ8mjw
Join Chat Room discord.gg/N4HSqJN96X
Website tradersofwallst.com
Live
9:00 AM EST to 2:30 PM EST
免責事項
これらの情報および投稿は、TradingViewが提供または保証する金融、投資、取引、またはその他の種類のアドバイスや推奨を意図したものではなく、またそのようなものでもありません。詳しくは利用規約をご覧ください。