[JR] Multi Bollinger Heat Bands
Bollinger Bands, with incremented additional outer bands.
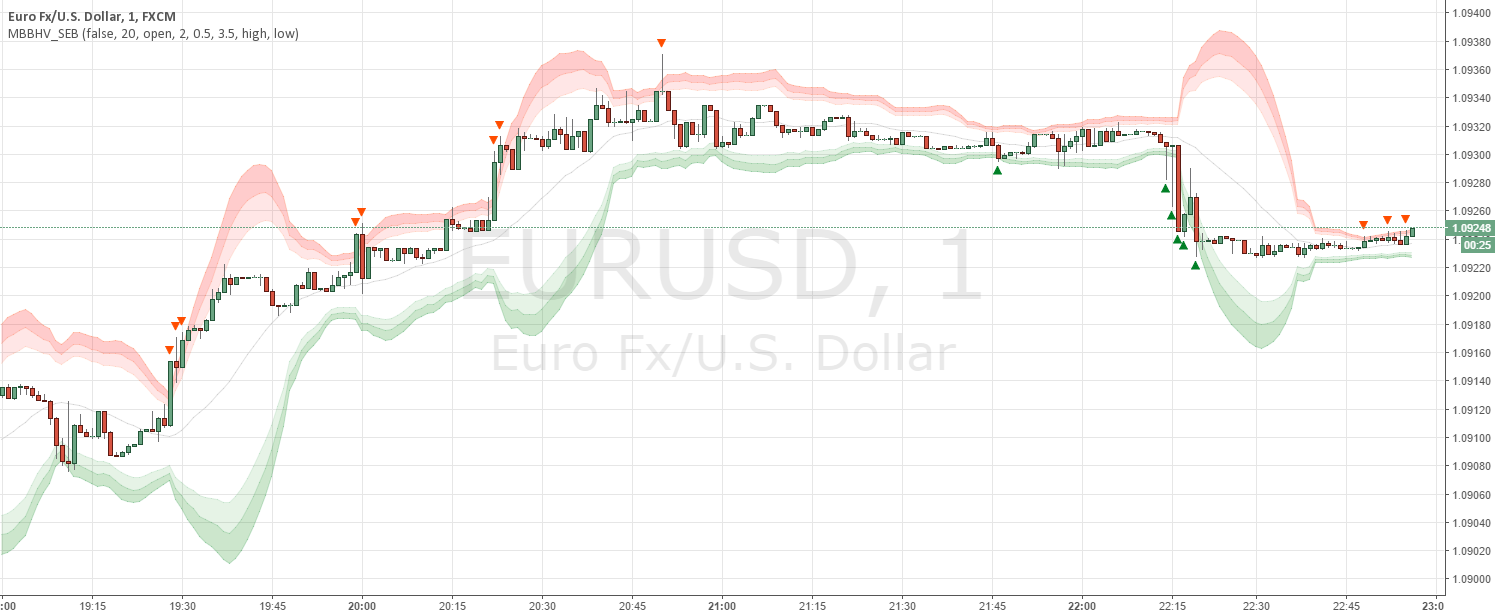
Set as you would normally, but with the addition of an incremental value for the added outer bands.
Defaults with Length 20, base multiplier of 2.0, and an Increment value of 0.5 for additional outer bands at 2.5 and 3.0. Adjust values to suite your needs.
All lines and zones have colour and formatting options available - because why not eh?
コメント:
New iteration of this script here:

// @version=1

// Title: "Multi Bollinger Heat Bands".
// Author: JayRogers
// Reason: Because tweaking multiple bollingers for different time frames was annoying me.

study(shorttitle="[JR]MBHB", title="[JR] Multi Bollinger Heat Bands", overlay=true)

// Inputs
length = input(20, minval=1)
src = input(close, title="Source")
base_mult = input(2.0, title="Base Multiplier", minval=0.001, maxval=50)
mult_inc = input(0.5, title="Multiplier Increment", minval=0.001, maxval=2)
basis = sma(src, length)

// base bands
dev_0 = base_mult * stdev(src, length)
upper_0 = basis + dev_0
lower_0 = basis - dev_0

// middle bands 1
dev_1 = (base_mult + mult_inc) * stdev(src, length)
upper_1 = basis + dev_1
lower_1 = basis - dev_1

// outer bands 2
dev_2 = (base_mult + (mult_inc * 2)) * stdev(src, length)
upper_2 = basis + dev_2
lower_2 = basis - dev_2

// plot basis
plot(basis, title="Basis Line", color=navy, transp=50)

// plot and fill upper bands
ubi = plot(upper_0, title="Upper Band Inner", color=red, transp=90)
ubm = plot(upper_1, title="Upper Band Middle", color=red, transp=85)
ubo = plot(upper_2, title="Upper Band Outer", color=red, transp=80)
fill(ubi, ubm, title="Upper Bands Inner Fill", color=red, transp=90)
fill(ubm, ubo, title="Upper Bands Outer Fill",color=red, transp=80)

// plot and fill lower bands
lbi = plot(lower_0, title="Lower Band Inner", color=green, transp=90)
lbm = plot(lower_1, title="Lower Band Middle", color=green, transp=85)
lbo = plot(lower_2, title="Lower Band Outer", color=green, transp=80)
fill(lbi, lbm, title="Lower Bands Inner Fill", color=green, transp=90)
fill(lbm, lbo, title="Lower Bands Outer Fill", color=green, transp=80)

// center channel fill
fill(ubi, lbi, title="Center Channel Fill", color=silver, transp=100)