INVITE-ONLY SCRIPT
更新済 bg_Breakers_orderBlocks_detection (Breakers)
Version 0.1
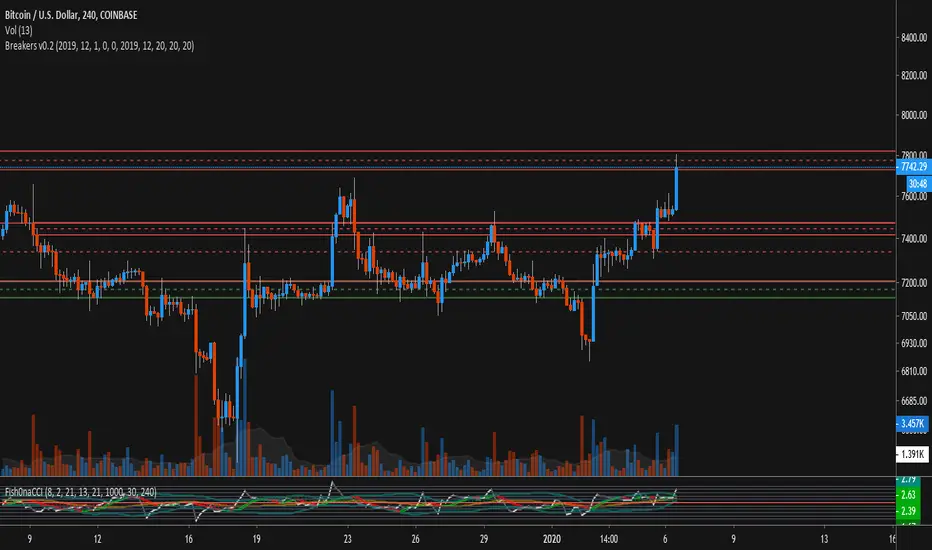
Using Pivots / Swing Point detection, this script plots the final swing candle's body span from top to bottom with an extended horizontal line, with a mid-channel point at 50% between open and close.
Once the trend changes, these zones serve as support and resistance zones, and can help identify breakouts from ranges and probable reversal points moving forward.
To avoid clutter, the script allows you to select a specific date-range (start / end date) which the rule will only apply and plot for.
Other customizable options are the length in bars of the pivot/swing point detection, which is defaulted at 20 bars for both highs and lows.
Works best on time-frames 4H, 1D, etc. with some luck to be had in occasionally shorter time-frames as shown above.
4H:
リリースノート
Version 0.2High / Low Swing Points can now be defined by the candle's High or Low (Wicks), which is and was the default, or you can define the Highs and Lows of the swing by candle's bodies (Open or Close).
招待専用スクリプト
このスクリプトは作者が承認したユーザーのみアクセス可能です。使用するにはアクセス申請をして許可を得る必要があります。通常は支払い後に承認されます。詳細は下記の作者の指示に従うか、bgeraghtyに直接お問い合わせください。
TradingViewは、作者を完全に信頼し、スクリプトの動作を理解していない限り、有料スクリプトの購入・使用を推奨しません。コミュニティスクリプトには無料のオープンソースの代替が多数あります。
作者の指示
免責事項
この情報および投稿は、TradingViewが提供または推奨する金融、投資、トレード、その他のアドバイスや推奨を意図するものではなく、それらを構成するものでもありません。詳細は利用規約をご覧ください。