OPEN-SOURCE SCRIPT
[KA] Rate of Change
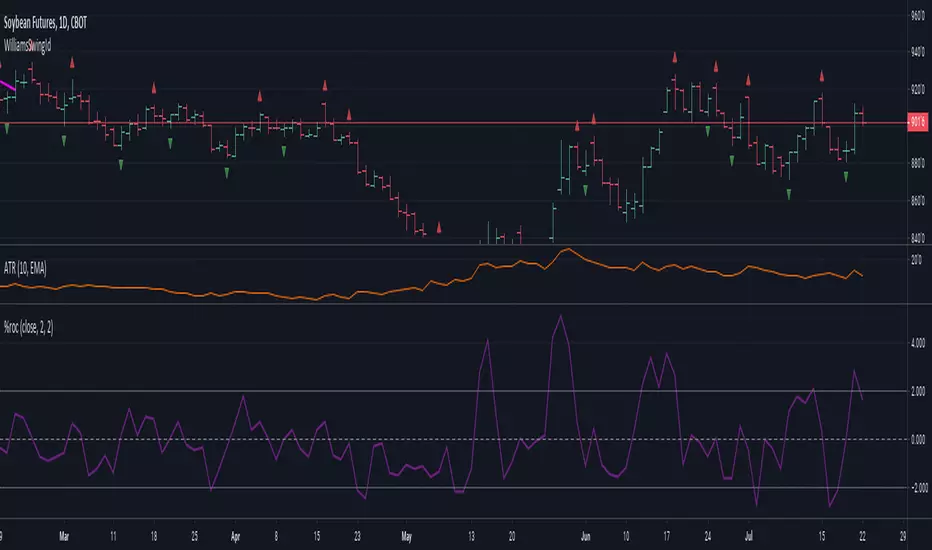
Rate of Change (ROC)
Given a source series, calculates a running Rate of Change -- simply the percentage difference between the current value of said source to the value N bars back.
One nicety here, compared to the stock tradingview indicator is allowance to force plot certain bounds. This allows more visibility on the relative movement of the series within the plotted bounds.
For example, you know the particular bounds for a timeframe, and can visibly see when those bounds are violated.
See:
StockCharts ROC Explanation
Inputs:
- Source Series, anything indicator series on chart
- N Bars, the reference no. of bars to compare change since.
- Mandatory % Bounds, if value specified, this +value and -value, will be plotted
オープンソーススクリプト
TradingViewの精神に則り、このスクリプトの作者はコードをオープンソースとして公開してくれました。トレーダーが内容を確認・検証できるようにという配慮です。作者に拍手を送りましょう!無料で利用できますが、コードの再公開はハウスルールに従う必要があります。
免責事項
この情報および投稿は、TradingViewが提供または推奨する金融、投資、トレード、その他のアドバイスや推奨を意図するものではなく、それらを構成するものでもありません。詳細は利用規約をご覧ください。
オープンソーススクリプト
TradingViewの精神に則り、このスクリプトの作者はコードをオープンソースとして公開してくれました。トレーダーが内容を確認・検証できるようにという配慮です。作者に拍手を送りましょう!無料で利用できますが、コードの再公開はハウスルールに従う必要があります。
免責事項
この情報および投稿は、TradingViewが提供または推奨する金融、投資、トレード、その他のアドバイスや推奨を意図するものではなく、それらを構成するものでもありません。詳細は利用規約をご覧ください。