OPEN-SOURCE SCRIPT
更新済 Oscillator Spectrogram
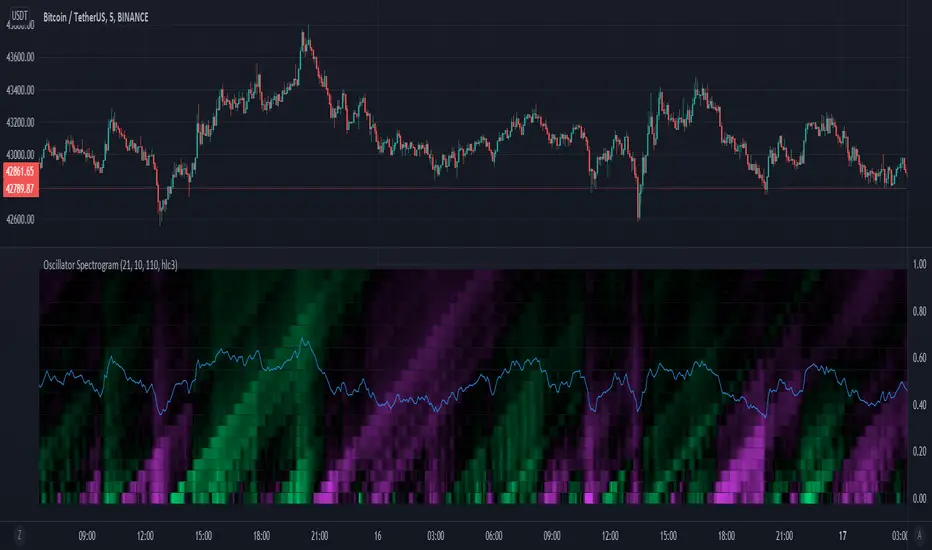
A spectrogram of simple oscillators over varying periods.
Oscillator periods increase from bottom to top.
Color indicates the value of the oscillator, with fuchsia indicating a negative value, black indicating a value around 0, and lime green indicating a value greater than 0.
The oscillators are simply the percentage of positive movement within a lookback period, with 50 percent centered at 0.
Vertical lines along the spectrogram indicate that multiple oscillators of different periods are changing values, indicating a shift in market character.
リリースノート
Added a line representing the average of all the oscillators.リリースノート
Removed accidental chart addition.オープンソーススクリプト
TradingViewの精神に則り、このスクリプトの作者はコードをオープンソースとして公開してくれました。トレーダーが内容を確認・検証できるようにという配慮です。作者に拍手を送りましょう!無料で利用できますが、コードの再公開はハウスルールに従う必要があります。
免責事項
この情報および投稿は、TradingViewが提供または推奨する金融、投資、トレード、その他のアドバイスや推奨を意図するものではなく、それらを構成するものでもありません。詳細は利用規約をご覧ください。
オープンソーススクリプト
TradingViewの精神に則り、このスクリプトの作者はコードをオープンソースとして公開してくれました。トレーダーが内容を確認・検証できるようにという配慮です。作者に拍手を送りましょう!無料で利用できますが、コードの再公開はハウスルールに従う必要があります。
免責事項
この情報および投稿は、TradingViewが提供または推奨する金融、投資、トレード、その他のアドバイスや推奨を意図するものではなく、それらを構成するものでもありません。詳細は利用規約をご覧ください。