INVITE-ONLY SCRIPT
更新済 Impulse-Correction Mapping
About
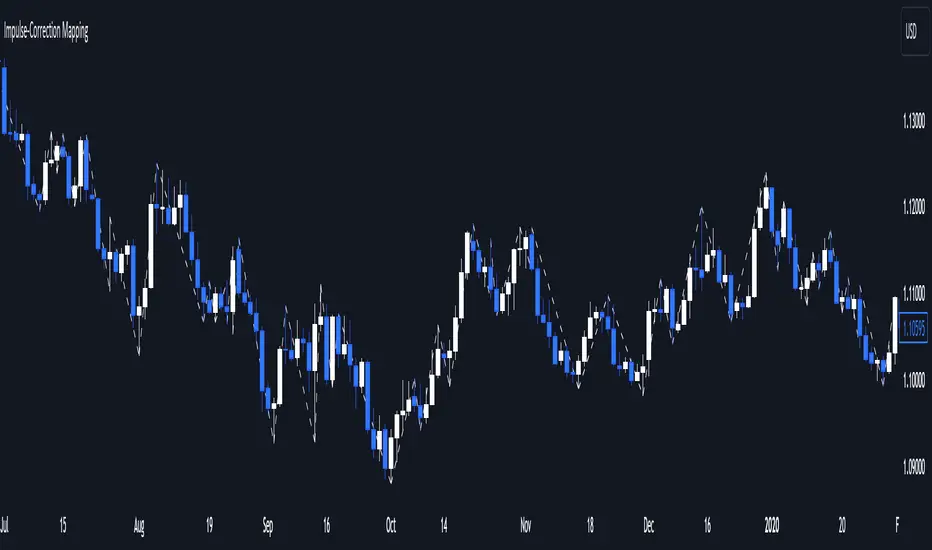
Impulse-Correction Mapper is an indicator of impulses and corrections (valid pullbacks).
Consecutive candlesticks moving in the same direction means an impulse, and a pullback below/above the previous candlestick means a correction.
This way you can identify IDM zones and find significant POIs on the chart.

Below, you can observe valid pullbacks:

And now, the invalid pullbacks:

The impulse and correction shows us the strength of the bulls or bears and also helps us to identify important liquidity areas, including IDMs.
Each high and low of the impulse-correction serves as liquidity for the institutional algorithmic bots.
The indicator can be a self-sufficient tool for market analysis and identification of liquidity swaps. If the price made a liquidity sweep - it can serve as a signal for a reversal to the nearest liquidity area.
When evaluating the daily movement, you can focus on the impulse-correction indicator: if there is a correction - it is very likely that the price will turn around and you can look for a confirmed entry point to the LTF.
The momentum-correction indicator is the basis of the entire Advanced SMC strategy - it is the foundation for determining the market structure.
Impulse-Correction Mapper is an indicator of impulses and corrections (valid pullbacks).
Consecutive candlesticks moving in the same direction means an impulse, and a pullback below/above the previous candlestick means a correction.
This way you can identify IDM zones and find significant POIs on the chart.
Below, you can observe valid pullbacks:
And now, the invalid pullbacks:
The impulse and correction shows us the strength of the bulls or bears and also helps us to identify important liquidity areas, including IDMs.
Each high and low of the impulse-correction serves as liquidity for the institutional algorithmic bots.
The indicator can be a self-sufficient tool for market analysis and identification of liquidity swaps. If the price made a liquidity sweep - it can serve as a signal for a reversal to the nearest liquidity area.
When evaluating the daily movement, you can focus on the impulse-correction indicator: if there is a correction - it is very likely that the price will turn around and you can look for a confirmed entry point to the LTF.
The momentum-correction indicator is the basis of the entire Advanced SMC strategy - it is the foundation for determining the market structure.
リリースノート
+ Added option to choose line style招待専用スクリプト
このスクリプトは作者が承認したユーザーのみアクセス可能です。使用するにはアクセス申請をして許可を得る必要があります。通常は支払い後に承認されます。詳細は下記の作者の指示に従うか、WinWorldTeamに直接お問い合わせください。
TradingViewは、作者を完全に信頼し、スクリプトの動作を理解していない限り、有料スクリプトの購入・使用を推奨しません。コミュニティスクリプトには無料のオープンソースの代替が多数あります。
作者の指示
Get Access to WinWorld tools: winworld.pro
Your journey starts at coursestools.com
免責事項
この情報および投稿は、TradingViewが提供または推奨する金融、投資、トレード、その他のアドバイスや推奨を意図するものではなく、それらを構成するものでもありません。詳細は利用規約をご覧ください。
招待専用スクリプト
このスクリプトは作者が承認したユーザーのみアクセス可能です。使用するにはアクセス申請をして許可を得る必要があります。通常は支払い後に承認されます。詳細は下記の作者の指示に従うか、WinWorldTeamに直接お問い合わせください。
TradingViewは、作者を完全に信頼し、スクリプトの動作を理解していない限り、有料スクリプトの購入・使用を推奨しません。コミュニティスクリプトには無料のオープンソースの代替が多数あります。
作者の指示
Get Access to WinWorld tools: winworld.pro
Your journey starts at coursestools.com
免責事項
この情報および投稿は、TradingViewが提供または推奨する金融、投資、トレード、その他のアドバイスや推奨を意図するものではなく、それらを構成するものでもありません。詳細は利用規約をご覧ください。