OPEN-SOURCE SCRIPT
Stochastic Barcolor 2021-5-22
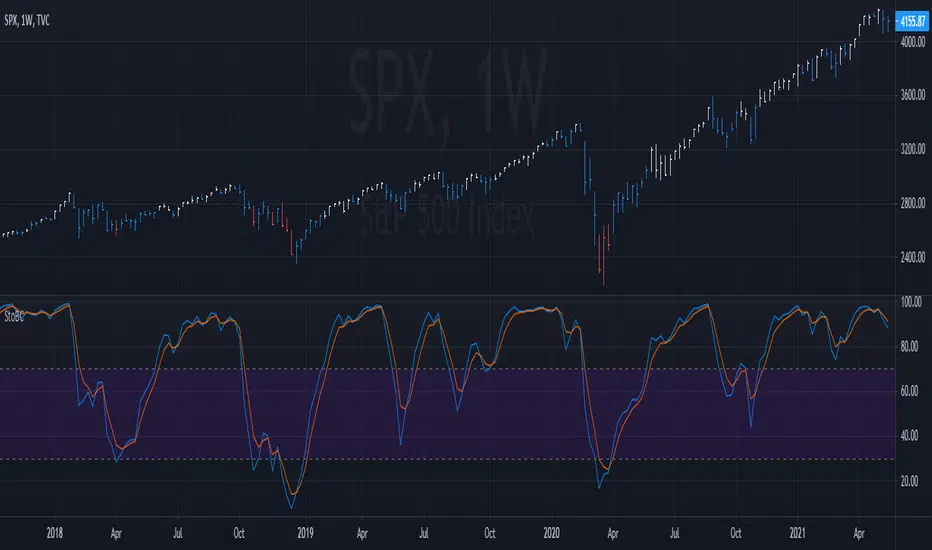
This one is the stochastic with barcolor added to it. In this example, the bars are white when the stochastic line is above is above both 70 AND its signal (vice-versa the bars are red). Adjust the lines and overbought/oversold levels however you see fit for your needs. On higher time frames, this can be used to spot the most bullish/bearish trends. On lower time frames it can be used to take profits. This setting is most effective when used on multiple time frames. Enjoy!
オープンソーススクリプト
TradingViewの精神に則り、この作者はスクリプトのソースコードを公開しているので、その内容を理解し検証することができます。作者に感謝です!無料でお使いいただけますが、このコードを投稿に再利用する際にはハウスルールに従うものとします。
免責事項
これらの情報および投稿は、TradingViewが提供または保証する金融、投資、取引、またはその他の種類のアドバイスや推奨を意図したものではなく、またそのようなものでもありません。詳しくは利用規約をご覧ください。
オープンソーススクリプト
TradingViewの精神に則り、この作者はスクリプトのソースコードを公開しているので、その内容を理解し検証することができます。作者に感謝です!無料でお使いいただけますが、このコードを投稿に再利用する際にはハウスルールに従うものとします。
免責事項
これらの情報および投稿は、TradingViewが提供または保証する金融、投資、取引、またはその他の種類のアドバイスや推奨を意図したものではなく、またそのようなものでもありません。詳しくは利用規約をご覧ください。