INVITE-ONLY SCRIPT
dize Multi-Timeframe Power Index
Hi Trader,
the "Power Index" indicator is one part of our holistic approach to identifying trading setups. It is one of many indcators of our dize indicator package and should always be used in conjunction with the other dize indicators.
💡 What is the Power Index?
The "Power Index" indicator is our approach to measuring the volatility of an asset. It comes with multi-timeframe support, which helps to filter out bad trades. The indicator has a "Sensitivity" parameter that specifies how many historic candles should be looked at when calculating. The graph is a cloud colored according to historical volatility. This makes it possible to estimate at a glance how much risk and volatility currently prevail in the market.
💡How to use it?
By using the integrated settings you will be able to configure the power index for your market. Firstly, you should find the "Sensitivity" which best reflects your markets volatility. If you wish, you can also use the indicator on a different timeframe, than the one displayed on your chart. That can help to filter out noise and get a better perspective on what is happening on a bigger timeframe.
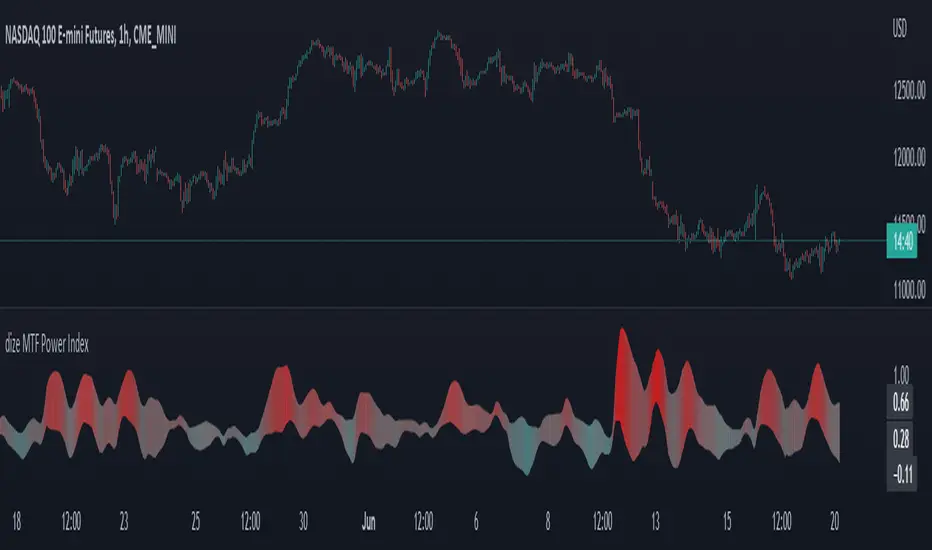
Let's have a look how we can use the Power Index to filter out noise on a lower timeframe:

In the above picture, both chart and power index run on the same timeframe. The Power Index calculates according to the selected timeframe and gives solid information.

If we zoom out on the power index by selecting a higher timeframe, we get the big picture and can easily identify low volatility, which might increase our chances on finding a good trading setup.
The above example is one of many use cases for the power index indicator.
🔓 To gain access to this indicator, please read the signature field.
the "Power Index" indicator is one part of our holistic approach to identifying trading setups. It is one of many indcators of our dize indicator package and should always be used in conjunction with the other dize indicators.
💡 What is the Power Index?
The "Power Index" indicator is our approach to measuring the volatility of an asset. It comes with multi-timeframe support, which helps to filter out bad trades. The indicator has a "Sensitivity" parameter that specifies how many historic candles should be looked at when calculating. The graph is a cloud colored according to historical volatility. This makes it possible to estimate at a glance how much risk and volatility currently prevail in the market.
💡How to use it?
By using the integrated settings you will be able to configure the power index for your market. Firstly, you should find the "Sensitivity" which best reflects your markets volatility. If you wish, you can also use the indicator on a different timeframe, than the one displayed on your chart. That can help to filter out noise and get a better perspective on what is happening on a bigger timeframe.
Let's have a look how we can use the Power Index to filter out noise on a lower timeframe:
In the above picture, both chart and power index run on the same timeframe. The Power Index calculates according to the selected timeframe and gives solid information.
If we zoom out on the power index by selecting a higher timeframe, we get the big picture and can easily identify low volatility, which might increase our chances on finding a good trading setup.
The above example is one of many use cases for the power index indicator.
🔓 To gain access to this indicator, please read the signature field.
招待専用スクリプト
このスクリプトは作者が承認したユーザーのみアクセス可能です。使用するにはアクセス申請をして許可を得る必要があります。通常は支払い後に承認されます。詳細は下記の作者の指示に従うか、paaaxに直接お問い合わせください。
TradingViewは、作者を完全に信頼し、スクリプトの動作を理解していない限り、有料スクリプトの購入・使用を推奨しません。コミュニティスクリプトには無料のオープンソースの代替が多数あります。
作者の指示
🔓To gain access to the dize indicator package, please subscribe on our website http://www.dize-trading.de
🔒For trial access please follow the instructions on our discord: https://discord.gg/DqwKjBZ8Qe
🙋♂️Listed as "Trusted Pine Programmer for Hire"
💰Save $30 on your Tradingview subscription: bit.ly/3OtLyNz
🔓Indicator access: dize-trading.de/
🔒Trial access: discord.gg/DqwKjBZ8Qe
💰Save $30 on your Tradingview subscription: bit.ly/3OtLyNz
🔓Indicator access: dize-trading.de/
🔒Trial access: discord.gg/DqwKjBZ8Qe
免責事項
この情報および投稿は、TradingViewが提供または推奨する金融、投資、トレード、その他のアドバイスや推奨を意図するものではなく、それらを構成するものでもありません。詳細は利用規約をご覧ください。