OPEN-SOURCE SCRIPT
更新済 Stochastic Divergence Strategy
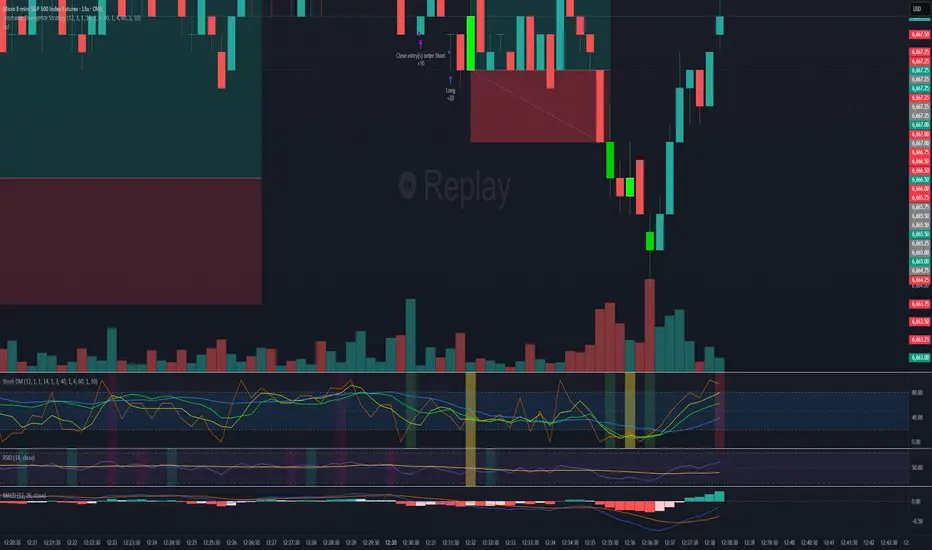
Background bars:
Bearish
gradient from slightly bearish divergence to strong bearish divergence for red and a double bounce for pink
Bullish
gradient from slightly bearish divergence to strong bearish divergence for green and a double bounce for yellow
removable buy and sell signals in options
Bearish
gradient from slightly bearish divergence to strong bearish divergence for red and a double bounce for pink
Bullish
gradient from slightly bearish divergence to strong bearish divergence for green and a double bounce for yellow
removable buy and sell signals in options
リリースノート
Color certain candles to have bearish or bullish divergencegreen gradient is bullish divergence.
Yellow if double dip strong bullish divergence
red gradient is bearish divergence
pink if double tip strong bearish divergence
リリースノート
Determines bullish and bearish divergenceThe brighter the red the stronger the bearish divergence - white order means double tip divergence
The brighter the green the stronger the bullish divergence - white border means double dip divergence
リリースノート
bullish and bearish divergence based on red and green candles. white box is super signalリリースノート
the brighter the color the stronger the divergence. white border is for double dip divergence - strong divergenceリリースノート
Shows divergence by coloring candles. brighter color is stronger divergence. white border is a double dip divergence meaning strong divergence.オープンソーススクリプト
TradingViewの精神に則り、このスクリプトの作者はコードをオープンソースとして公開してくれました。トレーダーが内容を確認・検証できるようにという配慮です。作者に拍手を送りましょう!無料で利用できますが、コードの再公開はハウスルールに従う必要があります。
免責事項
この情報および投稿は、TradingViewが提供または推奨する金融、投資、トレード、その他のアドバイスや推奨を意図するものではなく、それらを構成するものでもありません。詳細は利用規約をご覧ください。
オープンソーススクリプト
TradingViewの精神に則り、このスクリプトの作者はコードをオープンソースとして公開してくれました。トレーダーが内容を確認・検証できるようにという配慮です。作者に拍手を送りましょう!無料で利用できますが、コードの再公開はハウスルールに従う必要があります。
免責事項
この情報および投稿は、TradingViewが提供または推奨する金融、投資、トレード、その他のアドバイスや推奨を意図するものではなく、それらを構成するものでもありません。詳細は利用規約をご覧ください。