OPEN-SOURCE SCRIPT
更新済 Smarter MACD
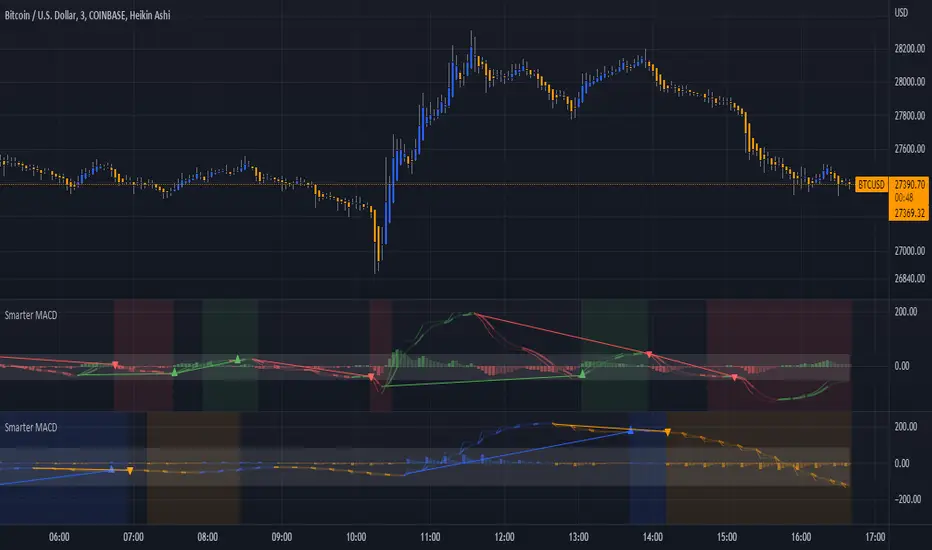
A classic MACD with average peak and dip lines. The lighter green and red horizontal lines are the average peak and dip of the entire span, respectively. The second, bolder of the two lines are the averages of the peaks and dips above and below the overall peak and dip averages. The filled in color is to help visualize these averages and possible trade setups. Rework of the MACD + Averages script.
リリースノート
Clarified momentum divergence signalsリリースノート
Clarified momentum divergence markersリリースノート
Added background coloring to better visualize clear bullish or bearish momentumリリースノート
Added background coloring to better visualize clear bullish or bearish momentum, credits, updated indicator preview, and discord link.Don't forget to join the Discord group: discord.gg/fsbbhDZ3
リリースノート
Added ATF (Adjustable Time Frame) for detecting confluence with higher timeframes, as well as color controls to differentiate between the two timeframes. By adding two to a chart, you can merge them to create overlaps by clicking on the ellipses on the indicator (...), clicking "Move To", and clicking the "Existing Pane Above" or "Existing Pane Below" options.オープンソーススクリプト
TradingViewの精神に則り、このスクリプトの作者はコードをオープンソースとして公開してくれました。トレーダーが内容を確認・検証できるようにという配慮です。作者に拍手を送りましょう!無料で利用できますが、コードの再公開はハウスルールに従う必要があります。
免責事項
この情報および投稿は、TradingViewが提供または推奨する金融、投資、トレード、その他のアドバイスや推奨を意図するものではなく、それらを構成するものでもありません。詳細は利用規約をご覧ください。
オープンソーススクリプト
TradingViewの精神に則り、このスクリプトの作者はコードをオープンソースとして公開してくれました。トレーダーが内容を確認・検証できるようにという配慮です。作者に拍手を送りましょう!無料で利用できますが、コードの再公開はハウスルールに従う必要があります。
免責事項
この情報および投稿は、TradingViewが提供または推奨する金融、投資、トレード、その他のアドバイスや推奨を意図するものではなく、それらを構成するものでもありません。詳細は利用規約をご覧ください。