OPEN-SOURCE SCRIPT
Trend Analyzer
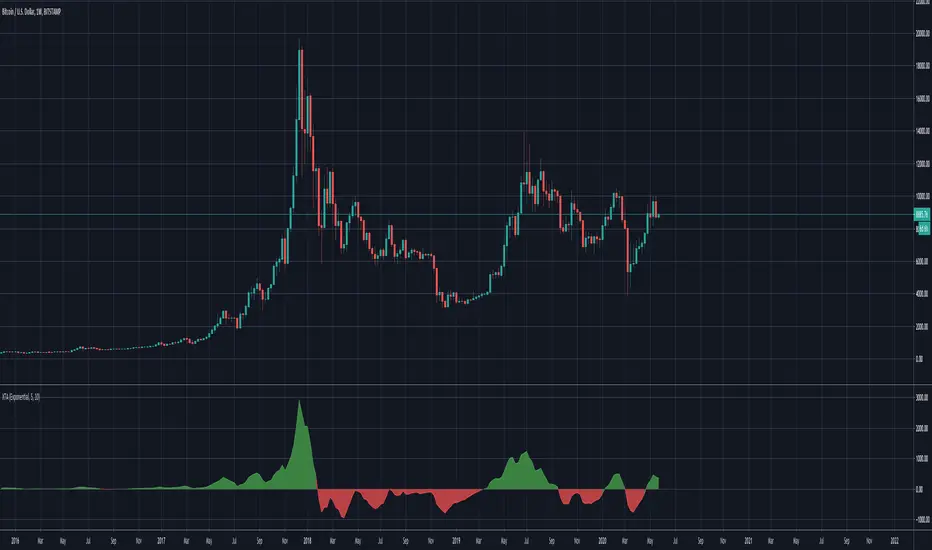
A simple script that plots difference between 2 moving averages and depicts convergance/divergance in color coded format.
Anything <= 0 is red and shows a bearish trend whereas > 0 is green and shows bullish trend.
Adjust the input parameters as following for your preferred time frame :
Anything <= 0 is red and shows a bearish trend whereas > 0 is green and shows bullish trend.
Adjust the input parameters as following for your preferred time frame :
- 4-Hr: Exponential, 15, 30
- Daily: Exponential, 10, 20
- Weekly: Exponential, 5, 10
オープンソーススクリプト
TradingViewの精神に則り、このスクリプトの作者はコードをオープンソースとして公開してくれました。トレーダーが内容を確認・検証できるようにという配慮です。作者に拍手を送りましょう!無料で利用できますが、コードの再公開はハウスルールに従う必要があります。
免責事項
この情報および投稿は、TradingViewが提供または推奨する金融、投資、トレード、その他のアドバイスや推奨を意図するものではなく、それらを構成するものでもありません。詳細は利用規約をご覧ください。
オープンソーススクリプト
TradingViewの精神に則り、このスクリプトの作者はコードをオープンソースとして公開してくれました。トレーダーが内容を確認・検証できるようにという配慮です。作者に拍手を送りましょう!無料で利用できますが、コードの再公開はハウスルールに従う必要があります。
免責事項
この情報および投稿は、TradingViewが提供または推奨する金融、投資、トレード、その他のアドバイスや推奨を意図するものではなく、それらを構成するものでもありません。詳細は利用規約をご覧ください。