OPEN-SOURCE SCRIPT
Financial Astrology Mars Declination
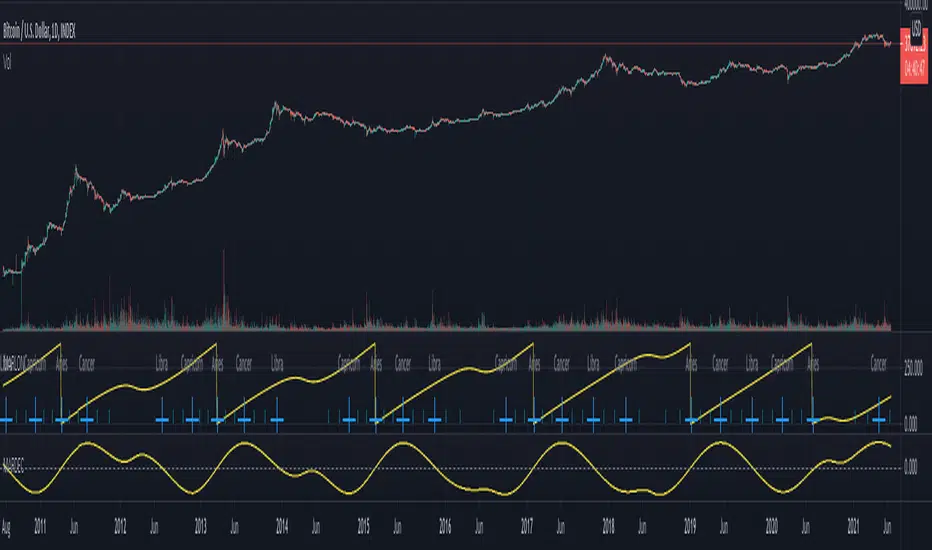
Mars crossing zero declination through the north direction exhibits more stronger force in the impulsive and aggressive price fluctuations, for BTCUSD we can see that in many of the occurrences there was very intense price action on this cryptocurrency. In the contrary when crossed the zero declination through the south declination direction, in many occurrences the price was in congestion / consolidation.
Is very likely that similar pattern repeats in others markets so will be great to get the participation of other financial astrologers that could research this declination cycle and share feedback with us.
Note: The Mars declination indicator is based on an ephemeris array that covers years 2010 to 2030, prior or after this years the declination is not available, this daily ephemeris are based on UTC time so in order to align properly with the price bars times you should set UTC as your chart reference timezone.
オープンソーススクリプト
TradingViewの精神に則り、このスクリプトの作者はコードをオープンソースとして公開してくれました。トレーダーが内容を確認・検証できるようにという配慮です。作者に拍手を送りましょう!無料で利用できますが、コードの再公開はハウスルールに従う必要があります。
免責事項
この情報および投稿は、TradingViewが提供または推奨する金融、投資、トレード、その他のアドバイスや推奨を意図するものではなく、それらを構成するものでもありません。詳細は利用規約をご覧ください。
オープンソーススクリプト
TradingViewの精神に則り、このスクリプトの作者はコードをオープンソースとして公開してくれました。トレーダーが内容を確認・検証できるようにという配慮です。作者に拍手を送りましょう!無料で利用できますが、コードの再公開はハウスルールに従う必要があります。
免責事項
この情報および投稿は、TradingViewが提供または推奨する金融、投資、トレード、その他のアドバイスや推奨を意図するものではなく、それらを構成するものでもありません。詳細は利用規約をご覧ください。