OPEN-SOURCE SCRIPT
TKP RSI BAR COLOR
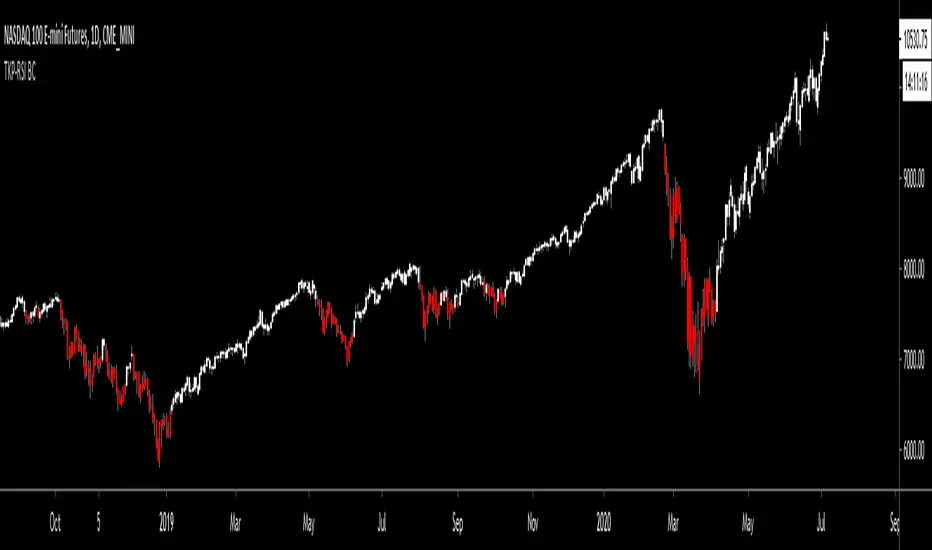
This script was influenced by Scilentor's- "RSI Bar Colors / Scilentor". I improved upon the Idea by adding the ability to change the full range of RSI (Between 0 through 100) to any color you want within 5 point increments.
Traditional use of RSI is to use it as an "Overbought" and "Oversold" indicator. A more uncommon/unknown use, especially among new traders, is to use is as a "Momentum" indicator. I personally like to look for stocks where RSI>50
Default settings are set to color all bars red when below 50, and white when above 50, but try for your self setting different colors above 70, and below 30 to better see overbought and oversold conditions. I got a lot of requests for this script and I hope it helps you in your trading journey :-)
オープンソーススクリプト
TradingViewの精神に則り、このスクリプトの作者はコードをオープンソースとして公開してくれました。トレーダーが内容を確認・検証できるようにという配慮です。作者に拍手を送りましょう!無料で利用できますが、コードの再公開はハウスルールに従う必要があります。
免責事項
この情報および投稿は、TradingViewが提供または推奨する金融、投資、トレード、その他のアドバイスや推奨を意図するものではなく、それらを構成するものでもありません。詳細は利用規約をご覧ください。
オープンソーススクリプト
TradingViewの精神に則り、このスクリプトの作者はコードをオープンソースとして公開してくれました。トレーダーが内容を確認・検証できるようにという配慮です。作者に拍手を送りましょう!無料で利用できますが、コードの再公開はハウスルールに従う必要があります。
免責事項
この情報および投稿は、TradingViewが提供または推奨する金融、投資、トレード、その他のアドバイスや推奨を意図するものではなく、それらを構成するものでもありません。詳細は利用規約をご覧ください。