INVITE-ONLY SCRIPT
Cynotronic Divergence tool
アップデート済

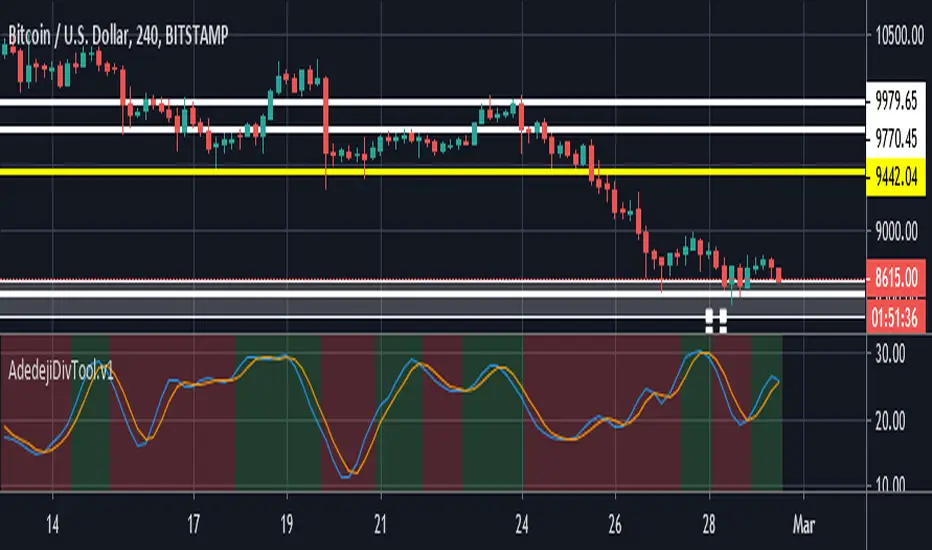
This tool was developed to accurately capture divergences. Back-testing has shown it's relatively more accurate in detecting all types of divergences (both hidden and regular).
The tool is NOT to be used in isolation; it's best used in conjunction with moving averages (preferably the 20 SMA);
How to use
1. The indicator background indicates bullish (green background color) or bearish (red background color) sentiments;
2. Indicator reversal is most bullish when price action is above MA;
3. Indicator reversal + Green background + price above MA is extremely Bullish ;
4. Indicator reversal + Green background + price below MA is indicative of an incoming distribution phase;
5. Indicator reversal + Red background + price above MA is slightly bullish ;
6. Indicator reversal + Red background + price above MA is indicative of an incoming accumulation period.
リリースノート
Renamed and upgraded script to version 4招待専用スクリプト
このスクリプトへのアクセスは作者が許可したユーザーに制限されており、通常はお支払いが必要です。お気に入りに追加することはできますが、許可を申請して作者が許可した後でなければ使用することはできません。 詳細については ADEDEJI_EDGE にお問い合わせいただくか、以下の作者の指示に従ってください。
スクリプトの動作を理解していて作者も100%信頼できるということでなければ、TradingViewとしてはお金を払ってまでスクリプトを利用するのはお勧めしません。そのかわりに、コミュニティスクリプトでオープンソースの優れたスクリプトが無料で見つけられることが多々あります。
作者の指示
″
チャートでこのスクリプトを利用したいですか?
注: アクセス権をリクエストされる前にこちらをご覧ください。
免責事項
これらの情報および投稿は、TradingViewが提供または保証する金融、投資、取引、またはその他の種類のアドバイスや推奨を意図したものではなく、またそのようなものでもありません。詳しくは利用規約をご覧ください。