INVITE-ONLY SCRIPT
更新済 Inverse Fisher Transform Screener
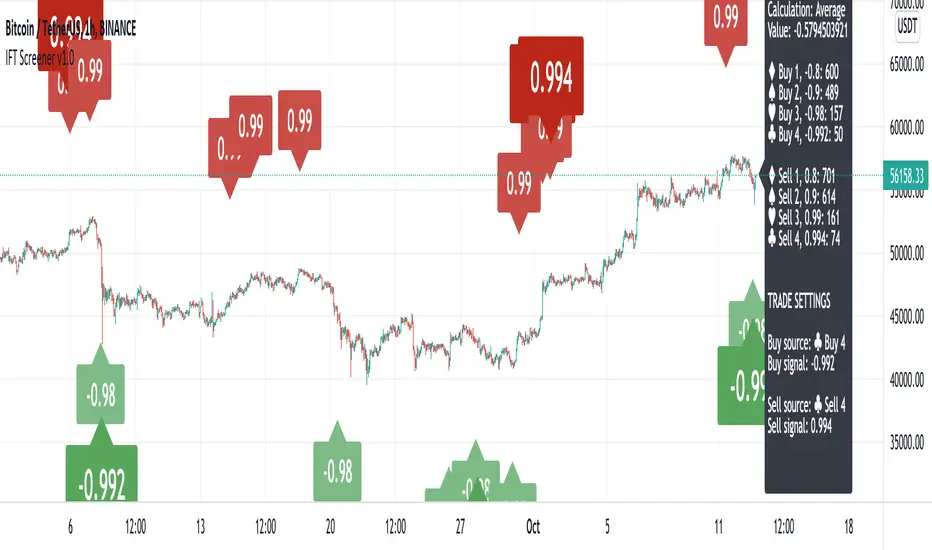
This is a Screener for Inverse Fisher Transform on multiple oscillators
This tool is intended to aid you to visually analyse reasonable buy and sell IFT-signal thresholds across multiple tokens and different sources. It will help you speed up the tedious and manual work of trying out different IFT-settings when you're able to review the chart visually to find which values are present the most often and the location of that signal on the chart.
What does it bring to the table, why is it useful?
- Invese Fisher Transform on multiple oscillators such as RSI, MFI, CCI, Stochastic
- Combine multiple sources into one signal, select how it's calculated
- Visually review the chart for good IFT-settings
- 4 dynamic buy labels with different thresholds
- 4 dynamic sell labels with different thresholds
- Buy and sell on signal reversal
- Create your own trade alerts for automation
- Backtester compatible (plots 1 and 2 for buy and sell signals)
- A dynamic table counting amount of signals for each setting
- The labels are automatically updated when you change the values in the settings
How to use?
1. Change signal source and method
2. Change buy and sell thresholds
3. Show/hide additional labels
4. Review chart
5. Change trade settings
6. Backtest
7. Create alerts
Description
With this indicator you're able to visually review the signal strength of one or multiple oscillators processed with Inverse Fisher Transform ( IFT ), combine them and choose the method of calculation when they are combined. This produces a signal which strongly fluctuates between -1 and +1 instead of the more common 0-100 most oscillators uses. The intention is to make the decision making clearer and easier when you decide when to enter or exit a trade. This aims to help you remove the feelings from your trading.
Inverse Fisher Transform was first presented by John Ehlers in Stocks & Commodities V. 22:5 where he proposes to process RSI with the formula for hyperbolic tangent, tanh (x). This transforms the oscillator into a smoother and more compressed version with quicker oscillations.
リリースノート
Added Absolute Maximum and Absolute Minimum as calculation method for the combined signal. Absolute Maximum uses the value furthest away from the neutral center (+-0) regardless of if it's a positive or negative value. Inverse is true for Absolute Minimum.招待専用スクリプト
このスクリプトは作者が承認したユーザーのみアクセス可能です。使用するにはアクセス申請をして許可を得る必要があります。通常は支払い後に承認されます。詳細は下記の作者の指示に従うか、asterbotsに直接お問い合わせください。
TradingViewは、作者を完全に信頼し、スクリプトの動作を理解していない限り、有料スクリプトの購入・使用を推奨しません。コミュニティスクリプトには無料のオープンソースの代替が多数あります。
作者の指示
You can use this script by becoming a VIP member of https://patreon.com/thetradingparrot,
join our discord community at
https://discord.gg/aXD8NGpyuc
免責事項
この情報および投稿は、TradingViewが提供または推奨する金融、投資、トレード、その他のアドバイスや推奨を意図するものではなく、それらを構成するものでもありません。詳細は利用規約をご覧ください。
招待専用スクリプト
このスクリプトは作者が承認したユーザーのみアクセス可能です。使用するにはアクセス申請をして許可を得る必要があります。通常は支払い後に承認されます。詳細は下記の作者の指示に従うか、asterbotsに直接お問い合わせください。
TradingViewは、作者を完全に信頼し、スクリプトの動作を理解していない限り、有料スクリプトの購入・使用を推奨しません。コミュニティスクリプトには無料のオープンソースの代替が多数あります。
作者の指示
You can use this script by becoming a VIP member of https://patreon.com/thetradingparrot,
join our discord community at
https://discord.gg/aXD8NGpyuc
免責事項
この情報および投稿は、TradingViewが提供または推奨する金融、投資、トレード、その他のアドバイスや推奨を意図するものではなく、それらを構成するものでもありません。詳細は利用規約をご覧ください。