OPEN-SOURCE SCRIPT
Ehlers Adaptive Bandpass Filter [CC]
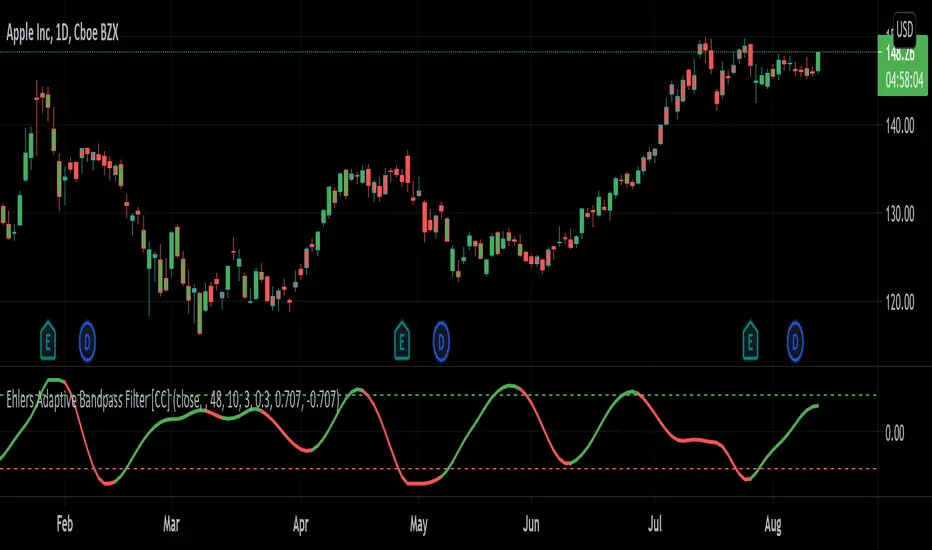
The Adaptive Bandpass Filter was created by John Ehlers (Cycle Analytics For Traders pgs 153-156) and this uses his autocorrelation code to provide the adaptive lengths to use for the underlying bandpass filter. The bandpass filter is a common way in digital signal processing to filter out the underlying noise in the data. It can actually be turned into a leading indicator by changing the bw variable to a smaller amount. Since this indicator is adaptive using the cycle period, the buy and sell signals are different compared to the normal bandpass filter. Buy signals for this indicator according to Ehlers are when the line is red and the line is under the oversold line (also red) then you buy when the indicator line turns green and then you exit when the indicator line turns red and is above the overbought line. This indicator doesn't provide clear buy and sell signals in all circumstances but generally speaking buy when the indicator line turns green and sell when it turns red. Feel free to experiment with this one.
Let me know if there are any other scripts you would like to see me publish!
Let me know if there are any other scripts you would like to see me publish!
オープンソーススクリプト
TradingViewの精神に則り、このスクリプトの作者はコードをオープンソースとして公開してくれました。トレーダーが内容を確認・検証できるようにという配慮です。作者に拍手を送りましょう!無料で利用できますが、コードの再公開はハウスルールに従う必要があります。
I created the largest stock indicator library:
github.com/ooples/
Custom Indicator Requests:
forms.gle/ouMffZR3dQ8bSJQG7
Tips are appreciated:
paypal.me/cheatcountry
patreon.com/cheatcountry
github.com/ooples/
Custom Indicator Requests:
forms.gle/ouMffZR3dQ8bSJQG7
Tips are appreciated:
paypal.me/cheatcountry
patreon.com/cheatcountry
免責事項
この情報および投稿は、TradingViewが提供または推奨する金融、投資、トレード、その他のアドバイスや推奨を意図するものではなく、それらを構成するものでもありません。詳細は利用規約をご覧ください。