OPEN-SOURCE SCRIPT
CryptoMedication's Volatility RSI
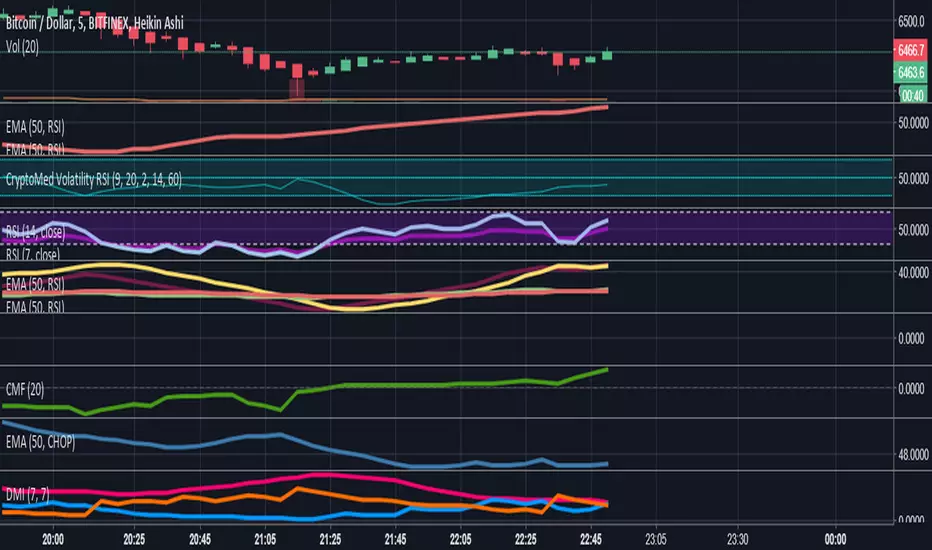
So, here's what we ended up doing for the most recent one that we created.
1. We took the ATR (Average True Range) - You can read about that here: medium.com/thedailydose/average-true-range-atr-lesson-26ee37c599cd
2. Then applied the Bollinger Bands %B to it
3. Then overlayed it with another indicator
Purpose:
The general purpose of this indicator is to identify when there are periods of consolidation or if there were be a large increase in the price (going either way). However, we were able to plug this in so that it connected with the RSI (after cancelling out the noise and smoothing values*making it scaled out evenly), so that it also produces buy/sell signals.
If you're interested to get a more in-depth overview of how this works, visit this link here: medium.com/thedailydose/cryptomedication-volatility-rsi-72d6dcc2d8bb
オープンソーススクリプト
TradingViewの精神に則り、このスクリプトの作者はコードをオープンソースとして公開してくれました。トレーダーが内容を確認・検証できるようにという配慮です。作者に拍手を送りましょう!無料で利用できますが、コードの再公開はハウスルールに従う必要があります。
免責事項
この情報および投稿は、TradingViewが提供または推奨する金融、投資、トレード、その他のアドバイスや推奨を意図するものではなく、それらを構成するものでもありません。詳細は利用規約をご覧ください。
オープンソーススクリプト
TradingViewの精神に則り、このスクリプトの作者はコードをオープンソースとして公開してくれました。トレーダーが内容を確認・検証できるようにという配慮です。作者に拍手を送りましょう!無料で利用できますが、コードの再公開はハウスルールに従う必要があります。
免責事項
この情報および投稿は、TradingViewが提供または推奨する金融、投資、トレード、その他のアドバイスや推奨を意図するものではなく、それらを構成するものでもありません。詳細は利用規約をご覧ください。