PDHL levels with INTRADAY Auto FIBThe present script includes Previous day High/low levels and once the PDH or PDL breaks the present bar's background changes color according to the direction of price breakout.
It's helpful when working on lower timeframe charts with small screen space, so that the user can know that the PDHL has been taken out in one glance at the chart instead of scrolling all around to find out whether the PDH or PDL are broken or not.
The high and low of day before yesterday are also plotted for reference.
The intraday fib levels get drawn taking present day's high and low into account, useful to mark support/retest levels.
The color of the intraday AUTO FIB high and low lines also change from gray to respective assigned colors once the present day price crosses PDH or PDL this is helpful while viewing charts on mobile app.
Disclaimer: Only for studying price movement ideas, trading is not advised.
Anchoredvwap

Fixed Range Anchored VWAPFixed Range Anchored VWAP
Description:
This indicator expands upon the popular Anchored VWAP concept by introducing user-defined start and end dates, allowing traders to select and analyze specific zones of interest. The VWAP is a widely recognized benchmark utilized by traders to assess the average price paid for a security, factoring in both volume and price. By incorporating volume data, the VWAP offers a comprehensive view of market sentiment and provides significant insights into intraday price action.
The Fixed Range Anchored VWAP takes the VWAP concept a step further by enabling traders to define a custom start and end date. This feature allows them to zoom in on specific periods of interest, such as earnings announcements, major news events, or significant price swings. By narrowing the focus to a specific time range, traders can gain a more detailed understanding of how the VWAP interacts with price movements within that specific zone.
How to Use:
1. Set the Start and End Dates: Define the desired start and end dates for the analysis period.
2. Analyze Price Movements: Observe how the VWAP interacts with price action within the defined range.

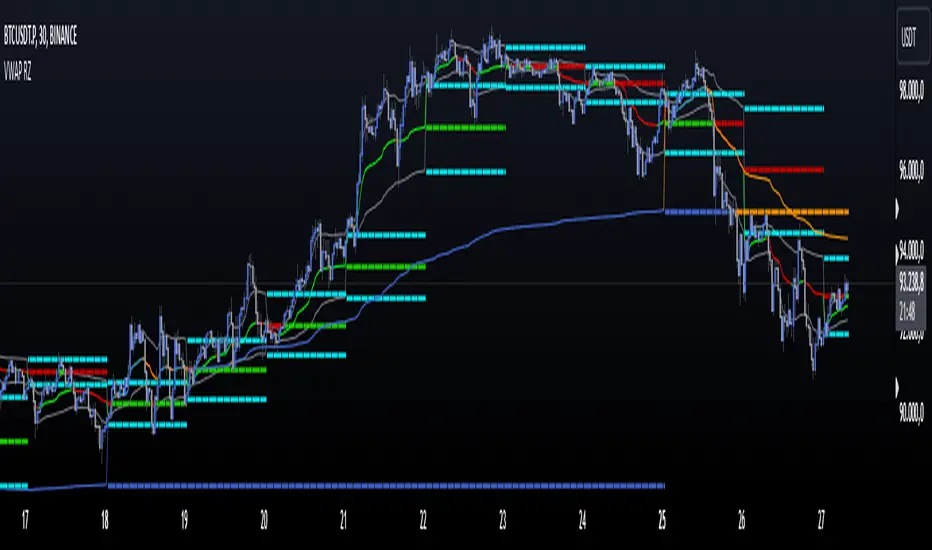
VWAP Reset Zones
With this indicator, the VWAP is displayed based on two adjustable sources. Close and Open are recommended by default.
The zone between the Open and Close VWAP is carried over to the next day as the zone at the end of the period.
The zones can be considered as support and resistance zones.
The chart illustrates the idea behind it.
In addition, the anchor function has been added so that anchor points can be set for session, week and month.
Depending on the set anchor and the selected time unit of the chart, an adjustment of the indicator to the time unit can be made.
Recommended time unit of the indicator: Session = 15 min / Weekly = 1H / Month = 4H
In addition, the zones between VWAP close and vwap open have been colored.
Bullish when the close is above the open price and bearish when the close is below the open price.
The principle is simple. If the average closing price is below the average opening price, a downtrend is to be assumed and vice versa an uptrend.
VWAP Open Session Anchored by HampehThe VWAP Open Session Anchored indicator differs from traditional VWAP indicators by automatically anchoring the Volume Weighted Average Price calculation to three market session starts Morning, Evening, and Night. Each session represents a distinct time period within the trading day, offering traders and investors a more comprehensive view of the volume-weighted average price within specific sessions.
What Is the Volume-Weighted Average Price (VWAP)?
The volume-weighted average price (VWAP) is a technical analysis indicator used on intraday charts that resets at the start of every new trading session.
VWAP is important because it provides traders with pricing insight into both the trend and value of a security.
KEY TAKEAWAYS
1. The volume-weighted average price (VWAP) is a single line on intraday charts.
2. It looks similar to a moving average line but smoother.
3. VWAP represents a view of price action throughout a single day's trading session.
4. Retail and professional traders may use the VWAP to help them determine intraday price trends.
5. VWAP typically is most useful to short-term traders.
VWAP is calculated by totaling the dollars traded for every transaction (price multiplied by the volume) and then dividing by the total shares traded.
VWAP = Cumulative Typical Price x Volume/Cumulative Volume
Where Typical Price = High price + Low price + Closing Price/3
Cumulative = total since the trading session opened.
How Is VWAP Used?
VWAP is used in different ways by traders. Traders may use VWAP as a trend confirmation tool and build trading rules around it. For instance, they may consider stocks with prices below VWAP as undervalued and those with prices above it, as overvalued. If prices below VWAP move above it, traders may go long on the stock. If prices above VWAP move below it, they may sell their positions or initiate short positions.
Institutional buyers including mutual funds use VWAP to help move into or out of stocks with as small of a market impact as possible. Therefore, when they can, institutions will try to buy below the VWAP or sell above it. This way their actions push the price back toward the average, instead of away from it.
Source: www.investopedia.com

All-In-One Auto Anchored VWAPsA chart isn't trendy without a VWAP (which stands for volume weighted average price).
This indicator allows you to choose 3 different anchored VWAPs, and customize the anchor period from one of many different options, including:
- Daily
- Weekly
- Monthly
- Quarterly
- Yearly
- All Time
- Specific Pivots
- Specific Sessions
You can then choose whether you want to anchor to the open, highest or lowest value within that period.
The indicator will automatically update every time a new anchor point is triggered. Every VWAP has colors and standard deviation bands as an optional setting.
As interest in the script grows I will continue to add new features.
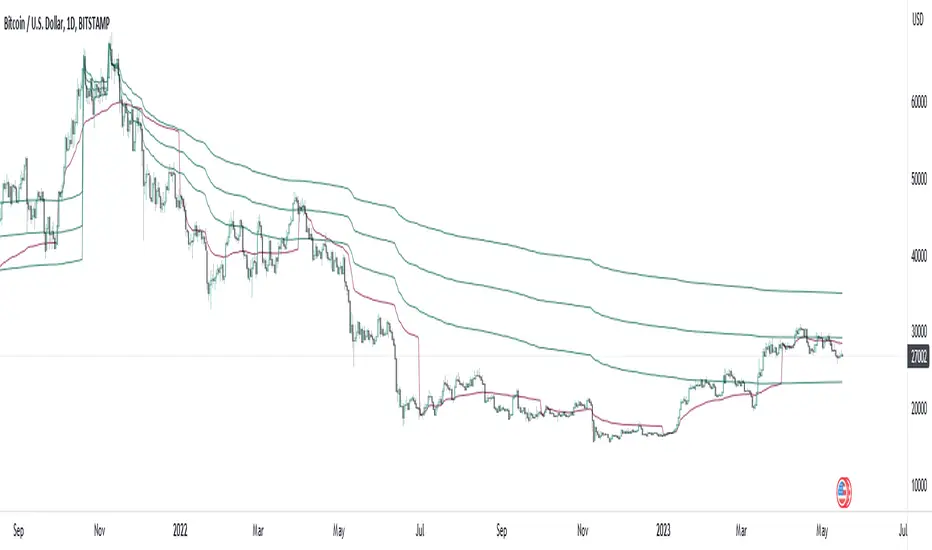
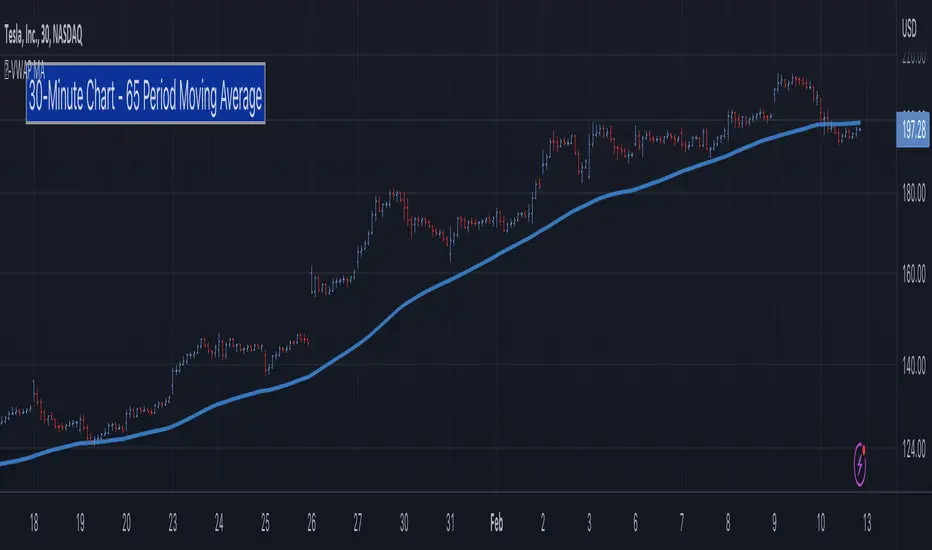
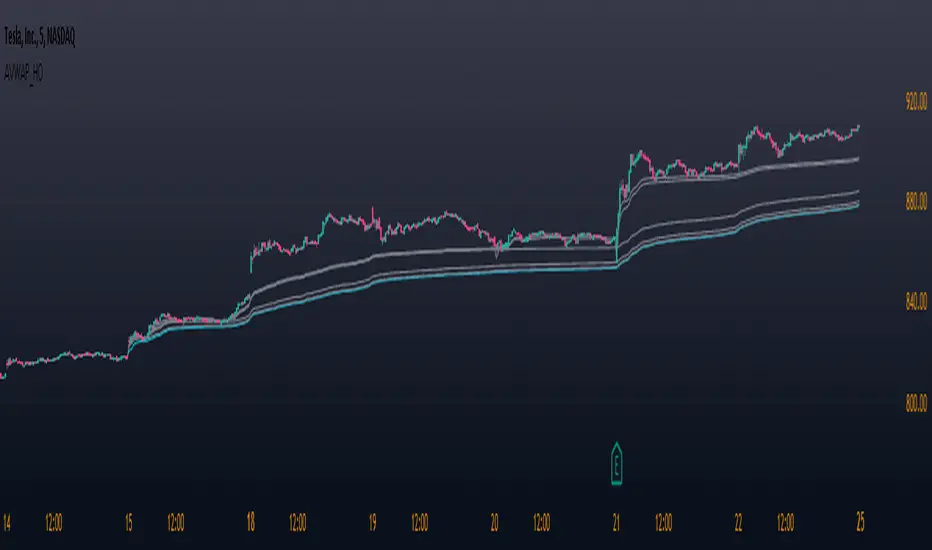
5-Day Moving Average - Intraday [LevelUp]In collaboration with Brian Shannon, author of two best-selling books on technical analysis, we've put together an indicator that manages the moving average period based on the chart timeframe.
When using AVWAP as described by Brian, we look for stocks where the trend of the 50-SMA is higher. In that scenario, we look to shorter timeframes (intraday charts) to see if the price action is setting up for a low risk trade. We do this by making sure the shorter timeframe(s) align with the longer. As we look at various timeframes, we need to make sure the moving average is consistent across the timeframes, which is done via the 5-day moving average as outlined below.
The 5-Day Moving Average (5-DMA)
Brian explains it best, from his article 5 Day Moving Average posted on his blog:
"If you want to see a five DAY moving average on a chart with 10 minute candles, you have to consider how many 10 minute periods of trading there are in the trading day. The US equities markets are open from 9:30- 4:00 each day, which is 6.5 hours per trading day. In each hour of trading, there are 6-10 minute periods, so during the regular session for equities, the market is open for 390 minutes or 39-10 minute periods per day. If we are to get a five day moving average, we would take the 39-10 minute periods the market is open each day and then multiply that by five days. 39 x 5 = 195. So a 5 DAY moving average is represented by a 195 PERIOD moving average when looking at a 10 minute timeframe."
Here are the supported timeframes and their 5-DMA equivalents:
1-minute 1950
2-minutes 975
3-minutes 650
5-minutes 390
6-minutes 325
10-minutes 195
13-minutes 150
15-minutes 130
26-minutes 75
30-minutes 65
39-minutes 50
65-minutes 30
78-minutes 25
130-minutes 15
195-minutes 10
More Information About Anchored VWAP (AVWAP)
Brian goes into great detail about multiple timeframe analysis and AVWAP in both of his books:
▪ Maximum Trading Gains With Anchored VWAP
▪ Technical Analysis Using Multiple Timeframes
Acknowledgements
Many thanks to Brian Shannon for sharing his expertise on Anchored VWAP and providing feedback and suggestions during the development of the indicator.
Automated Anchored VWAPThis was reasonably easy to put together and I can't find one that does this in the Library and I've been wanting one. Of course, the drawing tool is just fantastic, but sometimes it can be forgotten as new pivots emerge.
What you'll find elsewhere in the Library is a nice variety of fancier methods for determining an anchor point with labels, lines, timestamps and standard deviations.
This is just a simple script to pull the Anchored VWAP off of the most recent pivot and update that as new pivots become defined.
I wanted it to be really portable so it could easily work into other things you're working on while also keeping the chart reasonably clean.
The way this functions is as follows: A new pivot is found and VWAP is calculated from it. At that point the prior aVWAP is no longer tracked and it picks up from the new pivot .
Of course this means that the plot doesn't generate until the pivot is actually confirmed, which in turn means that the plot doesn't reach back to the pivot , it begins based on whatever "right bars" period you end up choosing.
I kind of like it that way, because you have your eyes on the one that matters until the new one matters.
The downside is that it doesn't track old pivots . The old aVWAP might still be in play. But if you track all of the old one's you'll have a 100 lines on your chart and no one wants that.
I recommend when you look back and think the old one is still in play, use the drawing tool to keep it on the chart.
Otherwise, let the script do the work for you.
Hope its helpful. Let me know what you think should be done to make it better.

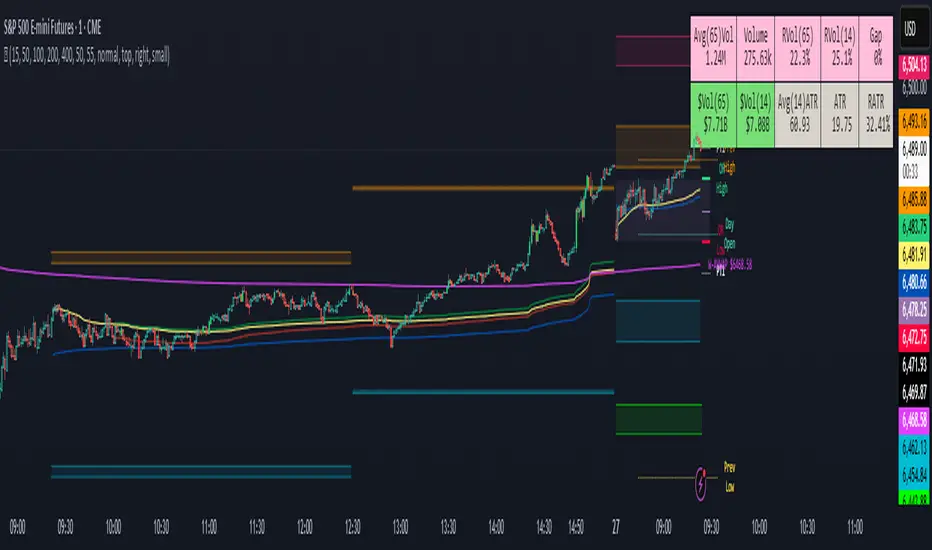
Three Legged GooseThree Legged Goose
Three-Legged Goose is an all-in-one intraday trading system.
It features a sleek and customizable Opening range overlay with infinitely generating price targets, Average Daily Range Zones, Curated Anchored VWAPs, Total Volume and ATR analysis, as well as our state of the art Market Momentum Trend detection.
Three-Legged Goose also has important Daily levels, including the Previous Day's High and Low and the Current Days Open, three fully customizable Exponential Moving Averages, a customizable ema cloud, and a toggleable standard vwap.
Using this indicator allows you to get rid of any unnecessary indicators that are taking up those valuable slots in TradingView.
AVWAP + ORBS:
The Opening Range Breakout system builds off of our recommended 15min opening range and does all of your price target calculations based on the width of the opening range. These targets are fully customizable within the settings,
to allow fine-tuning from ticker to ticker. We have programmed three Anchored vwaps at different time intervals to act as a dynamic trend-finding instrument. These, along with the opening range breakout system, can help you quickly spot the day's trend and dynamic support and resistance long before your standard moving averages have caught up with price intraday.
Average Daily Range Zones:
We believe these zones to be essential to trading, especially with our system. These zones tend to act as areas of major support and resistance as well as give an idea of the projected volatility of the underlying.
Market Momentum Trend Detection:
We paint our momentum analysis directly on your candles. By taking the overall Market Internals + the underlying's Price movement, we can determine areas where we feel comfortable adding risk on or taking risk off.
This will help those that struggle at identifying trends and valid reversals.
All of the default settings are our recommended settings.
Please check the Author Instructions Below for how to gain access to our indicators.
Anchored VWAP with Custom Volume IndexNot a regular AVWAP - this one allows you to use up to 39 sources added together as your volume source
This enables you to use many different pairs from many different exchanges when dealing with crypto
OR you can enhance your intermarket analysis charting abilities enabling you to place the AVWAP on multiple symbols on one chart
Hope you enjoy!
NOTE:
All the symbols must have a history that goes back as far as the chosen date!
When placing at a date in the past, ensure all the sources of volume have history going back as far as you have chosen OR the AVWAP will not appear

Auto Anchored VWAP - Pivot BasedSo I loved the concept of anchored VWAP so just thought of making a script that anchors the VWAP when a new pivot is formed based on pivot length. Green is the pivot high anchor and Red is the pivot low anchor. I hope this is useful.

Anchored VWAP Hand-OffBrian Shannon's "VWAP hand off" strategy, Has been my "go to" for some time now. Version 5 makes this much easier, with drag and drop placement.
When price taps the base anchored VWAP, a second VWAP is plotted at that point. When price taps the second, a third is plotted, and so on.
Each consecutive VWAP can be used to identify trend and future pivot points as trend continues.
IF the VWAPS look messy, price action is choppy and a trend hasnt yet started.
Auto AVWAP (Anchored-VWAP)Anchored Volume Weighted Average Price (AVWAP)
Pioneered by Brian Shannon, an Anchored VWAP is the measure of the average price per share since a specific moment or event. It is found as a tool in TradingView in the same toolkit as Trend Lines.
This indicator uses a Stochastic RSI measurement to define when low and high points (support and resistance levels) have occurred and applies an 'anchor' to these points.
It progressively updates these anchor points as they change. The "Next" potential AVWAP values are also displayed. When a support level is raised or a resistance level is lowered the main AVWAP value is replaced by the "Next" value.
Default Configuration:
This indicator (unconventionally) uses the high and low values instead of the HLC3 values used by a typical VWAP calculation. This allows for what appears more like support and resistance than simply an average price. Simply uncheck this configuration value to see the difference.
Breakout alerts are triggered by the open value. Uncheck this setting to use the close.

High/Low Anchored VWAPHigh/Low Anchored VWAP simply plots an Anchored VWAP at High and Low, within a set range (D,W,M) , with a central "Basis" plot of the High and Low anchored VWAPs
*DISCLAMER* This indicator repaints. DO NOT set alerts or backtest using this indicator.

Market VWAPsIt's annoying to have to redraw the anchored VWAPs over and over, so I wrote an indicator that will create an anchored VWAP for every session and daily open.
Session times are configurable. Disable the ones in Styles that you don't need.
Enjoy!

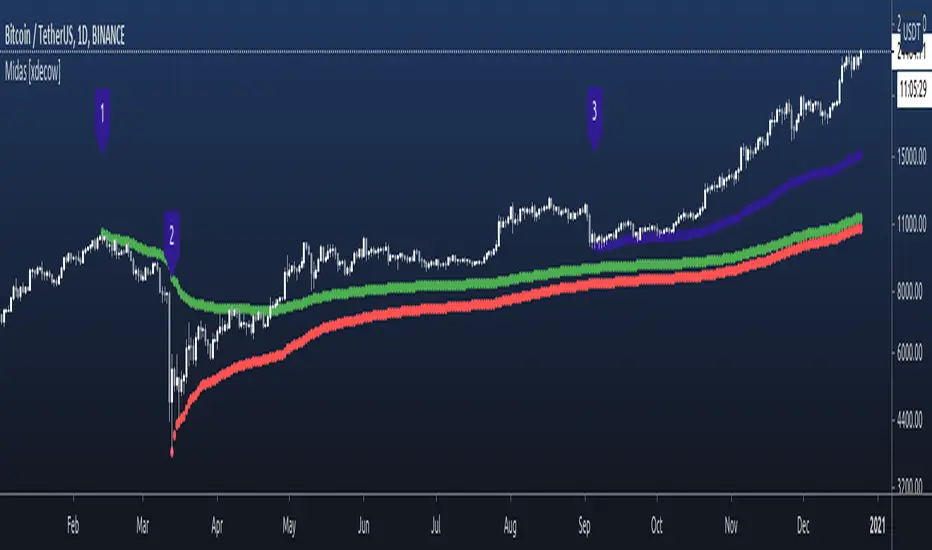
Nubia - Auto Midas Anchored VWAP [xdecow]This indicator looks for the highs and lows using the highest / lowest of 4 different periods. The default values are 17, 72, 305 and 1292 inspired by BO Williams phicube fractals.
The indicator will show anchored vwaps from those 8 dynamic points (4 tops and 4 bottoms).
A true trend is defined when 4 fractals line up without much opposite resistance (only the two smallest opposing vwaps).
When the price is between several vwaps it is a sign of consolidation or pullback. You can use larger timeframes to check for possible targets in large consolidations and pullbacks.

Anchored VWAP Large Swings Strategy [1H]Customized anchored VWAPs with 50,100,200,500 periods lookbacks. Weekly opens are used as a confluence regarding the trend.
Best use on 1H timeframe. Feel free to ask questions.

MTF Anchored VWAPAnchored VWAP is all the rage, but it's just one indicator. That being said, it seems like people want to add more than one at a time so why eat into your indicator cap. This script will allow you to configure 5 AVWAPS at a time.
This will not plot if the time chosen is not in market hour s. Note: market hours may be outside of YOUR timeframe. i.e, the market may open at 7:30 your time, but it will not plot until you change it to 9:30.
Enjoy

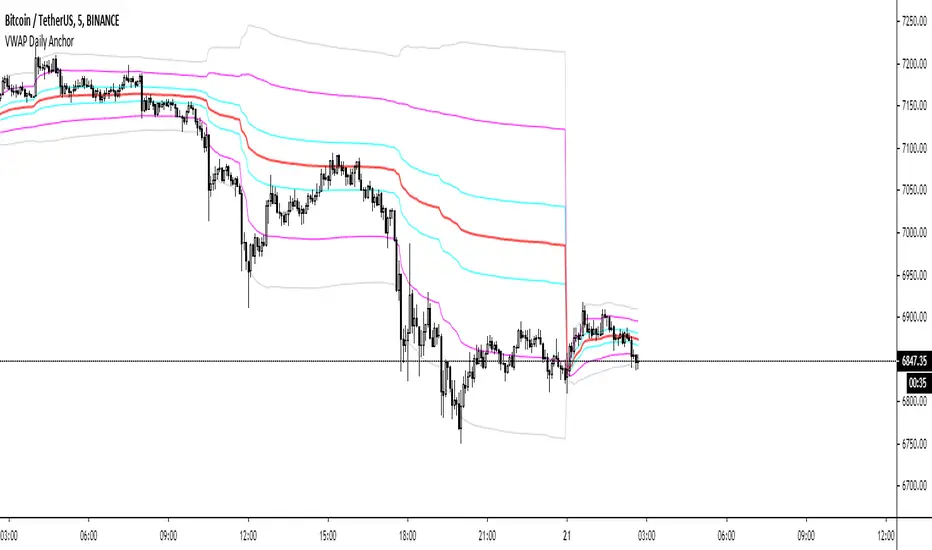
VWAP Daily AnchorAnchored daily VWAP with adjustable standard deviation bands - intended for intraday scalping.
Anchored VWAP is useful because not matter what timeframe you look at it on, it will look the same, unlike normal VWAP indicators. This means there's nothing left to interpretation.
(JS) Multi-Time Frame Pivot Point Detector 2.0So here's an updated version of my automatic Pivot Point detector.
If you don't like having a bunch of Pivots on your chart at once, or having to cycle through various resolutions to see different ones, this is for you!
What does this indicator do? It automatically detects the nearest daily, weekly, and monthly pivot points both above and below the current price and automatically plots them for you. It's really just as simple as that.
You select how far back you want it to plot with the "Pivot Point Look Back Period" option.
I also have transparency options for each type of pivot so its easy to find the opacity you prefer and save it as a default setting.
With "Turn Off Each Pivot Point On All Time Frames" turned on, as an example, if you were to uncheck "S1/R1" then it turns S1/R1 plots off across all 3 pivot resolutions. By default however, I have it set where you can pick and choose each one individually.
I also added the default "VWAP Periodic" script from TradingView in there with it (not in prior version). This works identical to the built in indicator (because it is identical).
Trading algorithms like to target pivot points and liquidity, so I figured they would pair together nicely for active trading.

Midas 6 Anchored VWAP [xdecow]This script plots 6 anchored vwap from the selected bars.
The labels are only to help identify the starting points and can be disabled in the options.
Rolling Anchored VWAPRolling Anchored VWAP
This is my Rolling Anchored VWAP. Instead of being anchored to a fixed point of time, its anchored to a specific time-frame (ex. 24 hours to the minute) so the anchor point is constantly moving with time.
Enjoy

[KICK] Ultimate VWAPsThis indicator provides numerous indicator tools/functions all related to Volume Weighted Price Averages (VWAPs). Specifically the ability to add multiple anchored VWAPs to arbitrary points (highs, lows, significant events such as earnings , flash crashes, etc...) is a very powerful way to see where market participants that were active at those times are in regards those positions relative to current price.
With this indicator you can:
Enable a typical session-based VWAP (resets every session) - does not render line from last candle of session to first candle of new session so as to keep your charts looking a bit neater.
Enable a week-to-date VWAP , month-to-date VWAP , or year-to-date VWAP
Enable an anchored VWAP that can be automatically anchored to the high within the last week (timeframe independent) or to a high within a certain number of candles back, or set to a specific date and time. There is also an "ignore" recent candle filter if using the candle range method for auto-locating the high.
Enable an anchored VWAP that can be automatically anchored to the low within the last week (timeframe independent) or to a low within a certain number of candles back, or set to a specific date and time. There is also an "ignore recent candle" filter if using the candle range method for auto-locating the low.
The week/month/year-to-date VWAP can also be treated as an Ad-Hoc anchored VWAP and have it’s anchor set to an arbitrary date and time.
A support/resistance line can be added in for the last session’s VWAP close.
Z-Score bands can be added (band values configurable) and attached to any of the above VWAPs (Session, AutoHigh, AutoLow, AdHoc/Week/Month/Year). These are calculated using the proper unbiased standard deviation calculation (not the built in PineScript biased stdev function).
(note: not all functionality is shown in the chart above because it would be a mess - all the options for this indicator are not necessarily intended to be used simultaneously on the same chart, though they can be if you really like that sort of thing)
Use the link below to watch a tutorial video, request a trial, or purchase for access.

Anchored VWAP and Swing Failure PatternIndicator that allows to visualize swing failure patterns on every timeframe. The lines are anchored VWAPS that snipe support/resistance.
Feel free to ask question
