CC - PVT CloudsReleasing this test script for PVT ratios using sub-interval harmonics at a 1D, 4H, 1H, 45M, 15M and 5M level.
It basically takes the PVT values for a rolling periodic interval and gets the (avg - min)/max for that interval (the ratio).
Then it colors it based on the subinterval next to it. Just think of it as rolling Ichimoku clouds, but in real-time using PVT.
I'm not saying much more than that, as this is an experimental indicator. Feel free to use it and give me feedback.
Drop a like if this helps you trade, but please do not use these indicators as a DIVINING ROD for your trades.
However, I will possibly release a paid version with TEXTUAL take profit/stoploss indicators.
*DISCLAIMER*
No amount of technical indicators will safe you from a lapse in Due Diligence or Market/Industry Judgement.
I am not responsible for lost equity due to trades caused my relying on this indicator.
Average

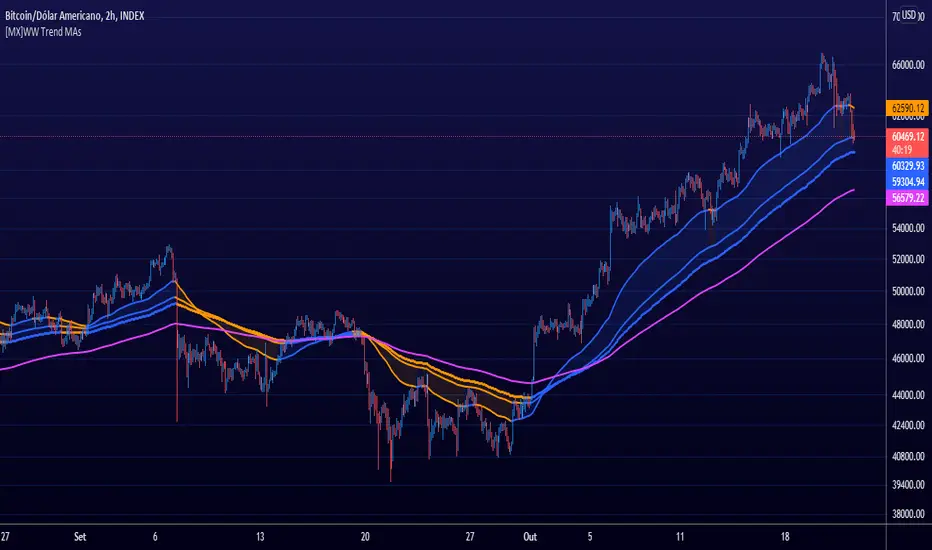
Welles Wilder MA [MX]The average of 34 periods I observe as a mobile S/R, but I usually observe it more when it is in strong trend, and the average of 72 and 89 as trend dictators, if the asset is above them = Bullish , below = Bearish , and the 144 average as the last moving S/R, and also as an S/R even stronger than all other MAs and when the asset loses that average, I see it as final confirmation of the other previous averages.
I give more importance to the average of 89 periods than to 72, because I see it as an extension to the average of 72, as if it were a trend range.
for those who prefer to observe the crossing of short and long averages as a way to see the trend, I also left this option, although I do not use
//////////////////////////////
A média de 34 periodos eu observo como um S/R móvel, mas eu costumo observar ela mais quando está em forte tendência, estando bem bearish ou jeffish, e a média de 72 e 89 como ditadoras de tendência, se o ativo está acima delas = Bullish , abaixo = Bearish , e a média de 144 como o último S/R móvel, e também como um S/R ainda mais forte que todas as outras MA's e quando o ativo perde essa média, eu vejo como confirmação final das outras médias anteriores.
Eu dou mais importância a média de 89 períodos do que a de 72, porque eu vejo ela como uma extensão a média de 72, como se fosse um range de tendência.
para quem prefere observar o cruzamento das médias curtas com as longas como forma de ver a tendência, eu deixei também essa opção, embora eu não use
ETF / Stocks / Crypto - DCA Strategy v1Simple "benchmark" strategy for ETFs, Stocks and Crypto! Super-easy to implement for beginners, a DCA (dollar-cost-averaging) strategy means that you buy a fixed amount of an ETF / Stock / Crypto every several months. For instance, to DCA the S&P 500 (SPY), you could purchase $10,000 USD every 12 months, irrespective of the market price. Assuming the macro-economic conditions of the underlying country remain favourable, DCA strategies will result in capital gains over a period of many years, e.g. 10 years. DCA is the safest strategy that beginners can employ to make money in the markets, and all other types of strategies should be "benchmarked" against DCA; if your strategy cannot outperform DCA, then your strategy is useless.
Recommended Chart Settings:
Asset Class: ETF / Stocks / Crypto
Time Frame: H1 (Hourly) / D1 (Daily) / W1 (Weekly) / M1 (Monthly)
Necessary ETF Macro Conditions:
1. Country must have healthy demographics, good ratio of young > old
2. Country population must be increasing
3. Country must be experiencing price-inflation
Necessary Stock Conditions:
1. Growing revenue
2. Growing net income
3. Consistent net margins
4. Higher gross/net profit margin compared to its peers in the industry
5. Growing share holders equity
6. Current ratios > 1
7. Debt to equity ratio (compare to peers)
8. Debt servicing ratio < 30%
9. Wide economic moat
10. Products and services used daily, and will stay relevant for at least 1 decade
Necessary Crypto Conditions:
1. Honest founders
2. Competent technical co-founders
3. Fair or non-existent pre-mine
4. Solid marketing and PR
5. Legitimate use-cases / adoption
Default Robot Settings:
Contribution (USD): $10,000
Frequency (Months): 12
*Robot buys $10,000 worth of ETF, Stock, Crypto, regardless of the market price, every 12 months since its founding time.*
*Equity curve can be seen from the bottom panel*
Risk Warning:
This strategy is low-risk, however it assumes you have a long time horizon of at least 5 to 10 years. The longer your holding-period, the better your returns. The only thing the user has to keep-in-mind are the macro-economic conditions as stated above. If unsure, please stick to ETFs rather than buying individual stocks or cryptocurrencies.

Tilson T3 and MavilimW Triple Combined StrategyInspired by truly greatful Kivanç Ozbilgic (www.tradingview.com).
The strategy tries to combined three different moving average strategies into one.
Strategies covered are:
1. Tillson T3 Moving Average Strategy
Developed by Tim Tillson, the T3 Moving Average is considered superior to traditional moving averages as it is smoother, more responsive and thus performs better in ranging market conditions as well. However, it bears the disadvantage of overshooting the price as it attempts to realign itself to current market conditions.
It incorporates a smoothing technique which allows it to plot curves more gradual than ordinary moving averages and with a smaller lag. Its smoothness is derived from the fact that it is a weighted sum of a single EMA, double EMA, triple EMA and so on. When a trend is formed, the price action will stay above or below the trend during most of its progression and will hardly be touched by any swings. Thus, a confirmed penetration of the T3 MA and the lack of a following reversal often indicates the end of a trend. Here is what the calculation looks like:
T3 = c1*e6 + c2*e5 + c3*e4 + c4*e3, where:
– e1 = EMA (Close, Period)
– e2 = EMA (e1, Period)
– e3 = EMA (e2, Period)
– e4 = EMA (e3, Period)
– e5 = EMA (e4, Period)
– e6 = EMA (e5, Period)
– a is the volume factor, default value is 0.7 but 0.618 can also be used
– c1 = – a^3
– c2 = 3*a^2 + 3*a^3
– c3 = – 6*a^2 – 3*a – 3*a^3
– c4 = 1 + 3*a + a^3 + 3*a^2
T3 MovingThe T3 Moving Average generally produces entry signals similar to other moving averages and thus is traded largely in the same manner.
Strategy for Tillson T3 is if the close crossovers T3 line and for at least five bars the close was under the T3
2. Tillson T3 Fibonacci Cross
Kivanc Ozbilgic added a second T3 line with a volume factor of 0.618 (Fibonacci Ratio) and length of 3 (fibonacci number) which can be added by selecting the T3 Fibonacci Strategy input box.
Strategy for Tillson T3 Fibo is when the Fibo Line crossover the T3 it gives long signal vice versa.
3. MavilimW
MavilimW is originally a support and resistance indicator based on fibonacci injected weighted moving averages.
Strategy for MavilimW is is if the close crossovers T3 line and for at least five bars the close was under the T3
Hope you enjoy

Average change histogramThis histogram shows the average change in price between the past x candles close. If the average change is increasing the color of the histogram becomes dark green (if above 0) or dark red (if below 0).
This can be used for trend detection or the spotting of parabolas.

MA_CROSSOVER with SL & TPThis is the Moving Average Script Including the Stoploss and Target Levels. By Default it is working on 25 & 40 Parameters but it can change accordingly.
FrameKitHere are the elements that FrameKit adds to your graphic.
The Bollinger Bands of the upper TimeFrame.
As explained above, context bands are present to speed up your analysis and give you interesting areas to position on your local TF.
Also, since there are two elements in the BBs, the bands and the moving average, I have shown you a trace of this moving average for the last 40 candles. This information therefore gives you an additional technical zone to watch out for when the price approaches it, since there could be a price reaction. This may be the less useful information in FrameKit, because I personally use it very little and that's why I only displayed it for the last 40 candles. On the other hand, I don't want to saturate your chart with too much information and leaving the complete MM trace would have been superfluous and useless.
The Bollinger Bands of the local TimeFrame.
The other information that FrameKit offers you is the bollinger bands channel of the local TimeFrame. This channel is called the minor channel. This information is represented by 2 thin lines, identical to BBs. As its name indicates, the minor channel gives us additional information about the local TF and minor market fluctuations. In addition, this channel allows us to secure our position, something we will see in the risk management stage.
A 200-period Moving Average (orange line).
The penultimate information offered by FrameKit is a 200-period moving average. This MM is used a lot by Traders and that's why it's important. The 200MM, combined with another technical framework such as the Fibonacci ratios as instance, offers you once again a better information package and strengthens your conviction about the market and your trading plan. The 200 Moving Average gives a very good idea of the current trend in the medium term and it's always good to keep an eye on it! For example, it can be useful in a context such as pull-back within a trend. Also be aware that you can change the period’s number of the moving average by clicking on the settings button besides the Framekit indicator. Then change the value over EMA Lenght. That said, I recommend using the 200MM since it gives us a good view of the current market.
TD9
Finally, the last information that FrameKit gives us is the TD9 Sequential, that can be activated by going again in the FrameKit settings and checking the box “Show TD9 Sequential”.
Here is the TimeFrame List for the indicator, but you can also access this list with the google sheets on Teachable.
1M = 5M
3M = 15M
5M = 15M
15M = 1H
30M = 2H
1H = 4H
2H = Daily
4H = Daily
Daily = Weekly
Weekly = Monthly
WMA CrossoverNormally we have Moving average which is lagging indicator but in this script we have removed the lag and get signal upfront to maximize the profit and minimize the losses.
This is good for Entry purpose, for exit also it can be used but profit might be less. It is suggested to use one of the below method for exit
Target based
RSI divergence or
Price & Volume Based Analysis
VWAP (Volume for Index (Nifty & BankNifty is not available on Tradingview. Investing.com can be used for the same.)
If need more information on any of the above method, Please comment i will share more information on this either on tradingview or could be on the yourtube video.

UTG - Gravy TrainThe most complex indicator we've ever developed.
Works on ALL MARKETS!
Gravy Train is a ALL IN ONE - ONE GLANCE indicator.
- It allows you to gauge trend, gives you appropriate LONG & SHORT identifiers
- It identifies when the trades should be over
- Cloud based support & resistance Zones drawn on the chart
- It keeps you OUT of the market in areas of indecision
- It works on ALL timeframes
- Takes the emotion out of trading various markets
- Gravy Train is Unity Trading Groups bread and butter for Scalping, Swing Trading, Position Trading & Day Trading
Unity Trading Group is proud to present Gravy Train!
To gain access to this script, you can find our details in our Signature, use the links below to find out!
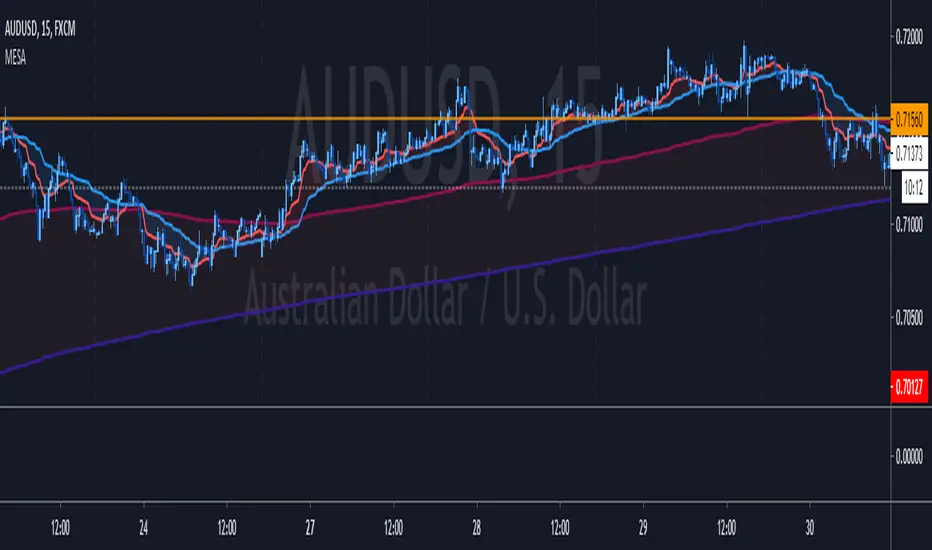
MESA Adaptive Moving Average - Improved MTFThis indicator is a huge upgrade to my original MTF MESA
Plots are now extremely smooth and accurate on all timeframes **
Missing data points are automatically filled with the "best fit"
This is a Trend indicator and should be used to trade "top-down" aka:
Start with the Daily chart to confirm a trend
Move to 4H
2H
Etc...
Use your favorite entry method or simply watch for wicks forming when the price gets near the MESA adaptive moving average.
This is one of the few indicators that I've been using for years with success. Being able to plot both the current & higher timeframe MESA
can sometimes feel like cheating.
Due to the nature of the recursive calculation, you may notice slight differences between this version of MESA and others that either
approximate higher timeframes with fewer samples or make use of the latest "Resolution" argument in Pinescript V4. Both of which are
fine, until you start looking at M5 charts while plotting the Daily MESA.
As always, happy trading!
** Currently supports
M 1,3,5,15,30,45
H 1,2,3,4
Day 1
Week 1
Month 1
Pre-Market Volume ProfileThis indicator displays the pre-market volume (note: without the post-market of the previous day).
Unusual pre-market volume often indicates that institutional market makers are moving the market, which is a good sign for unusual high price movement.
The indicator helps me to spot stocks, if a pre-market gap is confirmed with enough (unusual) volume.
You can define, what "unusual" means by you, by adjusting the SMA length and the SMA multiplier.
The default is a length of 21 bars and a 2.5 multiplier, meaning I'm interested in a stock, if the pre-market volume exceeds the average pre-market volume by 2.5 times.

Volume Weighted DeviationsVolume !weighted!
deviations.
Important: I don't really know how people generally compute deviations from VWAP/VWMA, but smth tells me generally it's just a Av Dev/St Dev based on mean, not on appropriate basis, like volume weighted mean in our case. This version is mathematically correct, it first calculates weighted mean, than utilizes this weighted in mean in AvDev & StDef functions modified to take into account weights.

SIDD-Master-Moving-AverageSIDD-Master-Moving-Average is based on RSI average calculation Moving average plotted on chart.
This Moving Average is giving 2 signals Bullish and Bearish .
Whenever Bullish signals is coming price is doing crossover with moving average on upside and this indicate price will go up from current market price.
Whenever Bearish signals is coming price is doing cross-under with moving average on downside and this indicate price will go down from current market price.
Moving average color is changing based on upside movement or downside movement , for upside its green and for downside its orange color.
This indicator i have created with stop loss line means any price close below cross line for bullish position then that trade should be closed and take the stop loss. similarly for Bearish trade and candle close above stop loss line means trade should be closed and take the stop loss.
Stop loss i have taken care with ATR and Super trend you can see the settings.
I have defined setting for general use of indicator if any modification on setting then result may vary.
Its multi time frame moving average. And I have given time frame for indicator as well so if any trending move need to capture then that setting need to be increased with respect to chart time frame else keep it same.
I have added commission and slippages as well in indicator.
Ping me or DM me to subscribe this indicator.
I have given all my indicator details below link (Signature URL). You can check indicators and call me on given number or email me on given email to access the scripts and indicators. Telegram link is also given you can ping me there.
--------------------------------------------------------------------------------------------------------------------------------------
Disclaimer : Past performance of the indicator is not giving guarantee for future performance as well, it may change as per market condition.
-------------------------------------------------------------------------------------------------------------------------------------

SMA's AverageReturn the average of simple moving averages with periods starting from min to max that is:
avg(sma(src,min),sma(src,min+1),...,sma(src,max))
The user can choose three types of weightings for the average, "simple", "linear", and "least squares".
Settings
Min : minimum period of the sma
Max : maximum period of the man, must be higher than "Min"
Src : input data of the indicator
Type : type of weighting, available options are "Simple", "Linear" or "Least Squares", by default "Simple"
Usage
The moving average can be used like any other classical moving average. The different types of weightings change the behavior of the moving average, the simple weighting will weight all the moving averages equally, a linear weighting will use the weighting function of a WMA, as such moving averages with lower periods will receive higher weights, this decrease the lag of the moving average. Finally, the least-squares weighting uses the weighting function of a least-squares moving average, this allows to drastically reduce the lag of the moving average.
in red the moving average using simple weighting, in blue linear weighting, and in orange least squares weighting, with all using min = 14 and max = 28.
In red the moving average with min = 50 and max = 200, in blue a LSMA of period 200, notice how the moving average has less overshoots.
Details
Computing the average of various simple moving averages is simple, remember that a simple moving average can be computed using a cumulative sum:
Sma = change(cum(src),length)/length
we can't compute various "sma" functions with changing length argument within a for loop, but we can still differentiate within it, as such the cumulative sum method is super efficient and convenient.
The impulse response of this moving average is rectangular for the first "min" values, then the impulse is tailed, with the weighting method defining the shape of the tail.
in red the simple weighting method, in blue the linear method, and in orange the least-squares method.
Our moving average is an FIR moving average, as such the output lag is a linear characteristic of the moving average, which imply that:
Lag = Avg(lag(Sma(min)),lag(Sma(min+1))...,lag(max))
where lag is the lag of the moving average, in the case of a simple weighting we have:
Lag = Avg((min-1)/2,(min+1-1)/2,...,(max-1)/2) = Avg((min-1)/2,(max-1)/2)
a linear weighting gives a lag of:
Lag = Avg((min-1)/3,(min+1-1)/3,...,(max-1)/3) = Avg((min-1)/3,(max-1)/3)
Summary
A script computing the average of various moving averages has been presented, this MA might not be super useful to the everyday analyst but it stills have some great potential. Thx for reading.
This indicator is dedicated to my sister Lea, happy birthday kokoro
Harmonic MADsNo, it's not a new saturation plugin for your fruity loops.
...
These are Mean Average Deviations calculated from Harmonic Mean.
...
In my previous research I tried to develop "Harmonic Average Deviations", since applying stdevs on Harmonic Mean calculated from reciprocals ain't make sense. Din't work out, prolly cuz by definition stdevs doesn't like negatives. So in the end I ended up using Mean Average Deviations, and turned out it works great. Generally market data doesn't distribute normally, so t's a great tool, now weird kurtosis won't be a problem.

[R&D] Harmonic deviationsI'm publishing it for research purposes & welcome any ideas and/or explanations whether it's actually possible or nah to do what I'm doing right now.
...
Idea is simple - if we can do Harmonic Mean, can we do Harmonic Standard Deviations? It should be the same logic, the only difference is instead of actual datapoints we gotta use reciprocals.
In reality I've found smth really curios, it's possible to get these Harmonic Standard Deviations, however, somewhy, depends on your timeframe, u gotta do final sqrt different amount of times. And looks like... the market reacts to these levels.
That's why in the script settings there is a menu where you can choose how many times to perform sqrt operation.
Pls check it out, play with it, see maybe you'll see smth interesting.

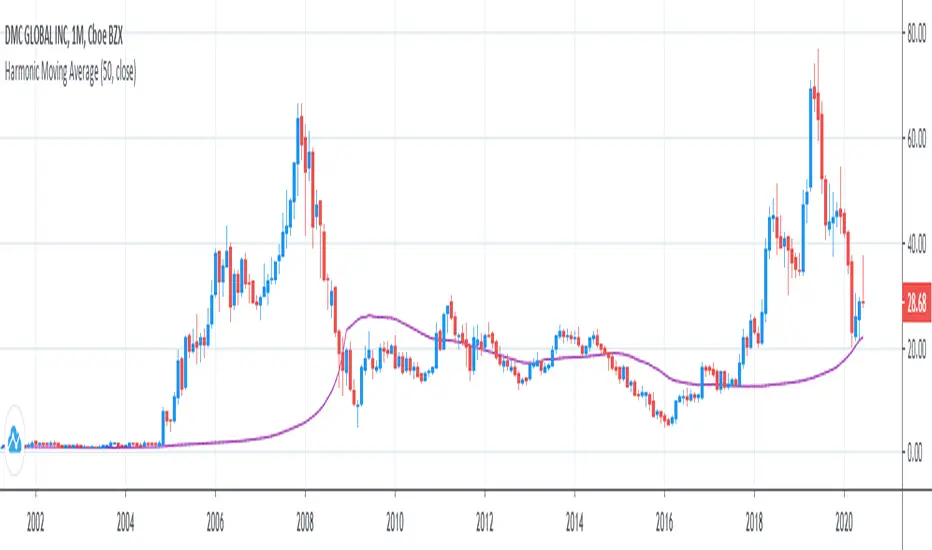
Harmonic Moving AverageI was legitimately surprised no1 has already coded it out on TradingView, but you guys can copypaste & include it in Pine 5 if your see this xd
Here is it.
I've checked and double checked everything, the calculations are right, it can be proved by plotting mean, geometric mean & harmonic mean together and noticing that geometric mean will be always between Harmonic mean, which is always below, and Mean, which is always above.
...
Other central tendency measures are also here as well for usability.
[RS]Cyclic Interval Average PriceEXPERIMENTAL:
Cyclic interval price averaging at every x bars.
Lines for trend line and intra trend slope(not working as intended).

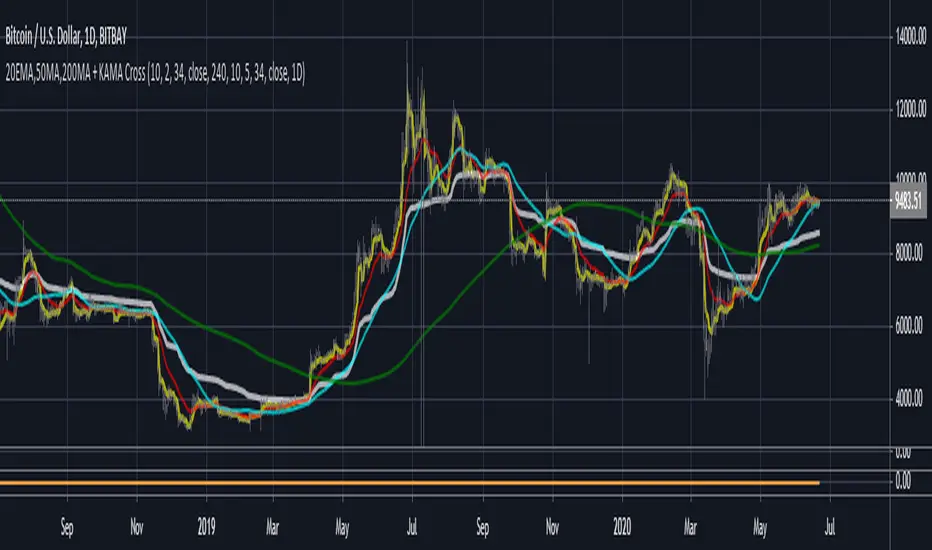
3MA'S + KAMA Trend (20EMA,50MA,200MA + KAMA Trend)This indicator, combines the traditional FOREX moving averages (20EMA, 50ma, 200ma) into a single indicator with
an adaptive moving average (AMA) taken from a user defined timeframe to show trend direction (by default, it plots
the daily 10/2/34 KAMA overlayed on any timeframe chart.
An AMA moves slowly when markets are sideways but swiftly during periods of volatility as a result it reacts much fast than
traditional options for moving average trends.
If the price is above the KAMA, trend is up. Below the KAMA, trend is down.
Moving Average Above / BelowEnglish:
Due to changes made by TradingView, my old script "Moving Average Trend-Buschi" is no longer functioning. Please use this indicator.
Description:
This script shows via selectable sorts of Moving Averages (normal, weighted or exponential) the amount of units (e. g. trading days) that are currently above (value in green) or under (value in red) the main series. The value is shown on the indicator line as an argument.
Due to the changes mentioned above, please add the corresponding built-in moving average as a separate indicator.
Deutsch:
Aufgrund von Änderungen seitens TradingView funktioniert mein altes Skript "Moving Average Trend-Buschi" nicht mehr. Bitte benutzt diesen Indikator.
Beschreibung:
Das Skript zeigt über auswählbare gleitende Durchschnitte (normal, gewichtet oder exponentiell) die Anzahl an Einheiten (z. B. Handelstage) auf, die zum jeweiligen Zeitpunkt hintereinander über (in grün) oder unter (in rot) dem Hauptsymbol verlaufen. Der Wert wird in der Indikator-Zeile als Argument angezeigt.
Aufgrund der oben beschriebenen Änderungen müsst / könnt ihr noch den zugehörigen eingebauten gleitenden Durchschnitt als separaten Indikator hinzufügen.

Daily Moving Averages on Intraday ChartsPrints exponential 8, 21, 50, 100 and 200-day moving averages on intraday charts. For example, if you are on a 5 minute chart, you will see a magenta "X" making the current value of the 8-day EMA with an "8" label above it.
This is NOT a Strat script and it follows more closely the way Scott Redler from T3Live looks at charts. If you acknowledge that the vast majority of the time, price does have some sort of reaction to these daily EMAs (whether just a short relative pause or the beginning of a reversal), this script may be helpful.
The Strat and Rob Smith DO NOT support the use of moving averages. This adds more data to your chart which you may or may not find extraneous.

ATR _NormalizedThis script is good to use with Williams %R indicator, to find out when price has bottomed out.
ATR has to be over 90 and Williams %R ( lenght 52 ) has to be over 95 to find out level around which one is good to buy.
You can check back, to see that this worked very well over history. Best way to use this 2 indicators is with DCA ( dollar cost average ), as area where to buy can go a little bit down and up for as long as few months. So dont just jump in, use DCA .
