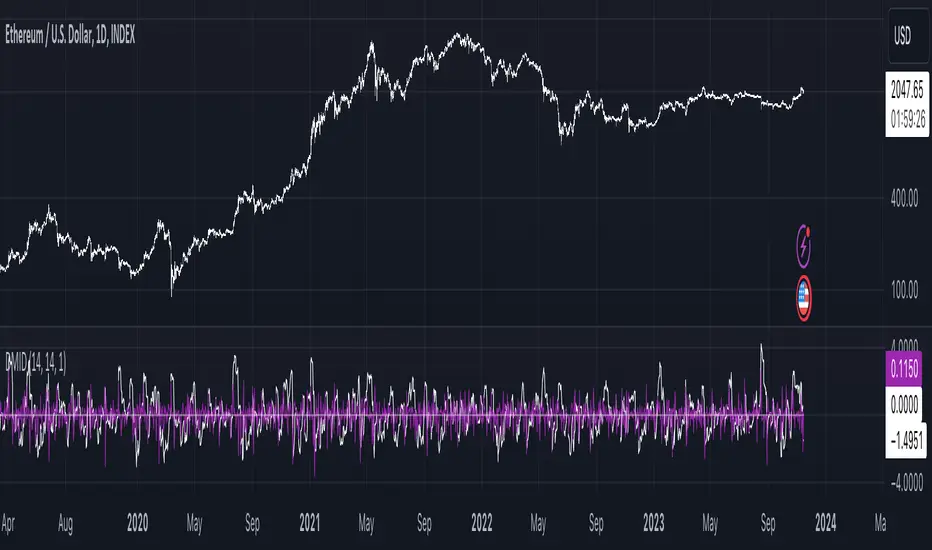
ADX Speed DerivativeThe ADX Speed Derivative (ADXSD) is a cutting-edge trading indicator meticulously crafted for trend analysis. By harnessing the power of the Average Rate Of Change (AROC) method applied to the first and second derivatives (pictured in white and purple, respectively) of the ADX oscillator, this indicator transcends conventional tools, offering traders unparalleled insights into market dynamics.
Key Features and Analysis Capabilities:
The ADXSD stands out with its ability to detect shifts in market trend directions, precisely quantify the speed and intensity of those transitions, and gauge the weakening or strengthening of prevailing trends. This comprehensive toolkit is designed for traders who demand accuracy and nuance in their technical analysis.
AROC Differentiation:
Unlike traditional ADX-based indicators, the ADXSD incorporates the AROC method, offering a nuanced perspective on trend acceleration or deceleration. The first derivative provides insight into the simplest rate of change, while the second derivative unveils the acceleration or deceleration of the trend, empowering traders with a deeper understanding of market dynamics.
Signal Precision:
This indicator excels at pinpointing potential trend reversals and transitions. Utilizing AROC on the ADX oscillator, it generates precise signals marked on the chart, giving traders timely and actionable information to make informed decisions.
Customization and Adaptability:
The ADXSD offers a range of customization options to cater to diverse trading strategies. Traders can adjust the lookback parameters to align with their risk tolerance and preferences, ensuring a personalized and adaptive approach to technical analysis.
Trend Visualization:
Incorporating a visual approach, this indicator enhances the interpretation of market trends. Traders can quickly identify shifts in trend strength and direction by observing midline crossovers, providing a visual guide for strategic decision-making.
Comprehensive Analysis:
The ADXSD serves as a comprehensive tool for traders seeking in-depth insights into market trends. It complements existing technical indicators, offering a holistic approach to market analysis.
平均方向性指数 (ADX)
Easy To Trade indicatorAbstract
This script evaluates how easy for traders to trade.
This script computes the level that the gains were distributed in many trading days.
We can use this indicator to decide the instruments and the time we trade.
Introduction
Why we think the trading markets are boring?
It is because most of the gains were concentrated in a few trading days.
We look for instruments we can buy at support and sell at resistance frequently and repeatedly.
However, it does not happen usually because it is difficult to find sellers sell at support and buyers buy at resistance.
This script is a method to measure if an instrument is difficult to trade.
If most of the gains were concentrated in a few trading days, this script says it is difficult to trade.
If gains were distributed in many trading days and we can buy low and sell high repeatedly, this script says it is easy to trade.
Therefore, this script measure how difficult for us to trade by the ratio between the area of value and the total gain.
How it works
1. Determine the instruments and time frames we are interested in.
2. Determine how many days this script evaluate the result. This number may depend on how many days from you buy in to you sell out.
3. If the instrument you choose is easy to trade, this script reports higher values.
4. If the instrument is long term bullish, the number "easy to invest" is usually higher than the number "easy to short" .
5. We can consider trade instruments which are easier to trade than others.
6. We can consider wait until the period that it is difficult to trade has past or keep believing that some instruments are easier to trade than others.
Parameters
x_src = The price for each trading day this script use. It may be open , high , low , close or their combination.
x_is_exp = Whether this script evaluate the price movement in exponential or logarithm. You are advised to answer yes if the price changes drastically.
x_period = How many days this script evaluate the result.
Conclusion
With this indicator , we have data to explain how easy or difficult an instrument is for traders . In other words , if we hear some people say the trading markets are boring or difficult for traders , we can use this indicator to verify how accurate their comments are.
With this explainable analysis , we have more knowledge about which instruments and which sessions are relative easy for us to buy low and sell high repeatedly and frequently , we can have better proceeding than buy and hold simply.

ADX Trend Confirmer [Honestcowboy]The ADX Trend Confirmer aims to give traders or algorithms a way to confirm a trend before entering a trade.
While the default for ADX is a smoothing factor of 14 and a length of 14 to measure directional strength. In my experience this is a lagging indicator and not the best for confirming if the market is trending.
🟢 What are the methods used for confirming trend in this indicator?
ADX above x number : By default we use an ADX length of 3 and it's value needs to be above 50.
ADX sloping up ? This will check if the ADX value is higher than that of previous bar, this to confirm that trend is getting momentum and not slowing down.
close>open / close

SOFEX Strong Volatility Trend Follower + BacktestingWhat is the SOFEX Strong Volatility Trend Follower + Backtesting script?
🔬 Trading Philosophy
This script is trend-following, attempting to avoid choppy markets.
It has been developed for Bitcoin and Ethereum trading, on 1H timeframe.
The strategy does not aim to make a lot of trades, or to always remain in a position and switch from long to short. Many times there is no direction and the market is in "random walk mode", and chasing trades is futile.
Expectations of performance should be realistic.
The script focuses on a balanced take-profit to stop-loss ratio. In the default set-up of the script, that is a 2% : 2% (1:1) ratio. A relatively low stop loss and take profit build onto the idea that positions should be exited promptly. There are many options to edit these values, including enabling trailing take profit and stop loss. Traders can also completely turn off TP and SL levels, and rely on opposing signals to exit and enter new trades.
Extreme scenarios can happen on the cryptocurrency markets, and disabling stop-loss levels completely is not recommended. The position size should be monitored since all of it is at risk with no stop-loss.
⚙️ Logic of the indicator
The Strong Volatility Trend Follower indicator aims at evading ranging market conditions. It does not seek to chase volatile, yet choppy markets. It aims at aggressively following confirmed trends. The indicator works best during strong, volatile trends, however, it has the downside of entering trades at trend tops or bottoms.
This indicator also leverages proprietary adaptive moving averages to identify and follow strong trend volatility effectively. Furthermore, it uses the Average Directional Index, Awesome Oscillator, ATR and a modified version of VWAP, to categorize trends into weak or strong ones. The VWAP indicator is used to identify the monetary (volume) inflow into a given trend, further helping to avoid short-term manipulations. It also helps to distinguish choppy-market volatility with a trending market one.
📟 Parameters Menu
The script has a comprehensive parameter menu:
Preset Selection : Choose between Bitcoin or Ethereum presets to tailor the indicator to your preferred cryptocurrency market.
Indicator Sensitivity Parameter : Adjust the sensitivity to adapt the indicator, particularly to make it seek higher-strength trends.
Indicator Signal Direction : Set the signal direction as Long, Short, or Both, depending on your preference.
Exit of Signals : You have options regarding Take-Profit (TP) and Stop-Loss (SL) levels. Enable TP/SL levels to exit trades at predetermined levels, or disable them to rely on direction changes for exits. Be aware that removing stop losses can introduce additional risk, and position sizing should be carefully monitored.
By enabling Trailing TP/SL, the system switches to a trailing approach, allowing you to:
- Place an initial customizable SL.
- Specify a level (%) for the Trailing SL to become active.
- When the activation level is reached, the system moves the trailing stop by a given Offset (%).
Additionally, you can enable exit at break-even, where the system places an exit order when the trail activation level is reached, accounting for fees and slippage.
Alert Messages : Define the fields for alert messages based on specific conditions. You can set up alerts to receive email, SMS, and in-app notifications. If you use webhooks for alerts, exercise caution, as these alerts can potentially execute trades without human supervision.
Backtesting : Default backtesting parameters are set to provide realistic backtesting performance:
- 0.04% Commission per trade (for both entries and exits)
- 3 ticks Slippage (highly dependent on exchange)
- Initial capital of $1000
- Order size of $1000
While the order size is equal to the initial capital, the script employs a 2% stop-loss order to limit losses and attempts to prevent risky trades from creating big losses. The order size is a set dollar value, so that the backtesting performance is linear, instead of using % of capital which may result in unrealistic backtesting performance.
Risk Disclaimer
Please be aware that backtesting results, while valuable for statistical overview, do not guarantee future performance in any way. Cryptocurrency markets are inherently volatile and risky. Always trade responsibly and do not risk more than you can afford to lose.

SOFEX High-End Indicators + BacktestingBINANCE:BTCUSDT.P BINANCE:ETHUSDT.P
Introducing the first publicly available suite of indicators for Bitcoin and Ethereum by Sofex - the High-End Indicators & Backtesting System.
🔬 Trading Philosophy
The High-End Indicators & Backtesting system offers both trend-following and mean-reversal algorithms to provide traders with a deep insight into the highly volatile cryptocurrency markets, known for their market noise and vulnerability to manipulation.
With these factors in mind, our indicators are designed to sidestep most potentially false signals. This is facilitated further by the "middle-ground" time frame (1 Hour) we use. Our focus is on the two largest cryptocurrencies: Bitcoin and Ethereum , which provide high liquidity, necessary for reliable trading.
Therefore, we recommend using our suite on these markets.
The backtesting version of the Sofex High-End Indicators includes mainly trend-following indicators. This is because our trading vision is that volatility in cryptocurrency markets is a tool that should be used carefully, and many times avoided. Furthermore, mean-reversal trading can lead to short-term profits, but we have found it less than ideal for long-term trading.
The script does not aim to make a lot of trades, or to always remain in a position and switch from long to short. Many times there is no direction and the market is in "random walk mode", and chasing trades is futile.
Based on our experience, it is preferable if traders remain neutral the majority of the time and only enter trades that can be exited in the foreseeable future. Trading just for the sake of it ultimately leads to loss in the long-run.
Expectations of performance should be realistic.
We also focus on a balanced take-profit to stop-loss ratio. In the default set-up of the script, that is a 2% : 2% (1:1) ratio. A relatively low stop loss and take profit build onto our idea that positions should be exited promptly. There are many options to edit these values, including enabling trailing take profit and stop loss. Traders can also completely turn off TP and SL levels, and rely on opposing signals to exit and enter new trades.
Extreme scenarios can happen on the cryptocurrency markets, and disabling stop-loss levels completely is not recommended. The position size should be monitored since all of it is at risk with no stop-loss.
We take pride in presenting this comprehensive suite of trading indicators, designed for both manual and automated use. Although automated use leads to increased efficiency, traders are free to incorporate any of our indicators into their own manual trading strategy.
⚙️ Indicators
By default, all indicators are enabled for both Long and Short trades.
Extreme Trend Breakouts
The Extreme Trend Breakouts indicator seeks to follow breakouts of support and resistance levels, while also accounting for the unfortunate fact that false signals can be generated on these levels. The indicator combines trend-breakout strategies with various other volatility and direction measurements. It works best in the beginning of trends.
Underpinning this indicator are renowned Perry Kaufman's Adaptive Moving Averages (PKAMA) alongside our proprietary adaptive moving averages. These dynamic indicators adjust their parameters based on recent price movements, attempting to catch trends while maintaining consistent performance in the long run.
In addition, our modification of the TTM Squeeze indicator further enhances the Extreme Trend Breakouts indicator, making it more responsive, especially during the initial stages of trends and filtering of "flat" markets.
High-Volatility Trend Follower
The High-Volatility Trend Follower indicator is based around the logic of evading market conditions where volatility is low (choppy markets) and aggressively following confirmed trends. The indicator works best during strong trends, however, it has the downside of entering trades at trend tops or bottoms.
This indicator also leverages our proprietary adaptive moving averages to identify and follow high-volatility trends effectively. Furthermore, it uses the Average Directional Index, Aroon Oscillator, ATR and a modified version of VWAP, to categorize trends into weak or strong ones. The VWAP indicator is used to identify the monetary (volume) inflow into a given trend, further helping to avoid short-term manipulations.
Low-Volatility Reversal
The Low-Volatility Reversal aims at plugging the holes that trend-following indicators ignore. It specifically looks for choppy markets. Using proven concepts such as Relative Strength Index and volume measurements, among others, this indicator finds local tops and bottoms with good accuracy. It works best in choppy markets with low to medium volatility. It has a downside that all reversals have, losing trades at the end of choppy markets and in the beginning of big trends.
This indicator, like the others, employs PKAMA in conjunction with our proprietary adaptive moving averages, and an Average PSAR indicator to seek out "sideways" markets. Furthermore, Bollinger Bands with an adaptive basis line is used, with the idea of trading against the short-term trends by looking at big deviations in price movement. The above mentioned indicators attempt to catch local tops and bottoms in markets.
Adaptive Trend Convergence
The Adaptive Trend Convergence aims at following trends while avoiding entering positions at local bottoms and tops. It does so by comparing a number of adaptive moving averages and looking for convergence among them. Adaptive filtering techniques for avoiding choppy markets are also used.
This indicator utilizes our proprietary adaptive moving averages, and an Average Price Range indicator to identify trend convergence and divergence effectively, preventing false signals during volatile market phases. It also makes use of Bollinger Bands with an adaptive moving average basis line and price-action adjusted deviation. Contrasting to the Low-Volatility Reversal condition described above, the Bollinger Bands used here attempt to follow breakouts outside of the lower and upper bands.
Double-Filtered Channel Breakouts
The Double-Filtered Channel Breakouts indicator is made out of adaptive channel-identifying indicators. The indicator then follows trends that significantly diverge from the established channels. This aims at following extreme trends, where rapid, continuous movements in either direction occur. This indicator works best in very strong trends and follows them relentlessly. However, these strong trends can end in strong reversals, and the indicator can be stopped out on the last trade.
Our Double-Filtered Channel Breakouts indicator is built on a foundation of adaptive channel indicators. We've harnessed the power of Keltner Channels and Bollinger Band Channels, with a similar approach used in the Adaptive Trend Convergence indicator. The basis and upper/lower bands of the channels do not rely on fixed deviation parameters, rather on adaptive ones, based on price action and volatility. This combination seeks to identify and follows extreme trends.
Direction Tracker
The Direction Tracker indicator is made out of a central slower, adaptive moving average that clearly recognizes global, long-term trends. Combined with direction and range indicators, among others, this indicator excels at finding the long-term trend and ignoring temporary pullbacks in the opposite direction. It works best at the beginning and middle of long and strong trends. It can fail at the end of trends and on very strong historical resistance lines (where sharp reversals are common).
Our Direction Tracker indicator integrates an adaptive SuperTrend indicator into its core, alongside our proprietary adaptive moving averages, to accurately identify and track long-term trends while mitigating temporary pullbacks. Furthermore, it uses Average True Range, ADX and other volatility indicators to attempt to catch unusual moves on the market early-on.
📟 Parameters Menu
To offer traders flexibility, our system comes with a comprehensive parameter menu:
Preset Selection : Choose between Bitcoin or Ethereum presets to tailor the indicators to your preferred cryptocurrency market.
Global Signal Direction: Set the global signal direction as Long, Short, or Both, depending on your trading strategy.
Global Sensitivity Parameter : Adjust the system's sensitivity to adapt to different trend-following conditions, particularly beneficial during higher-strength trends.
Source of Signals : Toggle individual indicators on or off according to your preference. By default, all indicators are enabled. Customize the indicators to trade Long, Short, or Both, aligning them with your desired market exposure.
Confirmation of Signals : Set the minimum number of confirmed signals on the same bar, ensuring signals are generated only when specific confirmation criteria are met. The default value is one, and it can be adjusted for both Long and Short signals.
Exit of Signals : You have options regarding Take-Profit (TP) and Stop-Loss (SL) levels. Enable TP/SL levels to exit trades at predetermined levels, or disable them to rely on direction changes for exits. Be aware that removing stop losses can introduce additional risk, and position sizing should be carefully monitored.
By enabling Trailing TP/SL, the system switches to a trailing approach, allowing you to:
- Place an initial customizable SL.
- Specify a level (%) for the Trailing SL to become active.
- When the activation level is reached, the system moves the trailing stop by a given Offset (%).
Additionally, you can enable exit at break-even, where the system places an exit order when the trail activation level is reached, accounting for fees and slippage.
Alert Messages : Define the fields for alert messages based on specific conditions. You can set up alerts to receive email, SMS, and in-app notifications. If you use webhooks for alerts, exercise caution, as these alerts can potentially execute trades without human supervision.
Backtesting : Default backtesting parameters are set to provide realistic backtesting performance:
- 0.04% Commission per trade (for both entries and exits)
- 3 ticks Slippage (highly dependent on exchange)
- Initial capital of $1000
- Order size of $1000
While the order size is equal to the initial capital, the script employs a 2% stop-loss order to limit losses and attempts to prevent risky trades from creating big losses. The order size is a set dollar value, so that the backtesting performance is linear, instead of using % of capital which may result in unrealistic backtesting performance.
Risk Disclaimer
Please be aware that backtesting results, while valuable for statistical overview, do not guarantee future performance in any way. Cryptocurrency markets are inherently volatile and risky. Always trade responsibly and do not risk more than you can afford to lose.

TTP SuperTrend ADXThis indicator uses the strength of the trend from ADX to decide how the SuperTrend (ST) should behave.
Motivation
ST is a great trend following indicator but it's not capable of adapting to the trend strength.
The ADX, Average Directional Index measures the strength of the trend and can be use to dynamically tweak the ST factor so that it's sensitivity can adapt to the trend strength.
Implementation
The indicator calculates a normalised value of the ADX based on the data available in the chart.
Based on these values ST will use different factors to increase or reduce the factor use by ST: expansion or compression.
ST expansion vs compression
Expanding the ST would mean that the stronger a trends get the ST factor will grow causing it to distance further from the price delaying the next ST trend flip.
Compressing the ST would mean that the stronger a trends get the ST factor will shrink causing it to get closer to the price speeding up the next ST trend flip.
Features
- Alerts for trend flip
- Alerts for trend status
- Backtestable stream
- SuperTrend color gets more intense with the strength of the trend

Support Resistance BreakthroughThe Support Resistance Breakthrough (SRB) is a comprehensive technical indicator that aims to evaluate market strength and detect potential breakout opportunities. It integrates the following elements:
ADX (Average Directional Index): Helps measure the overall trend strength. You can adjust both the ADX length and smoothing length.
ATR (Average True Range): Provides a measure of market volatility.
RSI (Relative Strength Index): Measures the momentum and helps identify overbought or oversold conditions.
Weighting Scheme: The weighting scheme adds or subtracts a fraction of the ROC of RSI, modulated by ATR and ADX. The weighting percentage can be customized.
Normalization Option: Allows the user to plot normalized values, scaling them between 0 and 100.
Horizontal Lines: Useful reference lines at 0, 50, and 100, displayed when normalization is used.
Interpretation: When the indicator is above the 0 line (or 50 when normalized), there's a high chance of breaking through resistance. Conversely, when it's below the 0 line, there's a high chance of breaking through support. Together with a momentum indicator, such as RSI and/or Stochastic RSI, this indicator functions excellently.
The combination of these elements makes the SRB an adaptable tool for various trading strategies. It can help identify potential breakout or breakdown areas and gauge the underlying strength of the market.
Compatibility with Adjustable Fibonacci Retracement Indicator: Together with the SRB indicator, the AFIBR can make it easier to determine the likelihood of breaking through support or resistance.

Directional Movement Index FLEXA common problem experienced by short term traders using DMI/ADX is that the session breaks results in carry-over effects from the prior session. For example, a large gap up would result in a positive DMI, even though momentum is clearly negative. Note the extremely different results in the morning session, when the gap is reversed.
The DMI-FLEX algoritm resets the +DI and -DI values to the prior session ending midpoint, so that new momentum can be observed from the indicator. (Note for Pinescript coders: rma function does not accept series int, thus the explicit pine_rma function)
DMI-FLEX has the added feature that the ADX value, instead of a separate line, is shown as shading between the +DI and -DI lines, and the color itself is determined by whether +DI is above -DI for a bullish color, or -DI is above +DI for a bearish color.
DMI Flex also gives you the flexibility of inverse colors, in case your chart has inverted scale.
Summary and How to use:
1) Green when +DI is above -DI
2) Red when -DI is above +DI
3) Deeper shading represents a higher ADX value.

Buy Only Strategy with Dynamic Re-Entry and ExitThe strategy aims to create a simple buy-only trading system based on moving average crossovers and the Weekly Commodity Channel Index (CCI) or Weekly Average Directional Index (ADX). It generates buy signals when the fast-moving average crosses above the slow-moving average and when the Weekly CCI and or Weekly ADX meet the specified conditions.
The strategy also allows for dynamic re-entry, which means it can open new long positions if the price goes above the three moving averages after an exit. However, the strategy will exit the long position if the price closes below the third moving average.
ENTRY CONDITIONS
The script defines the conditions for generating buy signals. It checks for two conditions for a valid buy signal:
• If the fast-moving average crosses above the slow-moving average -THERE IS Dynamic Re-Entry also
• If the user chooses HE OR SHE CAN FILTER TRADES BY USING CCI OR ADX
Dynamic Re-Entry:
the script allows for dynamic re-entry. If there is no active long position and the price is above all three moving averages a new long position is opened.
Exit Conditions
The script defines the exit condition for closing a long position. If the price closes below the third moving average, the script closes the long position.
IMPORTANT NOTICE
ONLY DAILY TIME FRAME
THERE WOULD BE WHIPSAW USE YOUR OWN ACCUMEN TO MINIMISE THEM
ITS ONLY BUY STRATEGY
EXIT CAN BE STRATEGY BASED OR SET PROFIT AND TARGETS AS PER RISK APETITE /RISK MANAGEMENT
DONT TRADE OPTIONS ON THIS
SUITABLE FOR STOCKS OF USA AND INDIAN MARKETS
ALWAYS REMEMBER TO DO YOUR OWN RESEARCH BEFORE TRADING AND INVESTING

ADXcellenceThis advanced trading indicator, inspired by Dr. Charles B. Schaap's book "ADXcellence: Power Trend Strategies", leverages the principles of the Average Directional Index (ADX) to help traders identify and exploit trending conditions in the market.
The ADXcellence Indicator uses multiple levels of analysis to evaluate the strength and direction of trends.
In addition to the classic ADX+DMI input settings, these features are included:
ADX Slope Signal: This parameter, controls the sensitivity of the ADX slope, which will indicate when the trend strength is increasing or decreasing.
The indicator provides three trend levels: strong trend level, trending level, and low volatility level, which can be customized to suit various trading strategies.
The color gradients for the ADX, DI+, and DI- lines are designed to visually represent the trend strength from the low volatility level to the strong trend level. The indicator also uses a dynamic background color, highlighting the periods when the ADX is rising. The color will vary depending on the dominant DI.
The ADXcellence Indicator also offers a unique feature of dynamically adjusting the fill between DI+ and DI-, with the color and fill intensity changing based on the relative value of the two.
This indicator is a powerful tool for traders who use trend-following strategies and is best used in conjunction with other technical analysis tools to confirm signals and avoid potential false signals.
Remember, no indicator is perfect and every trading strategy should include risk management and proper due diligence.
Enjoy :)

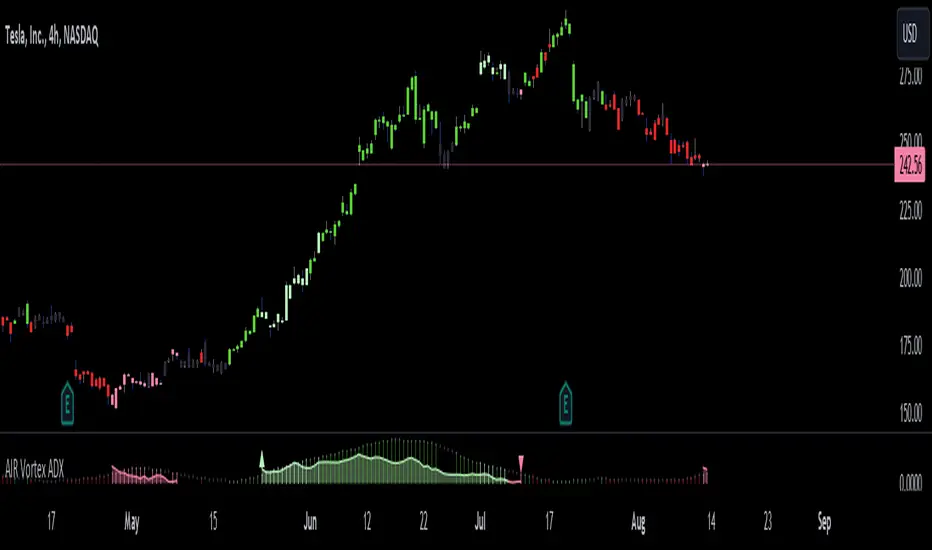
AIR Vortex ADXThis project started as an effort to improve the user interface of the hybrid indicator ADX of Vortex, which is, as per the name, a blend of ADX and Vortex Indicator. Plotting both indicators on the same polarity and normalising the vortex, a better interpretation of the interaction between the two is possible, and trend becomes apparent.
Basically, the Vortex provides the bright punch and ADX the continuation of the trend and momentum.
A range mixer has been added to the vortex, comprising both true and interpercentile ranges (see my previous script for a desrciption of interpercentile range). Users can activate and add amounts of each as they see fit.
Finally, there is an RSI filter, the idea of which is to filter out ranging (flat) markets, where no distinct direction is yet emerging.
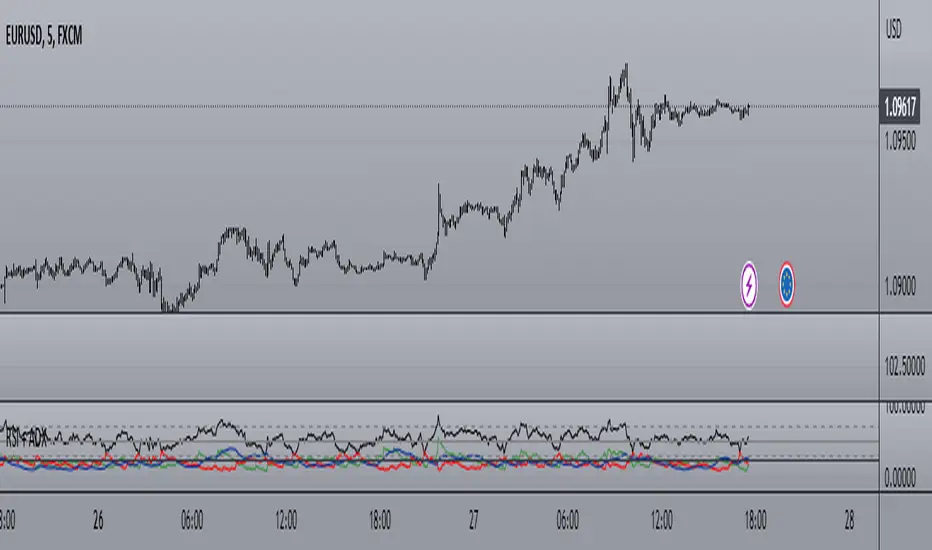
RSI + ADX + MACDINDICADOR COMBINADO DE RSI + ADX
Aprovecha las ventajas de cada indicador en uno solo.
Teniendo en un solo indicador el momentum de cada tendencia y la fuerza relativa con sus puntos de sobre compra y sobre venta.
También al poder analizar divergencias en el indicador oscilador RSI y poder crear estrategias de entrada con el ADX
-------------------------------------------------------------------------------------------------------------------------------------------------------------------------------
RSI + ADX COMBINED INDICATOR
Take advantage of each indicator in one.
Having in a single indicator the momentum of each trend and the relative strength with its points of overbought and oversold.
Also by being able to analyze divergences in the RSI oscillator indicator and being able to create entry strategies with the ADX
DERECHOS DEL CREADOR PARA: Dvd_trading
Ta StrategyHello guys
This script follows traditional technical indicators
MACD, ADX, RSI and pivot points
If the price is above the resistance and the MACD has crossover ,and the RSI 14 is above 50
ADX is higher than 20, and DI+ is higher than DI-. This is a buy signal and vice versa for a sell signal
The script moves the stop loss to the entry price after the first target is reached
You can specify the quantity you want to sell when the price reaches the first target
There are also options like if you want the script to entry long or short, or both
you can reverse the strategy if it does not work well
If you want to inquire about any details, please let me know in the comments

Chop and Trend Index (CTI)The Chop and Trend Index (CTI) is a unique indicator that provides a different perspective on market conditions compared to traditional oscillators. It is designed to identify periods of market chop and strong trends, and it does so by combining two key components: the number of halfback taps and the strength of the trend.
The CTI is calculated by first determining the number of halfback taps over a user-defined length of time. A halfback tap occurs when the high or low of a bar reaches the midpoint (halfback level) of the previous bar. This is a measure of market chop: the more halfback taps, the choppier the market. The fewer halfback taps, the stronger the trend.
The strength of the trend is determined using the Average Directional Index (ADX), a popular trend strength indicator. The ADX is calculated based on the directional movement of the market, with higher values indicating stronger trends.
The CTI combines these two components by multiplying the normalized number of halfback taps by the ADX value. This results in an indicator that rises during strong trends with few halfback taps (either up or down) and falls during periods of market chop.
The CTI is not a directional indicator. Unlike the Relative Strength Index (RSI) or other oscillators, high values do not indicate overbought conditions, and low values do not indicate oversold conditions. Instead, high values indicate a strong trend (and possibly trend exhaustion), while low values indicate strong chop (and possibly an impending breakout in either direction).
The CTI can be used on any market and any timeframe, but it may be particularly useful on longer timeframes where periods of chop and trend are more pronounced.
The CTI includes several user inputs :
Length : This determines the number of bars over which the number of halfback taps is calculated. Increasing this value will make the CTI less sensitive to recent market conditions, while decreasing it will make the CTI more sensitive.
Normalization Window Length : This determines the number of bars over which the CTI is normalized. The CTI is normalized to a scale of 0 to 100 to make it easier to compare across different markets and timeframes.
Chop Threshold : This is the CTI value below which an alert will be triggered indicating a period of severe chop. This could signal an impending breakout and potential upcoming volatility.
Trend Exhaustion Threshold : This is the CTI value above which an alert will be triggered indicating potential trend exhaustion. This could signal a possible mean reversion.
The CTI also includes four colored threshold lines at 10, 25, 75, and 90. These thresholds can be used as a guide to identify periods of chop and trend. For example, CTI values below 10 or above 90 could indicate extreme conditions.
The CTI provides two alert conditions :
Low Threshold Crossed : This alert is triggered when the CTI falls below the user-defined Chop Threshold. This could signal a period of severe chop and the potential for upcoming volatility.
High Threshold Crossed : This alert is triggered when the CTI rises above the user-defined Trend Exhaustion Threshold. This could signal potential trend exhaustion and the possibility of mean reversion.
In conclusion, the CTI is a unique and versatile indicator that can provide valuable insights into market conditions. By identifying periods of chop and trend, it can help traders anticipate potential breakouts and reversals, and adjust their strategies accordingly.

Volatility Adjusted ADX (VADX)I sincerely wish to express my heartfelt gratitude to the vast community of coders on TradingView who have previously crafted various Average Directional Index (ADX) scripts. Their innovative approaches have laid a solid foundation, and I'm incredibly grateful for their inspiring work. In essence, their accomplishments have ignited the creative spark that led to the development of the Volatility Adjusted ADX (VADX) script.
VADX is not your run-of-the-mill script. It distinguishes itself from the myriad of ADX indicators on TradingView due to its unique volatility-adjustment mechanism. The primary purpose of this script is to augment the ADX's ability to quantify trend strength by introducing a layer of sensitivity to volatility shifts through the Average True Range (ATR). The interaction between these two crucial market measurements is where the novelty lies.
While the standard ADX does an excellent job of diagnosing the trend's vigor, its evaluation can sometimes be skewed when markets oscillate between periods of high and low volatility. Integrating the ATR – a reliable indicator of market volatility – into the ADX calculation mitigates this limitation, resulting in a more robust, volatility-adjusted trend strength measurement.
The specifics of the mathematical adjustment, our secret ingredient, will remain undisclosed for proprietary reasons. Nevertheless, I assure you that it creates a dynamic and balanced interplay between the trend strength and volatility, enabling a more nuanced understanding of the market.
The VADX script is user-friendly and includes three main inputs: ADX Smoothing, DI Length, and ATR Length. The ADX Smoothing parameter refines the ADX calculation, DI Length determines the period for the Directional Movement System calculation, and the ATR Length sets the period for the Average True Range.
Using this indicator is as easy as pie. After adding it to your chart, VADX will manifest itself as a separate panel beneath your price chart. When the VADX is escalating, it indicates that the strength of the trend is intensifying. Conversely, a declining VADX suggests diminishing trend strength. Two horizontal lines at the 25 and 75 levels provide a simple interpretation guide – they denote weak and strong trend phases, respectively.
This robust indicator is adaptable and can be effectively applied across multiple markets - from stocks, forex, and futures to cryptocurrencies. It also delivers valuable insights on any timeframe. However, as with any new indicator, I highly recommend initial testing and optimization to match your unique trading style and objectives.
To wrap up, the VADX indicator sets itself apart with its novel volatility adjustment, a feature not commonly found in existing TradingView scripts. This distinctive capability affords traders a more comprehensive view of the trend's strength by accounting for market volatility, adding an extra layer of depth to traditional ADX interpretation. I sincerely hope that this script enriches your trading arsenal and assists you in navigating the market with enhanced precision. As always, happy trading!

Dynamic Action Convergence DivergenceGoodbye MACD. Hello DACD.
The Dynamic Action Convergence Divergence (DACD) indicator presents a unique approach to understanding market trends and potential price reversals. This indicator is distinctly different from the currently published scripts in the following ways:
1. The DACD is rooted in the principles of the Average Directional Index (ADX) — especially as construed by the helpful work of @robertkowalski — but innovates by focusing on the divergence and convergence of the directional movement indicators (DI+ and DI-). This focus offers a more dynamic perspective on price action.
2. The DACD incorporates a histogram representation of the difference between DI+ and DI-, making it easier to visually interpret periods of divergence (potential reversal points) and convergence (potential continuation points).
3. It further enhances interpretation by applying a familiar color scheme to the histogram, allowing for an immediate visual understanding of the trend direction and its strength.
4. Unique to the DACD, it scales the difference between DI+ and DI-, applies a moving average, and then represents this as a line on the graph (referred to as "DI+ - DI-"). This line provides a smoothed view of the difference between DI+ and DI-, offering additional insight into the trend's characteristics.
5. Finally, a second moving average is calculated over the "DI+ - DI-" line, creating a signal line akin to the MACD's signal line. This signal line provides a benchmark to the "DI+ - DI-" line, indicating potential points of trend exhaustion and reversal.
The DACD can be used across various markets, including equities, commodities, forex, and cryptocurrencies, making it a versatile tool for any trader's arsenal. As with any technical indicator, the DACD should be used in conjunction with other indicators and forms of analysis to confirm signals and make more informed trading decisions.
The DACD excels in trending markets where it can highlight potential continuation and reversal points. However, during periods of consolidation or sideways moving markets, the DACD may provide less reliable signals. Therefore, it's essential to consider the overall market context when using the DACD.
The originality of the DACD lies in its novel application of the concepts from the ADX, its unique presentation style, and the additional moving averages applied to the difference between DI+ and DI-. These factors contribute to a unique trading indicator that stands apart from the crowd and offers new opportunities for technical analysis.
~~~
POSTSCRIPT: DACD VS MACD
Goodbye MACD. Hello DACD.
The MACD and DACD, while visually similar due to the familiar color scheme, are fundamentally different in their logic and data processing.
MACD is a trend-following momentum indicator, using the relationship between two moving averages of a security’s price. Its color scheme is well-recognized, assisting traders in quickly interpreting market momentum and potential trend shifts.
On the other hand, DACD, while maintaining a similar visual style for ease of adoption, is rooted in the principles of the Average Directional Index (ADX). It focuses on the divergence and convergence of the directional movement indicators (DI+ and DI-), providing a dynamic perspective on price action.
The familiar color scheme is purposefully used to facilitate easier transition for traders from MACD to DACD, despite their different underpinnings. This allows users to intuitively understand the new indicator while benefiting from its unique insight into market trends.

Strategy Creator5 indicators. Backtesting available. Uses ADX, RSI, Stochastic, MACD, and crossing EMAs (1,2, or 3). This strategy creator allows you to turn on or off these indicators and adjust the parameters for each indicator. It allows you to make one trade at a time e.g the next trade doesn't open until the last one closes. (You are also able to enter how many trades in one direction you want for example if you want only 2 long trades in a row, then the strategy waits for the next short position without making anymore long trades. Once there are 2 short positions in a row, it waits for a long position). The code can be edited to for automated trading by editing the comment in the source code for the strategy parameters. This took many hours to finish. ENJOY.

ADX Trend FilterADX Trend Filter Indicator is a traditional ADX indicator with a different presentation. its consist of two indicators EMA TREND and ADX / DMI
About Indicator:
1. BAND / EMA band to represent EMA Trend of EMA-12 and EMA-50
(Band is plotted at level-20 which is the Threshold level of DMI / ADX indicator)
2. Histogram showing the direction of ADX / DMI trend
3. Area behind the histogram showing ADX/DMI strength
How to use?
1. Histogram represents current Trend Red for Bearish / Green for Bullish
2. Area behind the histogram represents Strength of ADX / DMI Threshold level is 0-20(represented as band). (Area below the Band is Sideways)
3. Band represents the current MA Trend.
4. Buy Sell signals are plotted as triangles in red/green obtained from ADX / DMI Crossovers
Buy Signal (Green Triangle on band- ADX Crossover)
1.Band below Histogram must be Green
2.Histogram must be green
3.Area behind histogram must be above the lower trend band (20level) and visible
Sell Signal (Red Triangle on band- ADX Crossover)
1.Band below Histogram must be Red
2.Histogram must be Red
3.Area behind histogram must be above the lower trend band (20level) and visible
Alerts provided for ADX crossovers.

Adaptive Fusion ADX VortexIntroduction
The Adaptive Fusion ADX DI Vortex Indicator is a powerful tool designed to help traders identify trend strength and potential trend reversals in the market. This indicator uses a combination of technical analysis (TA) and mathematical concepts to provide accurate and reliable signals.
Features
The Adaptive Fusion ADX DI Vortex Indicator has several features that make it a powerful tool for traders. The Fusion Mode combines the Vortex Indicator and the ADX DI indicator to provide a more accurate picture of the market. The Hurst Exponent Filter helps to filter out choppy markets (inspired by balipour). Additionally, the indicator can be customized with various inputs and settings to suit individual trading strategies.
Signals
The enterLong signal is generated when the algorithm detects that it's a good time to buy a stock or other asset. This signal is based on certain conditions such as the values of technical indicators like ADX, Vortex, and Fusion. For example, if the ADX value is above a certain threshold and there is a crossover between the plus and minus lines of the ADX indicator, then the algorithm will generate an enterLong signal.
Similarly, the enterShort signal is generated when the algorithm detects that it's a good time to sell a stock or other asset. This signal is also based on certain conditions such as the values of technical indicators like ADX, Vortex, and Fusion. For example, if the ADX value is above a certain threshold and there is a crossunder between the plus and minus lines of the ADX indicator, then the algorithm will generate an enterShort signal.
The exitLong and exitShort signals are generated when the algorithm detects that it's a good time to close a long or short position, respectively. These signals are also based on certain conditions such as the values of technical indicators like ADX, Vortex, and Fusion. For example, if the ADX value crosses above a certain threshold or there is a crossover between the minus and plus lines of the ADX indicator, then the algorithm will generate an exitLong signal.
Usage
Traders can use this indicator in a variety of ways, depending on their trading strategy and style. Short-term traders may use it to identify short-term trends and potential trade opportunities, while long-term traders may use it to identify long-term trends and potential investment opportunities. The indicator can also be used to confirm other technical indicators or trading signals. Personally, I prefer to use it for short-term trades.
Strengths
One of the strengths of the Adaptive Fusion ADX DI Vortex Indicator is its accuracy and reliability. The indicator uses a combination of TA and mathematical concepts to provide accurate and reliable signals, helping traders make informed trading decisions. It is also versatile and can be used in a variety of trading strategies.
Weaknesses
While this indicator has many strengths, it also has some weaknesses. One of the weaknesses is that it can generate false signals in choppy or sideways markets. Additionally, the indicator may lag behind the market, making it less effective in fast-moving markets. That's a reason why I included the Hurst Exponent Filter and special smoothing.
Concepts
The Adaptive ADX DI Vortex Indicator with Fusion Mode and Hurst Filter is based on several key concepts. The Average Directional Index (ADX) is used to measure trend strength, while the Vortex Indicator is used to identify trend reversals. The Hurst Exponent is used to filter out noise and provide a more accurate picture of the market.
In conclusion, the Adaptive Fusion ADX DI Vortex Indicator is a versatile and powerful tool for traders. By combining technical analysis and mathematical concepts, this indicator provides accurate and reliable signals for identifying trend strength and potential trend reversals. While it has some weaknesses, its many strengths and features make it a valuable addition to any trader's toolbox.
---
Credits to:
▪️@cheatcountry – Hann Window Smoohing
▪️@loxx – VHF and T3
▪️@balipour – Hurst Exponent Filter

Momentum PlayTraders always need a confirmation of momentum in price action to ride the swings.
Momentum Play Indicator consists of the below:
Bullish Conditions :
1)EMA 8 above EMA 34 and rising
2)Candle close above 5 candle high
3) RSI above 60
4) Volume above 5 candles avg. volume
5) ADX above 20
Bearish Conditions :
1)EMA 8 below EMA 34 and falling
2)Candle close below 5 candle low
3) RSI below 40
4) Volume above 5 candles avg. volume
5) ADX above 20
Traders can change the inputs as per their liking to adjust as per their comfortable timeframe.
Credits: Special Thanks to Mr. DTBHAT for sharing the above conditions.

ADX trend reversal/continuation spotterThis indicator is based on ADX and uses a method based on pivot points to identify a possible trend reversal or trend continuation.
To better understand how to use this indicator, follow these instructions:
Check which type of line ADX is below/above.
If the ADX line is above the green line and has changed color, you can expect a possible trend change.
Similarly, if the ADX line is below the red line and has changed color, you can expect a continuation of the previous trend or a possible trend uptake based on the current situation in the chart.
FX:EURUSD

Soheil PKO's 5 min Hitman Scalp - 3MA + Laguerre RSI + ADX [Pt]Someone sent me this strategy found on YouTube. It is Soheil PKO's "The Best and Most Profitable Scalping Strategy" Best way to find out is to code it =)
This strategy uses Moving Average Ribbon, Laguerre RSI, and ADX. This script only displays the MA ribbon, you will need to add Laguerre RSI and ADX separately.
Long Entry Criteria:
- 16 EMA > 48 EMA > 200 SMA
- Laguerre RSI > 80
- ADX > 20
Long Exit Criterion:
- 16 EMA < 48 EMA
Short Entry Criteria:
- 16 EMA < 48 EMA < 200 SMA
- Laguerre RSI < 20
- ADX > 20
Short Exit Criterion:
- 16 EMA > 48 EMA
As mentioned in the video, risk management is very important, especially for scalping strategies. Therefore, I've added option for setting Stop Loss and Price Target in the options for you guys to play with.
All parameters are configurable.
Enjoy~~

GKD-V Jurik DMX [Loxx]Giga Kaleidoscope Jurik DMX is a Volatility/Volume module included in Loxx's "Giga Kaleidoscope Modularized Trading System".
█ Giga Kaleidoscope Modularized Trading System
What is Loxx's "Giga Kaleidoscope Modularized Trading System"?
The Giga Kaleidoscope Modularized Trading System is a trading system built on the philosophy of the NNFX (No Nonsense Forex) algorithmic trading.
What is an NNFX algorithmic trading strategy?
The NNFX algorithm is built on the principles of trend, momentum, and volatility. There are six core components in the NNFX trading algorithm:
1. Volatility - price volatility; e.g., Average True Range, True Range Double, Close-to-Close, etc.
2. Baseline - a moving average to identify price trend
3. Confirmation 1 - a technical indicator used to identify trends
4. Confirmation 2 - a technical indicator used to identify trends
5. Continuation - a technical indicator used to identify trends
6. Volatility/Volume - a technical indicator used to identify volatility/volume breakouts/breakdown
7. Exit - a technical indicator used to determine when a trend is exhausted
How does Loxx's GKD (Giga Kaleidoscope Modularized Trading System) implement the NNFX algorithm outlined above?
Loxx's GKD v1.0 system has five types of modules (indicators/strategies). These modules are:
1. GKD-BT - Backtesting module (Volatility, Number 1 in the NNFX algorithm)
2. GKD-B - Baseline module (Baseline and Volatility/Volume, Numbers 1 and 2 in the NNFX algorithm)
3. GKD-C - Confirmation 1/2 and Continuation module (Confirmation 1/2 and Continuation, Numbers 3, 4, and 5 in the NNFX algorithm)
4. GKD-V - Volatility/Volume module (Confirmation 1/2, Number 6 in the NNFX algorithm)
5. GKD-E - Exit module (Exit, Number 7 in the NNFX algorithm)
(additional module types will added in future releases)
Each module interacts with every module by passing data between modules. Data is passed between each module as described below:
GKD-B => GKD-V => GKD-C(1) => GKD-C(2) => GKD-C(Continuation) => GKD-E => GKD-BT
That is, the Baseline indicator passes its data to Volatility/Volume. The Volatility/Volume indicator passes its values to the Confirmation 1 indicator. The Confirmation 1 indicator passes its values to the Confirmation 2 indicator. The Confirmation 2 indicator passes its values to the Continuation indicator. The Continuation indicator passes its values to the Exit indicator, and finally, the Exit indicator passes its values to the Backtest strategy.
This chaining of indicators requires that each module conform to Loxx's GKD protocol, therefore allowing for the testing of every possible combination of technical indicators that make up the six components of the NNFX algorithm.
What does the application of the GKD trading system look like?
Example trading system:
Backtest: Strategy with 1-3 take profits, trailing stop loss, multiple types of PnL volatility, and 2 backtesting styles
Baseline: Hull Moving Average as shown on the chart above
Volatility/Volume: Jurik DMX as shown on the chart above
Confirmation 1: Arron as shown on the chart above
Confirmation 2: Williams Percent Range
Continuation: Fisher Transform
Exit: Rex Oscillator
Each GKD indicator is denoted with a module identifier of either: GKD-BT, GKD-B, GKD-C, GKD-V, or GKD-E. This allows traders to understand to which module each indicator belongs and where each indicator fits into the GKD protocol chain.
Giga Kaleidoscope Modularized Trading System Signals (based on the NNFX algorithm)
Standard Entry
1. GKD-C Confirmation 1 Signal
2. GKD-B Baseline agrees
3. Price is within a range of 0.2x Volatility and 1.0x Volatility of the Goldie Locks Mean
4. GKD-C Confirmation 2 agrees
5. GKD-V Volatility/Volume agrees
Baseline Entry
1. GKD-B Baseline signal
2. GKD-C Confirmation 1 agrees
3. Price is within a range of 0.2x Volatility and 1.0x Volatility of the Goldie Locks Mean
4. GKD-C Confirmation 2 agrees
5. GKD-V Volatility/Volume agrees
6. GKD-C Confirmation 1 signal was less than 7 candles prior
Continuation Entry
1. Standard Entry, Baseline Entry, or Pullback; entry triggered previously
2. GKD-B Baseline hasn't crossed since entry signal trigger
3. GKD-C Confirmation Continuation Indicator signals
4. GKD-C Confirmation 1 agrees
5. GKD-B Baseline agrees
6. GKD-C Confirmation 2 agrees
1-Candle Rule Standard Entry
1. GKD-C Confirmation 1 signal
2. GKD-B Baseline agrees
3. Price is within a range of 0.2x Volatility and 1.0x Volatility of the Goldie Locks Mean
Next Candle:
1. Price retraced (Long: close < close or Short: close > close )
2. GKD-B Baseline agrees
3. GKD-C Confirmation 1 agrees
4. GKD-C Confirmation 2 agrees
5. GKD-V Volatility/Volume agrees
1-Candle Rule Baseline Entry
1. GKD-B Baseline signal
2. GKD-C Confirmation 1 agrees
3. Price is within a range of 0.2x Volatility and 1.0x Volatility of the Goldie Locks Mean
4. GKD-C Confirmation 1 signal was less than 7 candles prior
Next Candle:
1. Price retraced (Long: close < close or Short: close > close )
2. GKD-B Baseline agrees
3. GKD-C Confirmation 1 agrees
4. GKD-C Confirmation 2 agrees
5. GKD-V Volatility/Volume Agrees
PullBack Entry
1. GKD-B Baseline signal
2. GKD-C Confirmation 1 agrees
3. Price is beyond 1.0x Volatility of Baseline
Next Candle:
1. Price is within a range of 0.2x Volatility and 1.0x Volatility of the Goldie Locks Mean
3. GKD-C Confirmation 1 agrees
4. GKD-C Confirmation 2 agrees
5. GKD-V Volatility/Volume Agrees
█ Jurik DMX
What is Jurik DMX?
DMX is the ultra-smooth, low lag version of your classic DMI indicator. With DMX on your charts, you can throw away both DMI and ADX.
Requirements
Inputs
Confirmation 1 and Solo Confirmation: GKD-V Volatility / Volume indicator
Confirmation 2: GKD-C Confirmation indicator
Outputs
Confirmation 2 and Solo Confirmation: GKD-E Exit indicator
Confirmation 1: GKD-C Confirmation indicator
Continuation: GKD-E Exit indicator
Additional features will be added in future releases.
