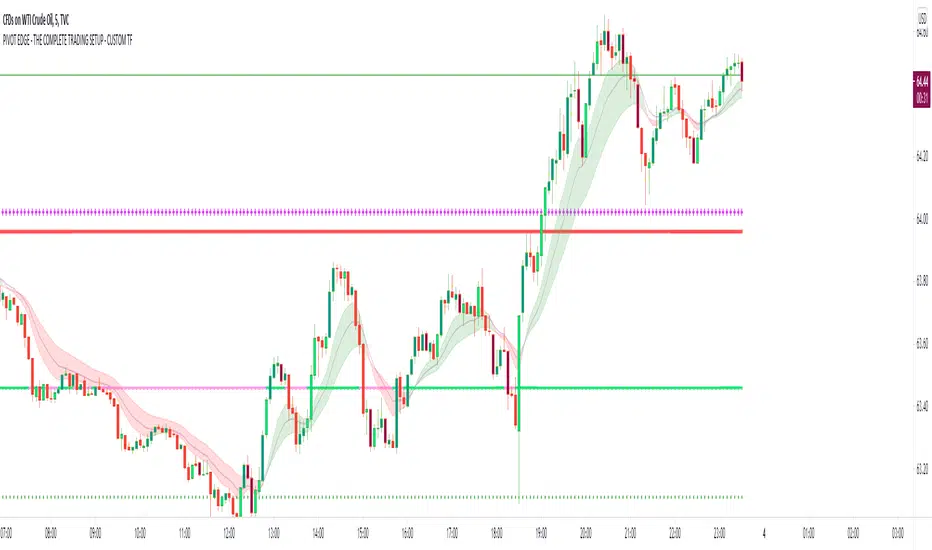
PIVOT EDGE - THE COMPLETE TRADING SETUP - CUSTOM TFIntroduction to the Indicator " PIVOT EDGE - The complete trading setup - CUSTOM TF " It means custom timeframe
The Foundation layout for this indicator is based on PIVOT's which are nothing but the most important levels that the price has respected in the past. The values for the pivots are derived from the key attributes of the price in any timeframe such as the OPEN, HIGH, LOW and CLOSE. These define the mood of the price and where it intends to move in relation to the previous range formed. Earlier HIGH - LOW i.e the RANGE indicates the possible movement that a stock can make in the current session and as per the calculated pivots we can possible find out the tentative supports and resistances. In addition to this indicator, It is advisable to use the price action theory which helps in taking a right decision for entries.
This indicator by itself is complete in nature, i.e it guides the user for possible entry levels and the projected targets that we can achieve and also the likely stop loss limit in case the price reverses. So beforehand even before entering into a trade position, the user can ascertain what can be his loss or max profit and then he can chose an optimum position size for favorable results.
The beauty of this Indicator lies in the fact that it can be used for all types of trading like Scalping, Intra day, Swing or Positional and Investments also. It works on all timeframes and across all market segments like EQUITY, COMMODITIES , FUTURES , OPTIONS , FOREX etc.
This indicator can be used for any exchange and any time zone also without any changes or adjustments needed.
Now let us understand the features of this Indicator in detail.
TIMEFRAME - It has options to choose between Day, week and month as timeframe. By default it is set to Day timeframe
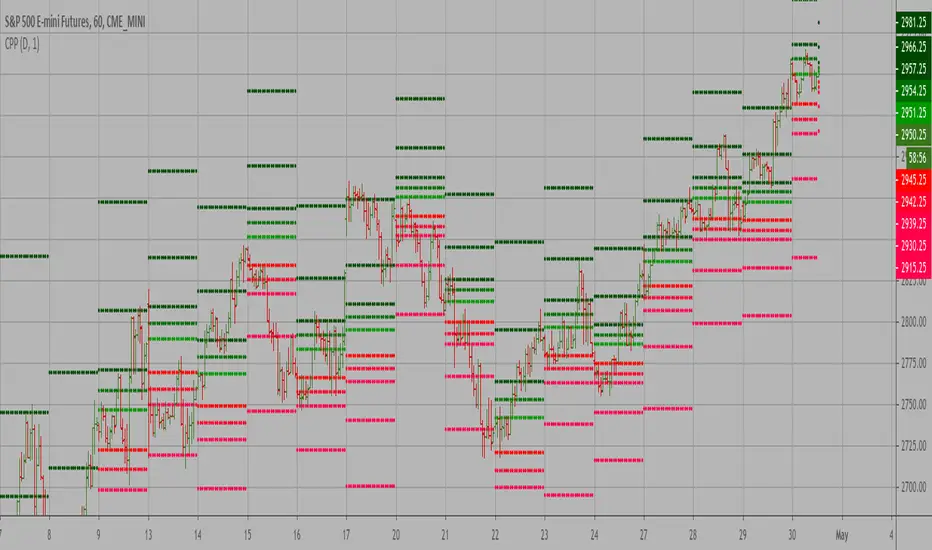
DISPLAY MAJOR LEVELS - These are the important support and resistance levels calculated based on the past price data. Most important ones are marked in BOLD RED and BOLD GREEN between which the price tends to move generally.
Apart from these, We have breakout level marked in light green and if price breaks this level we can expect targets upto extended levels and beyond marked in blue.
we also have breakdown level marked in light red and if price breaks this level we can expect targets down up to extended levels and below it marked in blue.
In addition I have coded intermediate target levels that appear in light gray between the extended levels or blue lines. Sometimes when the gap between these targets are huge, price cannot reach the targets and reverses at these intermediate targets. You can use them as targets or trailing stop loss based on your plan
DISPLAY HIDDEN LEVELS - These levels are intermediate supports and resistances that can be used whenever the present day indicated range is very wide. Whenever we have an explosive moments in market the range of that day is very huge and so he next day support and resistance band becomes very wide indicating the sideways movement day within that range. And on those days we can switch on the hidden levels and the price respects these levels and most of the days it is inside this range only.
DISPLAY PREVIOUS HIGH / LOW / CLOSE - I have included Daily / Weekly and monthly levels. It is important to know the earlier highs / lows and close since price respects it very must just like support and resistance .
PEMA - This is an important EMA based indicator which potentially indicates curves of support and resistance during retracements or pullbacks. If the curves are breached then the trend is reversed and the price will tend to move to the next pivots .
IMPORTANT NOTE : This indicator does not guarantee any favorable results nor protect your from any loss. You own the complete risk of your trades. It is suggested that you use this indicator and do back testing for considerable period to understand how it works the the potential win rate it can give. If you have any doubts or need any clarifications of assistance in understanding, you can message me and I will try to help.
Happy and Safe trading - Mohan from PIVOT EDGE
カマリラ・ピボットポイント
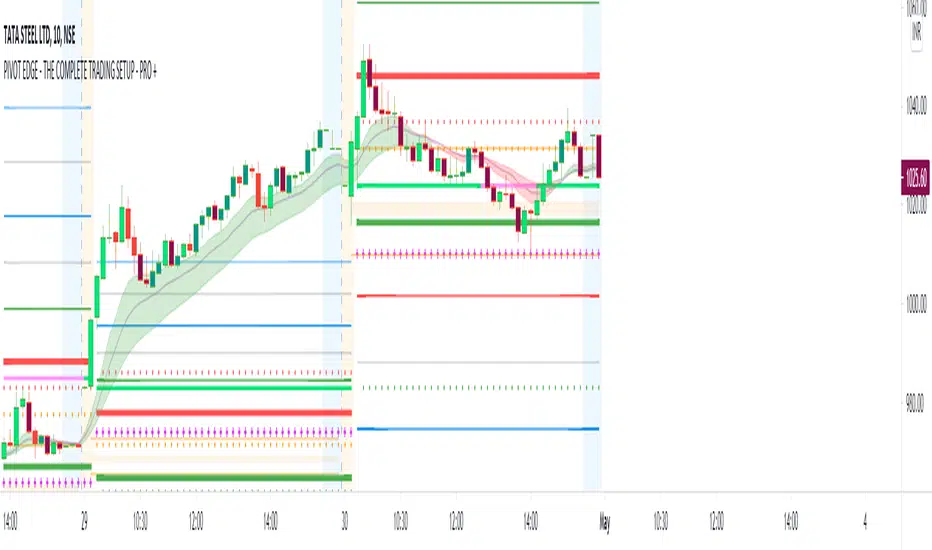
PIVOT EDGE - THE COMPLETE TRADING SETUP - PRO +Introduction to the Indicator " PIVOT EDGE - The complete trading setup - PRO+ "
The Foundation layout for this indicator is based on PIVOT's which are nothing but the most important levels that the price has respected in the past.The values for the pivots are derived from the key attributes of the price in any timeframe such as the OPEN, HIGH, LOW and CLOSE. These define the mood of the price and where it intends to move in relation to the previous range formed.Earlier HIGH - LOW i.e the RANGE indicates the possible movement that a stock can make in the current session and as per the calculated pivots we can possible find out the tentative supports and resistances. In addition to this indicator, It is advisable to use the price action theory which helps in taking a right decision for entries.
This indicator by itself is complete in nature, i.e it guides the user for possible entry levels and the projected targets that we can achieve and also the likely stop loss limit in case the price reverses. So beforehand even before entering into a trade position, the user can ascertain what can be his loss or max profit and then he can chose an optimum position size for favorable results.
The beauty of this Indicator lies in the fact that it can be used for all types of trading like Scalping, Intra day, Swing or Positional and Investments also. It works on all timeframes and across all market segments like EQUITY, COMMODITIES , FUTURES , OPTIONS , FOREX etc.
This indicator can be used for any exchange and any time zone also without any changes or adjustments needed.
Now let us understand the features of this Indicator in detail.
TIMEFRAME - It has options to choose between Day, week and month as timeframe. By default it is set to Day timeframe
DISPLAY MAJOR LEVELS - These are the important support and resistance levels calculated based on the past price data. Most important ones are marked in BOLD RED and BOLD GREEN between which the price tends to move generally.
Apart from these, We have breakout level marked in light green and if price breaks this level we can expect targets upto extended levels and beyond marked in blue.
we also have breakdown level marked in light red and if price breaks this level we can expect targets down up to extended levels and below it marked in blue.
In addition I have coded intermediate target levels that appear in light gray between the extended levels or blue lines. Sometimes when the gap between these targets are huge, price cannot reach the targets and reverses at these intermediate targets. You can use them as targets or trailing stop loss based on your plan
DISPLAY HIDDEN LEVELS - These levels are intermediate supports and resistances that can be used whenever the present day indicated range is very wide. Whenever we have an explosive moments in market the range of that day is very huge and so he next day support and resistance band becomes very wide indicating the sideways movement day within that range. And on those days we can switch on the hidden levels and the price respects these levels and most of the days it is inside this range only.
DISPLAY PREVIOUS HIGH / LOW / CLOSE - I have included Daily / Weekly and monthly levels. It is important to know the earlier highs / lows and close since price respects it very must just like support and resistance .
PEMA - This is an important EMA based indicator which potentially indicates curves of support and resistance during retracements or pullbacks. If the curves are breached then the trend is reversed and the price will tend to move to the next pivots .
VALUE AREA - One of the most important feature of this Indicator is this which is derived from the Volume profile concepts. It indicates the fair value area Indicated by orange band and the upper and lower limits indicated by orange lines. Whenever the price is overvalued or undervalued, it is pushed back to its fair value and we can judge the present price position in relation to the value area and then take position in anticipation of the price reaching its fair value area. This must be coupled with price action for favorable results.
IMPORTANT NOTE : This indicator does not guarantee any favorable results nor protect your from any loss. You own the complete risk of your trades. It is suggested that you use this indicator and do back testing for considerable period to understand how it works the the potential win rate it can give.
If you have any doubts or need any clarifications of assistance in understanding, you can message me and I will try to help.
Happy and Safe trading - Mohan from PIVOT EDGE
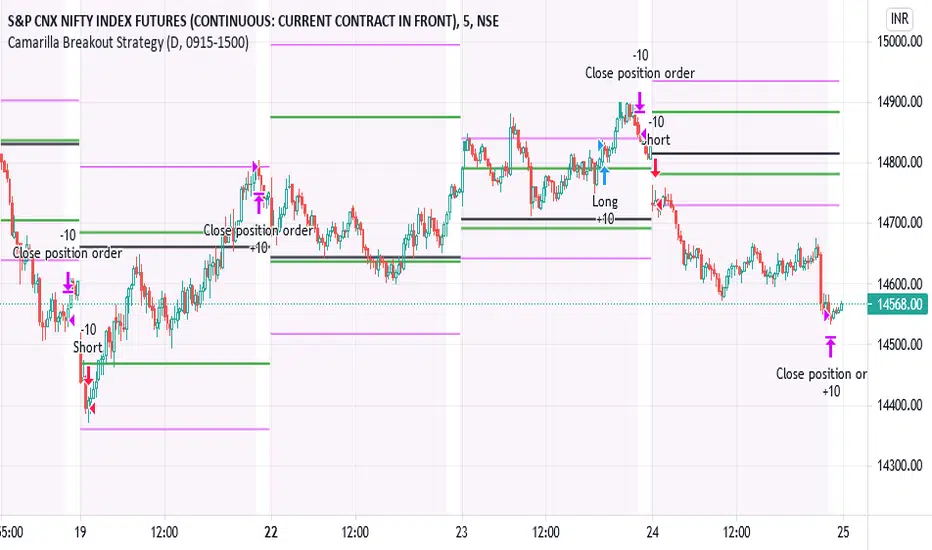
Camarilla TradingScenario 1
Open price is between H3 and L3
For Long
Wait for the price to go below L3 and then when it moves back above L3, buy. Stoploss will be when price moves below L4. Target1 - H1, Target2 - H2, Target3 - H3
For Short Sell
Wait for the price to go above H3 and then when the price moves back below H3, sell. Stoploss will be when price moves above H4. Target1 - L1, Target2 - L2, Target3- L3
Scenario 2
Open price is between H3 and H4
For Long
When price moves above H4, buy. Stoploss when price goes below H3. Target 1 - H5,
For Short Sell
When the price goes below H3, sell. Stopless when prices moves above H4. Target1 - L1, Target2 - L2, Target3- L3
Scenario 3
Open price is between L3 and L4
For Long
When price moves above L3, buy. Stoploss when price moves below L4. Target1 - H1, Target2 - H2, Target3 - H3
For Short Sell
When the price goes below L4, sell. Stoploss when price moves above L3. Target 1 - L5,
Scenario 4
Open price is outside the H4 and L4
Wait for the prices to come in range and trade accordingly.

Auto Pitchfork, Fib Retracement and Zig Zag by DGTPitchfork is a technical indicator for a quick and easy way for traders to identify possible levels of support and resistance of an asset's price. It is presents and based on the idea that the market is geometric and cyclical in nature
Developed by Alan Andrews, so sometimes called Andrews’ Pitchfork
It is created by placing three points at the end of previous trends
Schiff and Modified Pitchfork is a technical analysis tool derived from Andrews' Pitchfork
In general, traders will purchase the asset when the price falls near the support of either the center trendline or the lowest trendline. Conversely, they'll sell the asset when it approaches the resistance of either the center line or the highest trendline.
█ Study OPTIONS
Auto Pitchfork , the main aim of the study
Pivots threshold can be customized by “Deviation” and “Depth” input options
Pitchfork Type selection, available options Andrews' Pitchfork (Original), Schiff and Modified Pitchfork
Ability to set ALERTs for the Pitchfork Levels
Ability to add customized levels (all level lines customizable)
Auto Fib Retracement – This is the build-in study of TradingView, slight changes applied to fit with Auto Pitchfork
Zig Zag – Derived from build-in Auto Fib Retracement with some customization options.
█ Usage Tips :
Andrews' Pitchfork (Original) best fit in a Strong Trending Market
Schiff and Modified Pitchfork better with Correcting or Sideways Market. Modified Pitchfork is almost identical to a Parallel Chanel
Disclaimer :
Trading success is all about following your trading strategy and the indicators should fit within your trading strategy, and not to be traded upon solely
The script is for informational and educational purposes only. Use of the script does not constitute professional and/or financial advice. You alone have the sole responsibility of evaluating the script output and risks associated with the use of the script. In exchange for using the script, you agree not to hold dgtrd TradingView user liable for any possible claim for damages arising from any decision you make based on use of the script

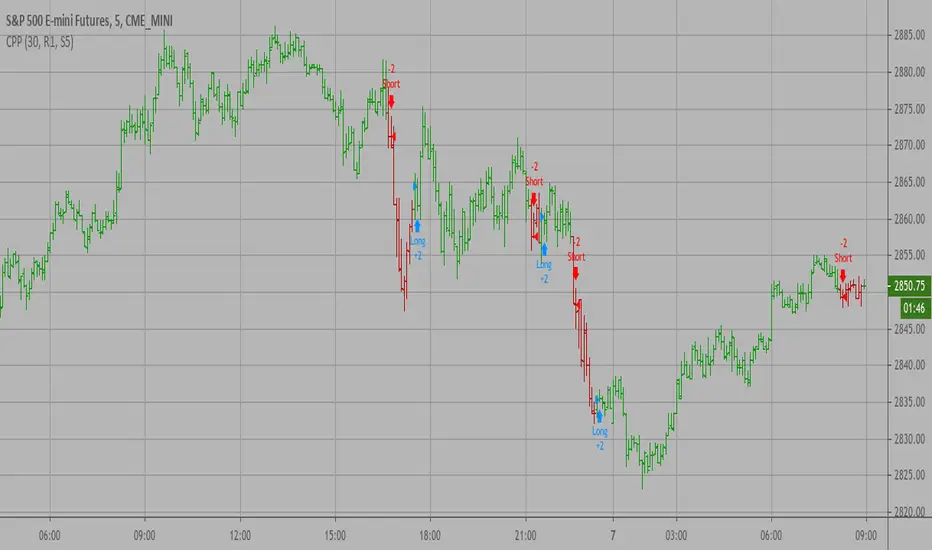
IPB_CamBOTSThis is an intraday strategy.
Camarilla Level 3 breakout strategy.
Conditions are long above Camarilla R3 only under certain circumstances related to the distance between Central Pivot and Level 3 pivots and also the location of the Opening price of the day.
Exit is assumed to be at the end of the day. It is suggested to exit the trade if price falls back below Camarilla R3 in case of longs.
Logic similar for shorts as well but on the other end.
Position Sizing :
10 lots of Nifty futures assumed for backtesting.
The margin required for 10 lots of Nifty futures is around 10-12 lacs. Hence 25,00,000 capital is assumed which is roughly double the margin required for taking positions in the real market. In other words not all capital is used if 10 lots of futures is traded. Brokerage assumed is 50 per order as against the 20 per order in real market with respect to retail brokers. Currency assumed is INR. However there is no option to choose INR and therefore you might see the currency as USD. Hence please assume the currency as INR.
Disclaimer:
Past performance does not reflect the future perfomance. Hence the author is not responsible for any trading loss arising out of this strategy. Please use at your own risk and responsibility.
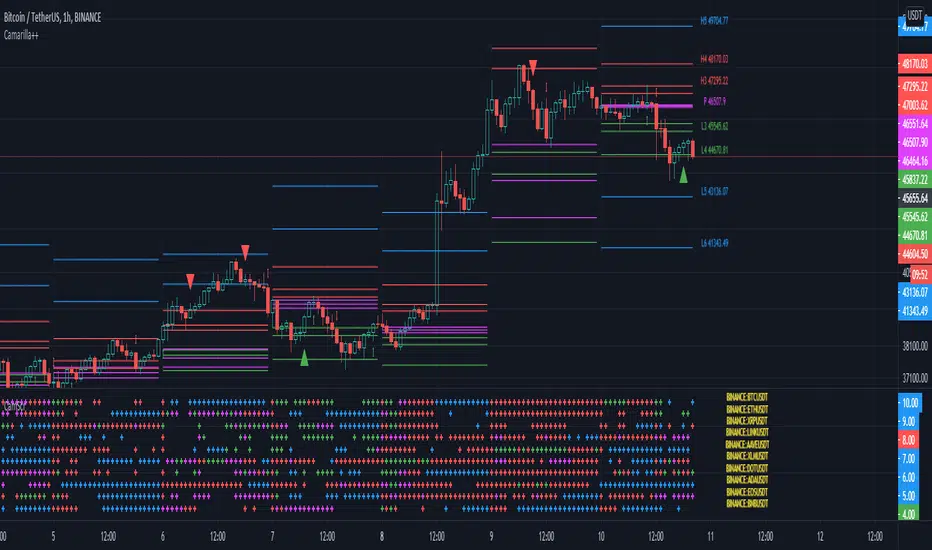
Camarilla screenerBasic script to screen up to 10 tickers with regards to their central pivot range and camarilla pivots.
Same color layout as the Danarilla script ().
The colors in the screener mean the following:
Blue : bar close price is > H4 or < L4
Red : bar close price is < H3 and > CPR top
Fuchsia : bar close price is < CPR top and > CPR bottom
Green : bar close price is < CPR bottom and > L3
No color means it is between H4/H3 or L3/L4
Resolution can be changed for the calculation of the pivots.
Script contains snippets from other screeners and the Danarilla script so many thanks to all who publish their scripts.
PIVOT EDGE - The complete trading setup - LITEIntroduction to the Indicator " PIVOT EDGE - The complete trading setup - LITE "
The Foundation layout for this indicator is based on PIVOT's which are nothing but the most important levels that the price has respected in the past.The values for the pivots are derived from the key attributes of the price in any timeframe such as the OPEN, HIGH, LOW and CLOSE. These define the mood of the price and where it intends to move in relation to the previous range formed.Earlier HIGH - LOW i.e the RANGE indicates the possible movement that a stock can make in the current session and as per the calculated pivots we can possible find out the tentative supports and resistances. In addition to this indicator, It is advisable to use the price action theory which helps in taking a right decision for entries.
This indicator by itself is complete in nature, i.e it guides the user for possible entry levels and the projected targets that we can achieve and also the likely stop loss limit in case the price reverses. So beforehand even before entering into a trade position, the user can ascertain what can be his loss or max profit and then he can chose an optimum position size for favorable results.
The beauty of this Indicator lies in the fact that it can be used for all types of trading like Scalping, Intra day, Swing or Positional and Investments also. It works on all timeframes and across all market segments like EQUITY, COMMODITIES, FUTURES , OPTIONS , FOREX etc.
This indicator can be used for any exchange and any timezone also without any changes or adjustments needed.
Now let us understand the features of this Indicator in detail.
TIMEFRAME - It has options to choose between Day,week and month as timeframe. By default it is set to Day timeframe
DISPLAY MAJOR LEVELS - These are the important support and resistance levels calculated based on the past price data. Most important ones are marked in BOLD RED and BOLD GREEN between which the price tends to move generally.
Apart from these, We have breakout level marked in light green and if price breaks this level we can expect targets upto extended levels and beyond marked in blue.
we also have breakdown level marked in light red and if price breaks this level we can expect targets down up to extended levels and below it marked in blue.
In addition I have coded intermediate target levels that appear in light gray between the extended levels or blue lines. Sometimes when the gap between these targets are huge, price cannot reach the targets and reverses at these intermediate targets. You can use them as targets or trailing stoploss based on your plan
DISPLAY HIDDEN LEVELS - These levels are intermediate supports and resistances that can be used whenever the present day indicated range is very wide. Whenever we have an explosive moments in market the range of that day is very huge and so he next day support and resistance band becomes very wide indicating the sideways movement day within that range. And on those days we can switch on the hidden levels and the price respects these levels and most of the days it is inside this range only.
DISPLAY PREVIOUS HIGH / LOW / CLOSE - I have included Daily / Weekly and monthly levels. It is important to know the earlier highs / lows and close since price respects it very must just like support and resistance.
PEMA - This is an important EMA based indicator which potentially indicates curves of support and resistance during retracements or pullbacks. If the curves are breached then the trend is reversed and the price will tend to move to the next pivots.
VALUE AREA - One of the most important feature of this Indicator is this which is derived from the Volume profile concepts. It indicates the fair value area Indicated by orange band and the upper and lower limits indicated by orange lines. Whenever the price is overvalued or undervalued, it is pushed back to its fair value and we can judge the present price position in relation to the value area and then take position in anticipation of the price reaching its fair value area. This must be coupled with price action for favorable results.
IMPORTANT NOTE : This indicator does not guarantee any favorable results nor protect your from any loss. You own the complete risk of your trades. It is suggested that you use this indicator and do back testing for considerable period to understand how it works the the potential win rate it can give.
If you have any doubts or need any clarifications of assistance in understanding, you can message me and i will try to help.
I will soon try to make a Video and explain the use of this indicator for better clarity and understanding.
Happy and Safe trading - Mohan from PIVOT EDGE

The Ultimate Frank Ochoa Trading Setup by YesuThis trading set up will show the Frank Ochoa's 4 reversal candles with the 'RSI and volume filters' along with the necessary pivots. You will be able to select the RSI and volume filters individually for all the 4 setups. It will also show the colored RSI candle when the RSI conditions met. You can also set the Initial Balance based on your preference. Lot more features that you can explore. A must have for pivot traders. This is the trading set up which I am using from the past 15 months

Camarilla Scanner v1The script is based on Camarilla pivots for trend analysis of stock in intraday.
It will scan the selected stocks chosen in input settings displays the current status of where they are with respect to Camarilla pivots.
The day's history will show only those closed above R4/below S4.

Ultimate Pivot PointsLately, there are a plethora of Pivot scripts on TV, I'll be adding one more :3
This is a combination that I use for my personal use so I've coded accordingly. Its the best combination of the regular pivot, woodie pivot, fib, and cams, in my humble opinion. Also added previous day high and low as those are the key levels for intraday traders.
Also, this is a multi-timeframe version.
Enjoy~

D, W, M_CPR + Camarilla + Value Area _ By SoumyaAll in one pivot points of combined D, W, M CPR, Camarilla & Value area. Inspired by Pivotboss book.

Camarilla Pivot Points V2 Backtest Camarilla pivot point formula is the refined form of existing classic pivot point formula.
The Camarilla method was developed by Nick Stott who was a very successful bond trader.
What makes it better is the use of Fibonacci numbers in calculation of levels.
Camarilla equations are used to calculate intraday support and resistance levels using
the previous days volatility spread. Camarilla equations take previous day’s high, low and
close as input and generates 8 levels of intraday support and resistance based on pivot points.
There are 4 levels above pivot point and 4 levels below pivot points. The most important levels
are L3 L4 and H3 H4. H3 and L3 are the levels to go against the trend with stop loss around H4 or L4 .
While L4 and H4 are considered as breakout levels when these levels are breached its time to
trade with the trend.
WARNING:
- For purpose educate only
- This script to change bars colors.

Camarilla Pivot Points V2 Strategy Camarilla pivot point formula is the refined form of existing classic pivot point formula.
The Camarilla method was developed by Nick Stott who was a very successful bond trader.
What makes it better is the use of Fibonacci numbers in calculation of levels.
Camarilla equations are used to calculate intraday support and resistance levels using
the previous days volatility spread. Camarilla equations take previous day’s high, low and
close as input and generates 8 levels of intraday support and resistance based on pivot points.
There are 4 levels above pivot point and 4 levels below pivot points. The most important levels
are L3 L4 and H3 H4. H3 and L3 are the levels to go against the trend with stop loss around H4 or L4 .
While L4 and H4 are considered as breakout levels when these levels are breached its time to
trade with the trend.
WARNING:
- For purpose educate only
- This script to change bars colors.
[Daveatt] BEST Trade Manager Pivots 1.0Hello BEST traders
The BEST Trade Manager got upgraded with many more features
This version allows setting automatically the TP levels on either Fibonacci/Traditional/Camarilla/Woodie pivots
I. 💎 SCRIPTS ACCESS 💎
1. Available only with one-time payment on my website.
2. My website URL is in this script signature at the very bottom (you'll have to scroll down a bit and going past the long description) and in my profile status available here: Daveatt
3. Many video tutorials explaining clearly how all our indicators work are available on your website > guides section.
4. You may also contact me directly for more information
II. 🔎 What is the BEST Trade Manager?🔎
2.1 Concept
The BEST Trade Manager is compatible with any indicator.
Once connected, it adds another layer of good stuff with real-time user custom defined stop loss (8 available options), take profits (4 possible options) + alerts compatible for trading automation.
2.2 How hard is it to update your indicator?
We'll send to our customers, a comprehensive and easy tutorial, to make any indicator compatible.
I guarantee you, it should take no more than 2 minutes per indicator. We made it easy, fun, and awesome. #bolder #statement
III. The amazing benefits of our Plug&Play system
I hope you're ready to be impressed. Because, what I'm about to introduce, is my best-seller feature - and available across many of my indicators.
The BEST Trade manager can be connected to any external indicator
Let's assume you want to connect your RSI divergence to your Trade Manager.
I mentioned an RSI divergence but you may connect any oscillator ( MACD, On balance volume, stochastic RSI, True Strenght index, and many more..) or non-oscillator (divergence, trendline break, higher highs/lower lows, candlesticks pattern, price action, harmonic patterns, ...) indicators.
THE SKY IS (or more likely your imagination) is the limit :)
We go in-depth on our website why the Plug&Play is an untapped opportunity for many traders out there - URL available on my profile status and signature
IV. 🧰 Features 🧰
Candles can be colored to highlight the trend direction better [/b [
4.1 Stop-Loss Management
For what's following, let's assume that 2 is the stop-loss value you inserted in the indicator, and the Algorithm Builder gives a BUY signal.
This is NOT a recommendation at all, only an example to explain how this feature works.
- %Trailing: The Stop-Loss starts 2% away from the entry price - and will move up (because we're on a BUY trade as per our example) every time your trade will gain 2% profit
- Pips Trailing: Same as above but using a distance in pips/USD value
- Percentage: The Stop-Loss stays static 2% away from the entry price. There is no trailing here
- TP Trailing: Trail your stop-loss every time a Take Profit level is hit
- Supertrend: embedded supertrend use as a trailing stop
- Fixed: Set the Stop-Loss at a fixed position (value should be in currency/units)
- ATR multiple: Set the Stop-loss at a multiple of ATR
- External connector: Let's say your indicator already contains embedded stop-loss levels, you can add them in the Trade Manager
4.2 Take Profits Management
You can manage up to 3 take profit levels defined as a percentage or price value or ATR multiple.
The expected input is in percentage value (for instance, setting the % target of TP1 to 2% will set the TP1 level 2% away from the entry price
This version allows setting automatically the TP levels on either Fibonacci/Traditional/Camarilla/Woodie pivots
4.3 Built-in Risk-to-Reward Panel with real-time analytics
The good stuff doesn't stop here.
You'll notice that this sometimes green (when in a LONG), sometimes red (when in a SHORT) panel at the right of your chart.
- Entry Price: the price when the Algorithm Builder will give a signal.
- The Trade PnL in percentage.
- Entry Stop Loss: Distance (in currency/units) between the selected stop-loss algorithm (percent, trailing, TP trailing, etc.) and the entry price.
- Entry TP1/TP2/TP3: Distance (in currency/units) between the entry price and the first take profit
- Risk/Reward TP1/TP2/TP3: Using the Stop-loss distance at entry, and Take Profit 1/2/3 at the entry to compute the risk-to-reward ratio.
- Max drawdown and Max opportunity (value and percentage): respectively the maximum loss and maximum win per trade
For more details, please check the guides section of my website. Links are in my signature and profile status.
V. 🔔 Alerts 🔔
We enabled the alerts on the:
1. Stop-Loss hit
2. Take Profit 1/2/3 hit
3. custom hard exits based on either MACD / RSI divergence/ MM cross
5.1 🤖 Compatible with trading bots? 🤖
It's compatible with all third-parties out there capturing alerts and forwarding them to the brokers.
We enabled TradingConnector and ProfitView alert templates so far.
If you have any doubts or questions, please hit me up directly or ask in the comments section of this script.
BEST regards,
Dave

Camarilla Pivot Points V2 Camarilla pivot point formula is the refined form of existing classic pivot point formula.
The Camarilla method was developed by Nick Stott who was a very successful bond trader.
What makes it better is the use of Fibonacci numbers in calculation of levels.
Camarilla equations are used to calculate intraday support and resistance levels using
the previous days volatility spread. Camarilla equations take previous day’s high, low and
close as input and generates 8 levels of intraday support and resistance based on pivot points.
There are 4 levels above pivot point and 4 levels below pivot points. The most important levels
are L3 L4 and H3 H4. H3 and L3 are the levels to go against the trend with stop loss around H4 or L4 .
While L4 and H4 are considered as breakout levels when these levels are breached its time to
trade with the trend.
WARNING:
- For purpose educate only

Camarilla Pivot Points Backtest Pivot point studies highlight prices considered to be a likely turning point
when looking at values from a previous period, whether it be daily, weekly,
quarterly or annual. Each pivot point study has its own characteristics on
how these points are calculated.
Red color = Sell
Green color = Buy
WARNING:
- For purpose educate only
- This script to change bars colors.
Camarilla Pivot Points Strategy Pivot point studies highlight prices considered to be a likely turning point
when looking at values from a previous period, whether it be daily, weekly,
quarterly or annual. Each pivot point study has its own characteristics on
how these points are calculated.
Red color = Sell
Green color = Buy
WARNING:
- For purpose educate only
- This script to change bars colors.

Camarilla Pivot Points V1 Pivot point studies highlight prices considered to be a likely turning point
when looking at values from a previous period, whether it be daily, weekly,
quarterly or annual. Each pivot point study has its own characteristics on
how these points are calculated.
WARNING:
- For purpose educate only
VPTbollfib & Camarilla (Danarilla)I do not own the original indicators. This is just a combination of the two because of their nature to work in a similar way.
Camarilla Pivots run on the basis of intraday range trading. Usually after daily open you look the fade whatever move happened before. by shorting R3/H3 levels or longing R3/L3. Targeting the other side of the range. This is the infamous PivotBoss level calculations and you would want to activate camarilla and turn off the normal pivots. They use the previous days volatility to plot the next days levels.
But what about some confirmation?
Well RafaelIzoni (who made it open source for improvement) threw together this VPTbollfib. It is volume price trend crossing down a fib line using bollinger bands as price envelope. The beauty of this is that It will signal usually counter to current price action based on selling into uptrends or vise versa. Meaning you get signals to counter price. Which is what you might be looking for on range day trade scalps for camarilla. A wick reversal or engulfing + volume based signal is a very happy pairing together. And those signals are usually suitable for the target of the range you are day trading. Hourly time frame works quite well for both. And camarilla should also be on daily settings.
Special Thanks to Nanda (who published the pivotboss indicator AND) Helped to merge the scripts together.
This indicator alone is an entire trade system. Camarilla already is. If you know the rules. it can be used for entries, exits, risk management to trade the range on TREND, COUNTER TREND, and BREAKOUT plays. The bollinger band fibs add confirmation to the trends levels. And the VPT adds a secondary confirmation to take a camarilla trade.
Try it out. I think you will find both the levels on camarilla and the VPT signals quite suprising.

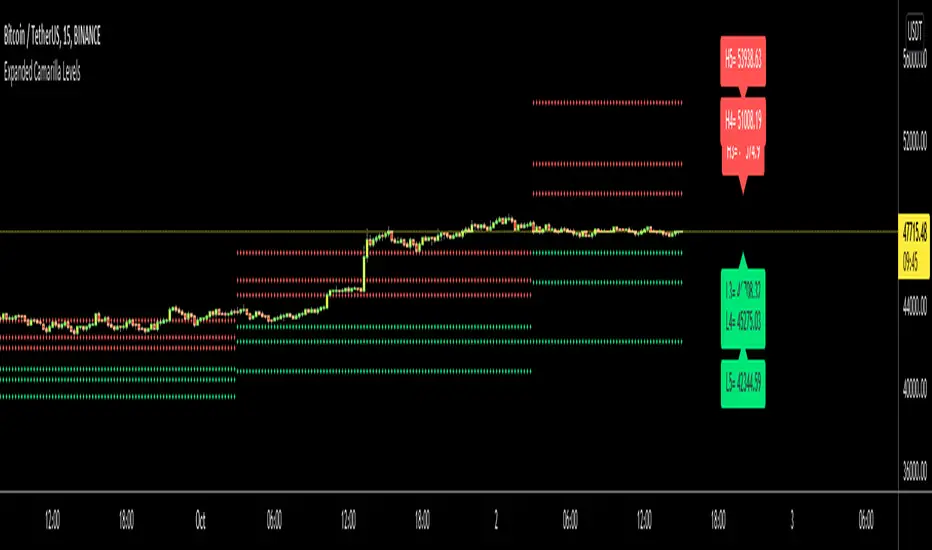
Expanded Camarilla LevelsHello Everyone,
The Expanded Camarilla Level s is introduced in the book " Secrets of a Pivot Boss: Revealing Proven Methods for Profiting in the Market " by Franklin Ocho a. I will not write a lot about the book, you should read it for yourself. There are many great ideas in the book, such using these levels, following trend, time price opportunity, Advanced Camarilla Concepts and much more.
The definition/formula of the levels defined in the book. ( actualy L1, L2, H1 and H2 levels are not used in the strategy, so not shown on the chart )
RANGE = highhtf - lowhtf
H5 = (HIGH/ LOW) * CLOSE
H4 = CLOSE + RANGE * 1.1/2
H3 = CLOSE+ RANGE * 1.1/4
H2 = CLOSE+ RANGE * 1.1/6
H1 = CLOSE+ RANGE * 1.1/12
L1 = CLOSE- RANGE * 1.1/12
L2 = CLOSE- RANGE * 1.1/6
L3 = CLOSE- RANGE * 1.1/4
L4 = CLOSE- RANGE * 1.1/2
L5 = CLOSE- (H5 - CLOSE)
Levels:
Strategy: you need to take care of the candles, as you can see there is bearish candle on first part, and Bullish Candle on second part!
Another Strategy:
An Example:
ENJOY!
Expanded Floor PivotsExpanded Floor Pivots idea derives from the book "Secret of Pivot Boss by Frank Ochoa."
Its a combination of Central Pivot Range(CPR) & Camarilla Pivots.
This Indicator specially built for Intraday Trading with all support & resistance, also with advance view of Tomorrow Pivots(CPR+Camarilla).
(User Modification Accessible, Stay Connected-Follow & Post Comment-feedback)

PivotBoss Pivots & Camarilla - H,D,W, M timeframe & OHLC LabelsThis is the new pivotboss pivots calculations and also has Camarilla Pivots . User can define which time frame pivots they want to see starting from Hourly, Daily, weekly and monthly. Added labels for each levels. So that user can calculate potential profit targets. This script also includes Hourly and Daily OHLC with labels. Added Developing mid point of the current day. The script can calculate midpoint as and when new highs and lows are made through out the day
Abbrevations used in this script
yHI - Yesterday's session High
dOP - Days open
yCL - yesterday's session Close
yLO - yesterday's session Low
MP -- Developing midpoint of the day
TC - Top channel
P - Pivot Point
BC - Bottom Channel
R1 - R4 -- Resistance levels
S1 - S4 -- Support Levels

