Outside Reversal CandleA lot of people get freaked out by outside reversal Days in the market like what we had yesterday.
"I think a great learning tool would be an indicator that highlights on the chart any outside reversal bar"
Rules:
both the high and the low is higher than the previous day
the low of the day is in the bottom 1/3 of the price range
the volume is higher than the bar immediately before it
With indicator every Outside Reversal candle body and background is highlighted,
People can now easily go back in time and see what happened after and make adjustments to their strategies.
Candlestickpattern

BB and Engulfing Candle PatternHey this is my second script. This a combination of Bollinger Bands and detection of Engulfing Candles. This study also filters out and displays Bull, Bear, and False signals, using the long term 200 EMA Trend. Let me know what you think!

Moving Average of Upper and Lower Wicks with optional smoothingIn the book, The New Technical Trader by Tushar Chande and Stanley Kroll there is a part that talks about candlestick analysis and how the wicks play a role on how the price will behave. When wick lengths increase then there could be uncertainty. Weakening of support and resistance levels can also be seen by the size of the candlestick wicks or shadows. Shoutouts to Mango2Juice from Tradingview and the The Academy of Forex for helping me out in making this and providing the moving averages function.
When combined with other indicators or strategies, I find that this increases their accuracy when used correctly. For those that believe in price action, this might be worth a try. The book has only a brief section on candlestick wicks but it is one of the most interesting ideas I found. The book likes to include a simple moving average in its indicators with a certain length to provide a smoothing type of effect or a sort of extra indicator for the other to be above to give off quicker signals at the cost of accuracy. For this indicator it acts as a smoothing type effect which I put in because it is hard to see the slope and direction of where the moving averages of the wicks are going. The type of moving averages to use and the correct lengths are questionable and are not explained well in the book. If anyone can figure out a good use for this or know better settings or tips, please let me know.

L2 Candle Pattern ScalperLevel: 2
Background
Japanese candlesticks provide more detailed and accurate information about price movements compared to bar charts. They provide a graphical representation of the supply and demand behind the price promotions for each period. Each candlestick contains a central part that indicates the distance between the opening and closing of the security being traded, the area called the body.
Scalping is a trading strategy that aims to take advantage of minor changes in the stock price. Traders using this strategy place anywhere from 10 to a few hundred trades in a single day with the belief that small moves in the stock price are easier to catch than large ones. Traders who implement this strategy are known as scalpers. Lots of small wins can easily lead to big wins if a strict exit strategy is used to prevent big losses.
Function
L2 Candle Pattern Scalper utilizes candle pattern to decide long and short entry signal. It use inherent candles' relationship nearby to judge the market trend is up or down and decide to long or short.
Signal
buysmall --> long entry
exitred --> short entry
Pros and Cons
Pros:
1. its response is fast because OHLC candle is the raw source of market
2. it is suitable for scalping because it studies nearby candles to judge very short term trend change
Cons:
1. Mid-long term change is missing from this indicator, although I use fast and slow lines to indicate the mid-term trend.
2. No stop loss or take profit scheme is introduced.
Remarks
This is promising but need efforts to refine it.
Readme
In real life, I am a prolific inventor. I have successfully applied for more than 60 international and regional patents in the past 12 years. But in the past two years or so, I have tried to transfer my creativity to the development of trading strategies. Tradingview is the ideal platform for me. I am selecting and contributing some of the hundreds of scripts to publish in Tradingview community. Welcome everyone to interact with me to discuss these interesting pine scripts.
The scripts posted are categorized into 5 levels according to my efforts or manhours put into these works.
Level 1 : interesting script snippets or distinctive improvement from classic indicators or strategy. Level 1 scripts can usually appear in more complex indicators as a function module or element.
Level 2 : composite indicator/strategy. By selecting or combining several independent or dependent functions or sub indicators in proper way, the composite script exhibits a resonance phenomenon which can filter out noise or fake trading signal to enhance trading confidence level.
Level 3 : comprehensive indicator/strategy. They are simple trading systems based on my strategies. They are commonly containing several or all of entry signal, close signal, stop loss, take profit, re-entry, risk management, and position sizing techniques. Even some interesting fundamental and mass psychological aspects are incorporated.
Level 4 : script snippets or functions that do not disclose source code. Interesting element that can reveal market laws and work as raw material for indicators and strategies. If you find Level 1~2 scripts are helpful, Level 4 is a private version that took me far more efforts to develop.
Level 5 : indicator/strategy that do not disclose source code. private version of Level 3 script with my accumulated script processing skills or a large number of custom functions. I had a private function library built in past two years. Level 5 scripts use many of them to achieve private trading strategy.

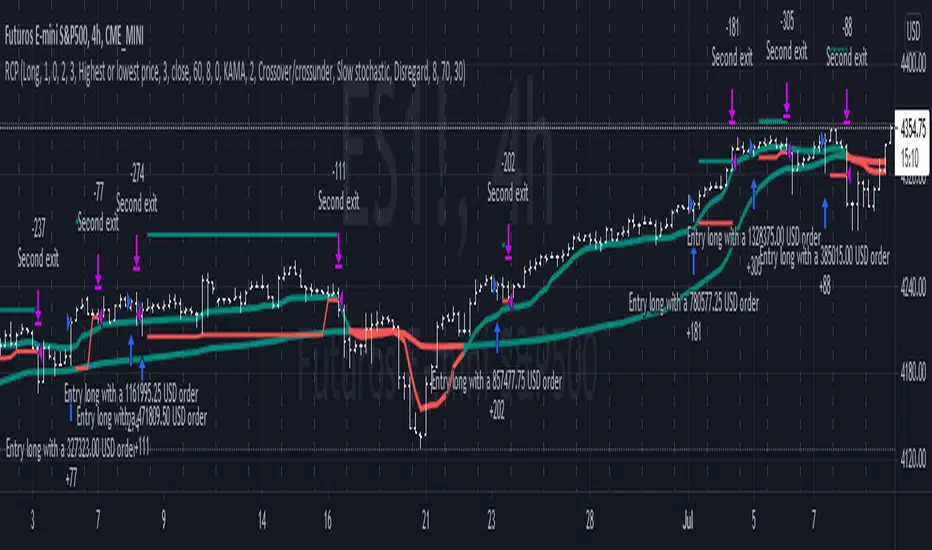
Reversal closing priceThe reversal closing price (RCP) is a candlestick pattern which follows two simples rules:
the low price of current candle needs to be lower than the low price of the last 2 candles
the closing price of current candle needes to be higher than the closing price of the last candle
This generates a signal for a long position. For a short position, the conditions are inverted:
the high price of current candle needs to be higher than the high price of the last 2 candles
the closing price of current candle needes to be lower than the closing price of the last candle
Since RCP is a trend follower indicator, the strategy is programmed in such a way that long positions are only placed if the short period EMA is above the long period EMA, and short positions are only placed if the short EMA is bellow the long EMA. Both periods are configurable, and should be ajusted for each asset.
This strategy uses a fixed stop loss and take profit, and the it's ratio is configurable. The stop price is one tick lower than the lowest price of X candles prior to the order execution for long positions, while in short positions it's one tick higher than the higher price. The amount of candles to lookback (X) is configurable. Both stop and take profit prices are displayed, the first as a red line, and the second as a green line.
This is the setting that I've found to work best with TVC:SPX , but you may find a better setting. While the RCP is universal, it's placement depends on the trend and it's strenght, something that is very heterogeneous among assets.
I really wish that I was able to place images, but I don't have PRO, so text will have to do.
This strategy was designed by Alexandre Wolwacz, a.k.a. Stormer.
Swing Highs/Lows & Candle Patterns [LuxAlgo]This script labels swing highs and swing lows as well as the candle pattern that occurred at that precise point. The script can detect the following 6 candle patterns: hammer, inverse hammer, bullish engulfing, hanging man, shooting star, and bearish engulfing.
This indicator by its very nature backpaints by default, meaning that the displayed components are offset in the past.
🔶 USAGE
It can be interesting to see if a top or bottom is associated with a specific candle pattern, this allows us to study the potential of such a pattern to indicate a reversal. You can hover on a label with a specific pattern to see more details about it.
The notations HH, HL, LH, and LL you can see on the labels are defined as follows:
HH : Higher high
HL : Higher low
LH : Lower high
LL : Lower low
🔶 SETTING
Length: Sensitivity of the swing high/low detection, with lower values returning the maximum/minimum of shorter-term price variations.

Cumulative Delta VolumeHello Traders,
This is Cumulative Delta Volume script. Delta refers to the difference between buying and selling volume at each price level. Cumulative Delta builds upon this concept by recording a cumulative tally of these differences in buying vs selling volume. The Cumulative Delta indicator plots as candlesticks or line. One of the main uses of Cumulative Delta is to confirm or deny market trends. you may need to search it for yourself ;)
You have option to see it as Candles or a Line. also there are options to show 2 SMAs and 2 EMAs with different Lengths, you can set the lengths as you wish.
By default it shows CDV as Heikin Ashi Candles, it can also show it as normal candles:
It can show CDV as a line:
Also you may need to check divergence:
Enjoy!

HTF Candle CloseThis draws a label to alert user when a higher timeframe candle closes on a intraday chart.
Purpose of it is so that people who mainly use lower timeframe charts do not forget to look at higher timeframe candle closes.

Candle checker for long/short for scalping/day tradingHey.
This strategy is still in working.
For it I check a x amount of candles in the past if they been for example all red/green in row, and based on that I enter. For example candle 7 < candle 6 .... candle 3 < candle 2 .... candle 1 < candle current for long and viceversa for short.
After that,once the trade is initiated, I exit based on 2 possibilities : candle color is different than the color of candle when entry, or based tp/sl.
Let me know what you think of it.
I will try to make the process to calculate automatically and input the number of candles to check like 5-10-15 and so on.

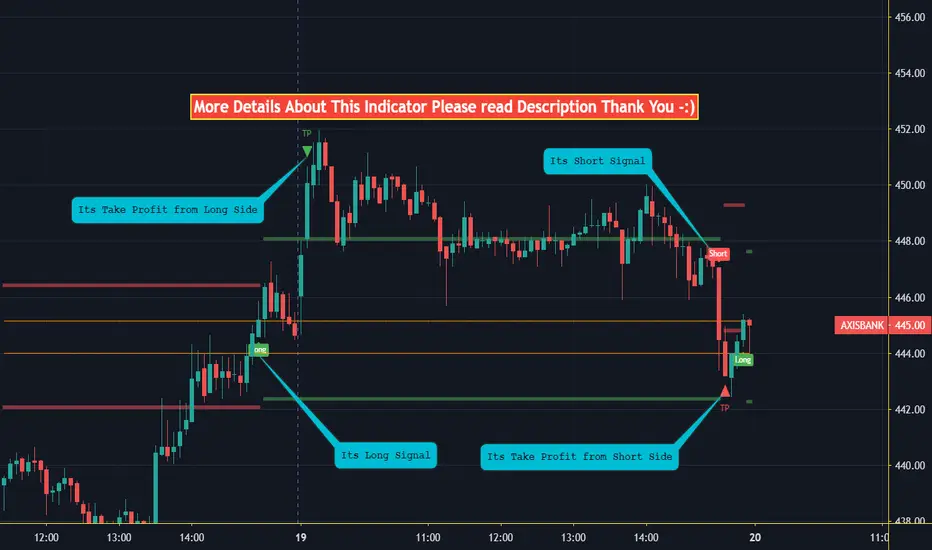
Candle Condition BreakoutHello Everyone
Its indicator Basically base on Candle (Bar)
How to working its indicator?
Condition: if Close equal Low and next bar Open equal Low when plot Bar High and Low line if bar high line Breakout when Long Signal and if Bar Low line Breakout When Short Signal
Indicator Feature
➤ Long Side Signal With Alerts
➤ Short Side Signal With Alerts
➤ Long side Take profit Calculated By Bar High You Can Also Change Calculating Bar Source
➤ Short side Take profit Calculated By Bar High You Can Also Change Calculating Bar Source
➤ Long side Stop Loss Calculated By Bar Open You Can Also Change Calculating Bar Source
➤ Short side Stop Loss Calculated By Bar Open You Can Also Change Calculating Bar Source
➤ You Can Also Target Long TP and SL with One Alert
➤ You Can Also Target Short TP and SL with One Alert
Important: This Indicator we are using for Automation Trading if You Want This Indicator Access Please Contact me PM on Tradingview
PB Candlestick PatternsUsing PB Candlestick Patterns, you can automatically identify 1 and 2 candlesticks patterns to help determine the current trend
The signals appear in Red and Green to denote for bearish (Red) bullish (Green).
This indicator automatically displays the following patterns on the chart.
Harami
Harami Cross
Morning Star
Engulfing
Hammer
Gravestone
Piercing Line
This is different to the existing open source indicator available on the marketplace for the following reasons:
* Identify's and displays more candlestick patterns
* Automatically displays only a specific set of candlestick patterns relevant to our Elliott Wave Indicator Strategy
* Labels reveal the whole name, not an abbreviation
This will be available soon to lease from us.
This indicator is to be used in conjunction with our Elliott Wave Indicator but to know more information about this indicator or when it will be available to lease, send us a DM

Magic CandleThis indicator is very simple, but surprisingly effective, and I haven't found any mention of something similar, so here it is. I hope it helps you in your stock trading.
Someone made a comment in a trading room that the 8 am candle of the stock looked odd, so I quickly checked all the other stocks I had on my screen, and for all of them, the 8 am candle was just a little strange. What's more, is that the stock would often respond to the high and low values of that 8 am candle later on in the day. It turned out to be quite an important support and resistance level indicator for stocks which I've used in my trading ever since I discovered it.
After testing it out day after day on multiple stocks, I decided to write this indicator, which not only projects the high and low values of the 8 am candle, but also the previous day's closing price.
If you find that there's another "magic candle" out there for Forex or Crypto, please let me know!
You have the option to set the "magic candle" to another time, if you want to experiment with things.

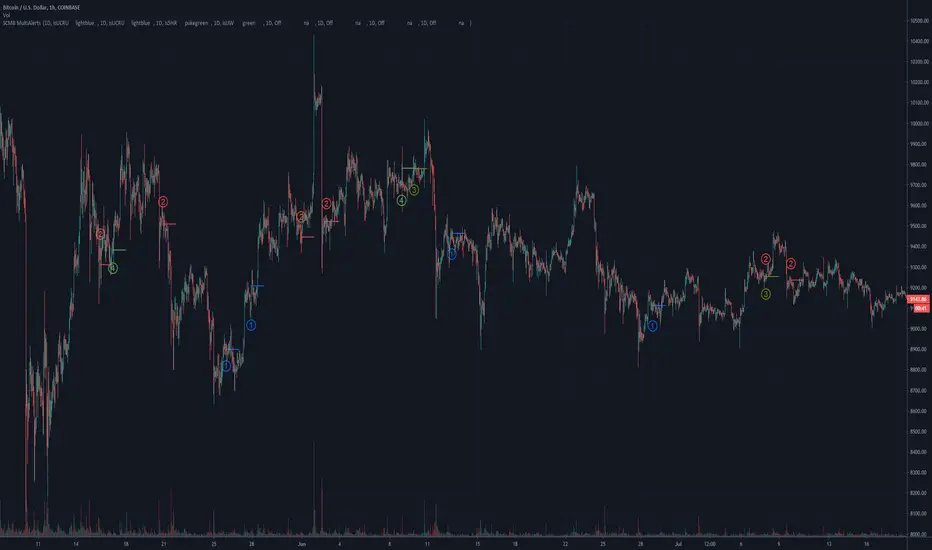
SCMB MultiAlerts - Candle Structure Alert ScriptSCMB Multialerts is a tool for candle structure alert automation.
The input screen allows you to input the timeframe, choose candle structure condition, toggle inverse condition, and toggle Heiken-Ashi for that candle structure trigger condition.
Input the timeframe with the # first and use H - Hour, D - Day, W - Week, and M - Month after the number; example - "1H" - "3D" - "4H" - "1W"
There are 8 total alert conditions that are programmable. You may use any combination of timeframes, inverse/HA, and candle-structure unique to each trigger available at the same time.
When you have set the conditions you want for alerts with the input settings, the color and the position of on-screen alerts is automatically populated.
You can then visually back-test to make sure these settings are desirable
Customize the colors individually, or choose to use "Color0" for all alert conditions by default by "user colors" toggle at the bottom of settings window, then you only need to change "Color0" for each alert condition.
Use the "Indicator Templates" to save your configuration, save several presets with settings for different situations, you can link the settings to a particular symbol as well.
Finally, use the "add alert" feature within tradingview to select the SCMB alert conditions as triggers. TV will deploy alerts with your customized message when each condition is met.
Some notes and known bugs:
Timeframe input requires capital letters for H,D,W,M.
Selecting "Close" Open" or "HL/2" from the drop down will do nothing at the moment. Future release plans to make use of these options.
If there is a feature you would like, question answered, or a bug to report, visit the TradingView SNOW_CITY public chat-room; link in my signature
Use the pastebin link below for indicator access information
Bullish Piercing ScannerA piercing pattern is known in technical analysis to be a potential signal for a bullish reversal. The formation in its strictest form is rather rare, but tends to perform better the longer the downtrend in front of it. When technical studies such as RSI, Stochastic or MACD are showing a bullish divergence at the same time a piercing pattern appears, it strengthens the likelihood that this two-day pattern is meaningful.
This is a two-candle pattern. The previous candle must be bearish, the recent candle must open below the close of the previous candle, the recent candle must close above the middle of the previous candle. You can adjust the closing and opening gap between the two candles within this scanner's settings (price).

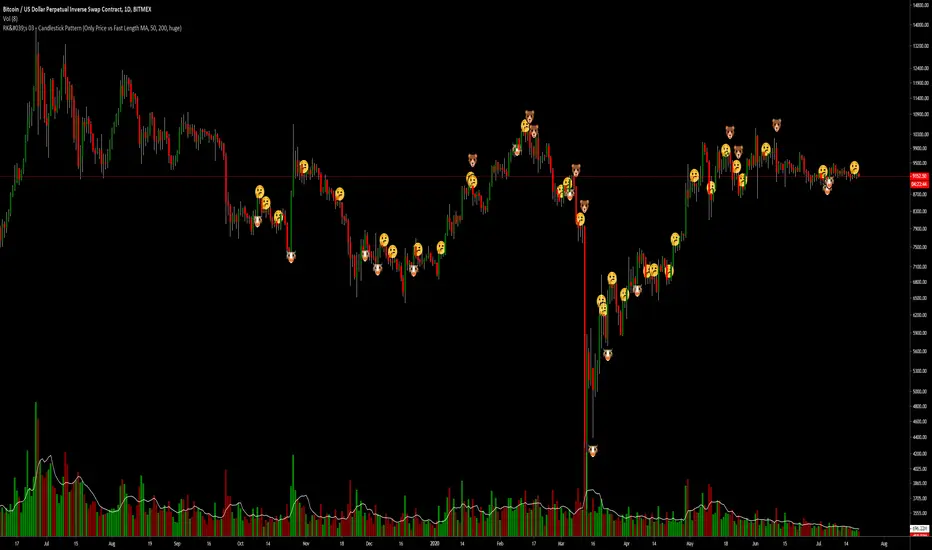
RK's 03 - Candlestick PatternThis code is just a combination of all TradingView's Candlestick Pattern.
I mix all the TV Candlestick Patterns Indicator from the TradingView in Indicator.
Candlestick Patterns by Dipak V2I am really excited to publish my work, I know its at the beginning but there is a lot to come in the future. I am writing a script to identify the candlestick patterns. In this version, I have added Hammer and Hanging Man Pattern in the first version, I know its less but its a beginning, I will keep adding the new information in my script in upcoming versions.
This script is for only learning purpose and not for treading realtime. In this script, it only identifies the pattern and does not check for its confirmation or does not provide any stop-loss, Also it does not check the prior trend before the pattern. These things really matter in the live trade. But in future, I am planning to add these things.
If you like my work, please like or comment your ideas I will try to include those in upcoming versions.
Hanging Man:
Hanging man is a bearish reversal candlestick pattern that signals about the uptrend or advancing phase are over and bulls have lost their control. Color of the candle is not important.
Identity:
1) Comes after a significant up rally or uptrend or advancing phase.
2) Small real body at the top.
3) Long lower shadow at least twice the real body.
4) Very small or no upper shadow.
Confirmation:
Immediate next candle’s close should be below the hanging man’s real body.
StopLoss:
There is a potential resistance level above the top of the hanging man. Stoploss should be above the resistance area or at the high of the hanging man.
Hammer:
Hammer is a bullish reversal candlestick pattern that signals about the downtrend or declining phase are over and bears have lost their control. Color of the candle is not important.
Identity:
1) Comes after significant down rally or downtrend or declining phase.
2) Small real body at the top.
3) Long lower shadow at least twice the real body.
4) Very small or no upper shadow.
Confirmation:
Immediate next candle’s close should be above the hammer’s low.
StopLoss:
There is a potential support level below the low of the hammer. Stoploss should be below the support area or at the low of the hammer.
Note: The candle is the same for Hanging Man and Hammer , Difference is where they appear in the uptrend or in the downtrend that makes the real difference.

Candlestick Pattern IdentifierMy script builds upon another user-submitted script by rebuilding the logic used to identify candlestick patterns. The logic in my script is a mix of strict and lax guidelines to mitigate false flags and present valid buy and sell signals.
-To use this indicator, simply add it to any chart. It will identify trends on any time frame although the lower you go, the more signals you'll see and the higher probability of those signals being false flags. You can also disable any candlestick patterns that you feel are not as useful.
- This indicator works best with Stocks and also with Forex markets to a lesser extent.
- This indicator works the best on the Daily chart and also works (with varying degrees of success) on any timeframe at or above 1 hour. I've found that this indicator works the best when used in tandem with the Daily and Hourly charts with the Hourly chart being used to determine an entry point while the Daily chart is used for long term trend analysis.

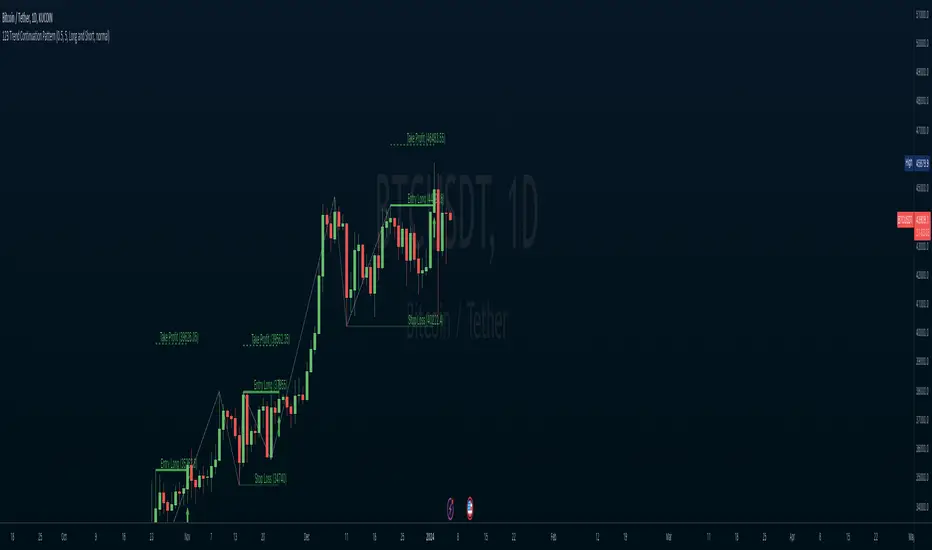
123 Trend Continuation PatternThis simple indicator will help identify the 123 Patterns on the charts. It's build based on the zigzag indicator, which will work as a guideline to identify the 3 points. As soon as the price crosses the third point, the indicator will draw 3 lines: entry, take profit, and stop loss. Those lines will work as a reference and may help with other indicators. This kind of analysis will work on any time frame and symbol, but those markets that have high volatility may have better result
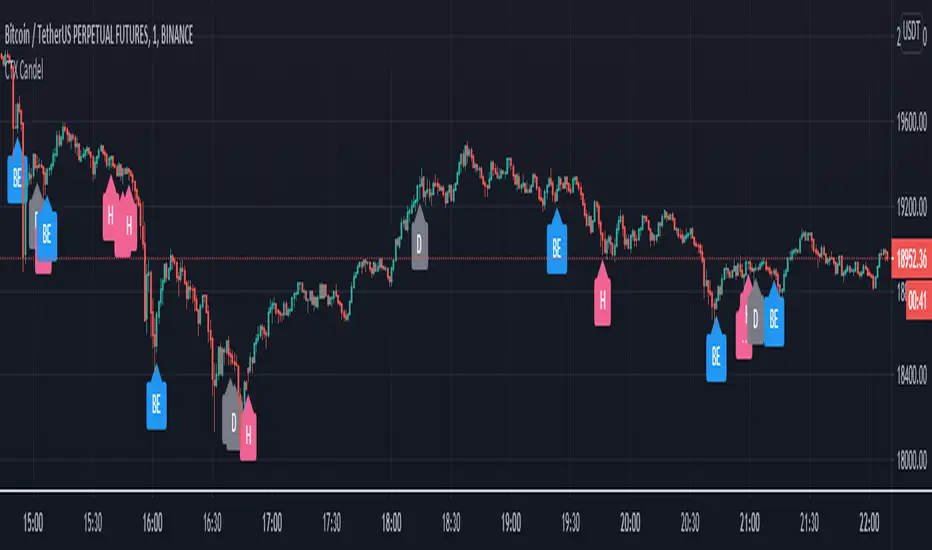
Crypto Trader X Candelstick PatternsCrypto Trader X Candelstick Patterns
this andicator contain all candelstick patterns
Bullish & Berash Engulf Candel, Doji & Dragonfly Doji Candel, Hammer Candel, Hanging Man Candel
inverted Hammer Candel, Shooting Star Candel, Marabuzo black & White Candel, Spinning top black & White candel
Abandoned Baby Bearish, Abandoned Baby Bullish, Gravestone Doji Candel, Harami Bearish Candel, Harami Bullish Candel
Kicking Bearish Candel, Kicking Bullish Candel, Long Lower Shadow Bullish Candel, Long Lower Shadow Bearish Candel
Morning Star, Three White Soldiers, Three Black Crows, Tri-Star Bearish & Bullish, Engulf bar color, Reversal bar , bar color
Up or Down?I read somewhere that candles can easily confuse the eye, making it easy to lose focus. We get distracted by the size of the candle body and the candle's color without paying attention to its true range and how it compares to that of the previous candle.
With Up or Down? you get two signals. The blue arrow below lets you know that the candle's current low and high price are both higher than that of the previous candle -- the range is trending up. Conversely, the red arrow lets you know the low and high are both lower -- the range is trending down.
I designed it with pullbacks in mind. Determine the trend with your favorite indicator. Or use Up or Down? to give you an impression of it. A lot of blue arrows consistently rising broken up by only a few red arrows would indicate an uptrend. Then, wait for signals that don't fit the trend (ie, red arrows in an uptrend). Buy in at the first candle that confirms a return to the trend. (Your mileage may vary.)

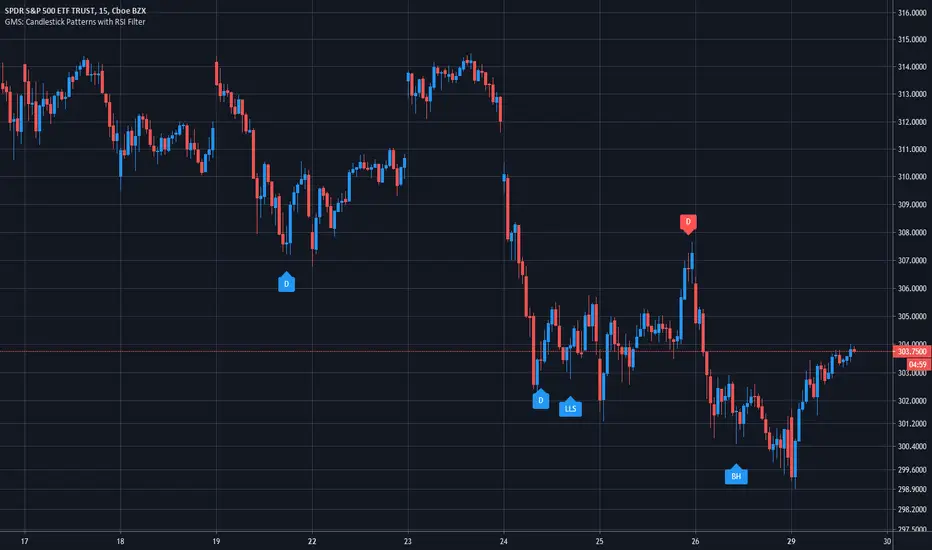
GMS: Candlestick Patterns with RSI FilterI wanted to apply an RSI filter to some of the new Candlestick Patterns (in the indicators tab) since some of them looked to be quite effective for picking reversals. Turns out it's a pretty good pairing.
You can modify the RSI length in addition to the upper and lower thresholds. I also added in check boxes to combine different bullish and bearish patterns.
The candlestick patterns included are:
1. Long Upper Shadow
2. Long Lower Shadow
3. Doji
4. Bullish Harami
5. Bearish Harami
6. Bullish Engulfing
7. Bearish Engulfing
Hope it helps!
Andre
Reversal Candlestick Pattern Detector// Name: Reversal Candlestick Pattern Detector
// Condition:
// 1-up move: last n candles, 3/5 move higher; and/or the last is the highest in past n bars
// 2-down move: last n candles, 3/5 move lower; and/or the last is the lowest in past n bars
//
// Show Bullish reversal pattern in down move; Show Bearish reversal pattern in up move;
//
//Reversal candlestick patterns:
//1. Hammer/Shooting Star,
//2. Engulfing,
//3. Morning/Evening Star,
//4. Harami, --Also Harami could be used in continuation (Rally based Rally/Drop based Drop);
//5. Piercing/Dark Cloud cover,
//6. Hook Reversal
//7. Breakaway Gap, or Gap Crosses SMA8, SMA50. This is for un-filled Gap only. low >high or high

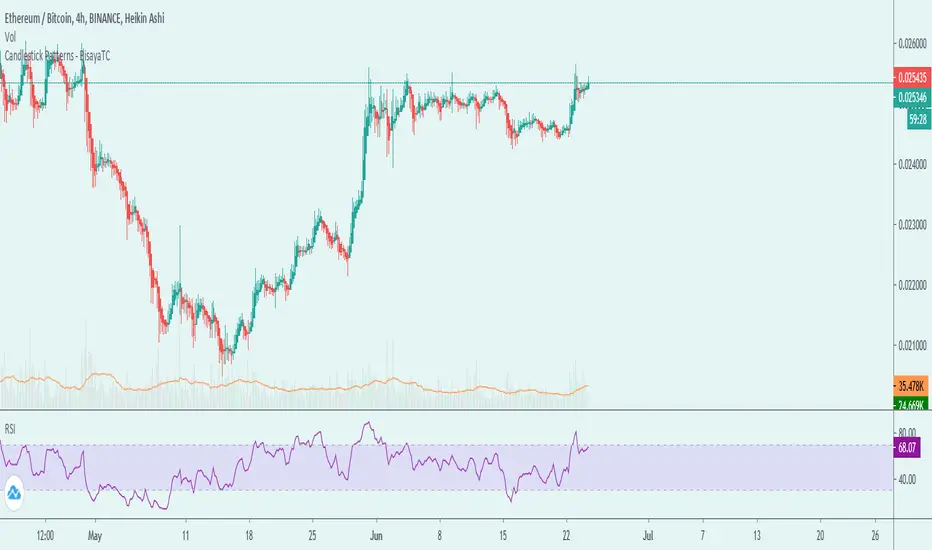
Candlestick Patterns - BisayaTCThe script displays a label when a candle stick pattern is detected based on Trends. This is related to the latest Candlestick patterns released in TradingView. I've created this to have all candlestick patterns in one indicator.
Candlestick Patterns can be one of confirmation of a trend you're following or a reversal.
DISCLAIMER: For educational purposes only. Nothing in this content should be interpreted as financial advice or a recommendation to buy or sell any sort of security or investment including all types of crypto. DYOR