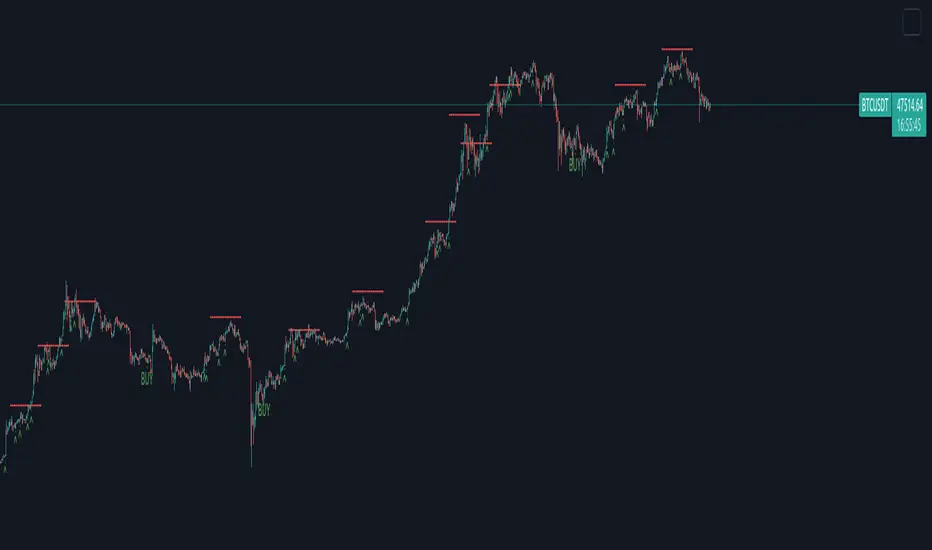
Creentrend Pressure SignalsThe hull moving average is my favorite moving average, as well as slower (55ma Bollinger Bands dev@(1.618)) is my favorite standard deviation indicator. Lets combine the two to evaluate overbought, oversold, and pressure.
Use for all time frames- I PREFER daily.
Bollinger band MA at 55
Hull ma at 55
The Hull is more reactive and faster than any band on the BB (both at 55)
When HULL closes BELOW LOWER BAND- it will print a buy signal, remember- over sold and overbought in VOLATILITY could be dangerous on low time frames, as swift moves typically have short term reversals but return to the main trend eventually, this is why i reccomend daily candles.
When PRICE closes ABOVE UPPER BOLLINGER BAND- it will print a green ^ signal under candle indicating upward pressure.
When HULL closes ABOVE UPPER BOLLINGER BAND- it will print a red resistance line. Complex tops happen a lot with bitcoin so take a 1-5% stop above it if shorting.
ハル移動平均 (HMA)
JC MAs: SMA, WMA, EMA, DEMA, TEMA, ALMA, Hull, Kaufman, FractalThe best collection of moving averages anywhere. I know, because I searched, couldn't find the right collection, and so wrote it myself!
-------------------------------------------------------------------------------
Notable features that either aren't found anywhere else...or at least in one place:
-------------------------------------------------------------------------------
• The "Triple Exponential Moving Average", is actually that mathematically - rather than "three seperate EMA graphs", as is commonly found on Trading View.
• Includes exotic moving averages: Hull Moving Average (HMA), Kaufman's Adaptive Moving Average (KAMA), and Fractal Apaptive Moving Average (FrAMA).
• Each moving average has its own user-definable averaging length in DAYS, rather than an abstract "length". This is respected even for different graphing resolutions, and different chart views - even for the more exotic MAs.
• Days can be fractional.
• A master time resolution ("Timeframe") is also user-definable. And unlike most other moving average charts, this won't affect the internal "length" variable (specified days are still respected), it only changes the graphing resolution. You can also specify to use chart's resolution - which, as you know, is not very useful for moving averages - yet so many moving average scripts on Trading View don't let you specify otherwise.
• If every CPU cycle counts, you can set "days" to 0 to prevent a particular unneeded moving average from being calculated at all.
• Includes a custom moving average that is unique, if you're looking for a tiny edge in TA to beat everyone else looking at the same stuff: a customizable weighted blend of SMA, TEMA, HMA, KAMA, and FrMA. (Note: The weights for these blends don't have to add up to 100, they will self-level no matter what they add up to.)
• By default, the averages are color-coded according to rainbow order of light spectrum frequency, relative to approximate responsiveness to current price: Red (SMA) is the laziest, violet (FrAMA) is the most hyper, and green is in the middle.
-------------------------------------------------------------------------------
Contains the following moving averages, in order of responsiveness:
-------------------------------------------------------------------------------
• Simple Moving Average (SMA)
• Arnaud Legoux Moving Average (ALMA)
• Exponential Moving Average (EMA)
• Weighted Moving Average (WMA)
• Blend average of SMA and TEMA (JCBMA)
• Double Exponential Moving Average (DEMA)
• Triple Exponential Moving Average (TEMA)
• Hull Moving Average (HMA)
• Kaufman's Adaptive Moving Average (KAMA)
• Fractal Apaptive Moving Average (FrAMA)
Note: There are a few extreme edge cases where the graphs won't render, which are obvious. (Because they won't render.) In which case, all you need to do is choose a more sane master resolution ("Timeframe") relative to the timeframe of the chart. This is more about the limits of Trading View, than specific script bugs.
-------------------------------------------------------------------------------
Includes reworked code snippets
-------------------------------------------------------------------------------
• "Kaufman Moving Average Adaptive (KAMA)" by HPotter
• "FRAMA (Ehlers true modified calculation)" by nemozny
• Which in turn was based on "Fractal Adaptive Moving Average (real one)" by Shizaru

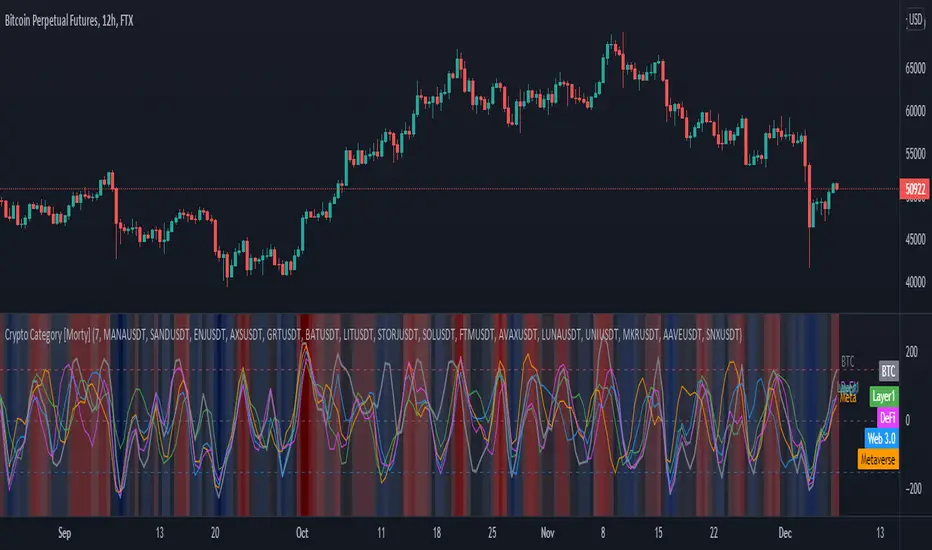
Crypto Category [Morty]This Crypto Category indicator shows an index oscillator for each cryptocurrency category.
Currently there are four categorys, include Metaverse, Web3, Layer1 and DeFi.
Each category index has four compoments and you can custom the input symbols.
The index is a Hull moving avarage of the compoments CCI. You can set the avarage period.
It also show a background heatmap based on the market sentiment which is calculated from the avarage of four indices.
Hull MA TimeFrame CrossOverHello traders,
Although this strategy is configured on BTCUSDT , with a changing of settings, it can be used on any trading instrument.
Here it is seen, on the 2 hour chart. With Trading Fees included in result (adjust to suit your exchange fees).
The candle crossover is set to Daily timeframe.
That means that the Candle crossover is going to see if todays price is higher than yesterdays price.
If user sets this to 4 hour timeframe, the candle crossover would be when price is higher than the the price 4 hours ago...
The rest is simple, a moving average to detect direction, and an ATR StopLoss (if activated).
There is StopLoss and Take Profit settings which work by percentage.
The periods of the moving average and the ATR can be adjusted, as can the TP % and SL %.
The price is taken from the CLOSE or the OPEN or OHLC4 etc... which can be changed in the settings. OPEN is recommended to avoid repainting.
The moving average also has selectable types (ALMA,SMA,EMA,WMA,HMA)
So if the Price is above the Moving average, and the moving average is above the alternate timeframe value, then a buy is activated
if the Price is below the Moving average, and the moving average is below the alternate timeframe value, then a sell is activated
if OPEN is selected as Price source, then the alternate timeframe value would be the OPEN of the alternate timeframes candle.
the values are all plotted on chart so user can see what is happening when what crosses over what, and then what changes when settings are adjusted.
Have FuN!
if this strategy brings you the epik win......
.... dont forget about me
seaside420 ❤️

MAROC Fast/SlowNot sure if a similar indicator already exist, so I created my own. After creating this indicator, I realize it looks very similar to MACD. However, it strictly uses Hull moving average in its calculation for the lines.
MAROC is simply Moving Average Rate of Change. This is a trend-following indicator that calculates the rate of change on two Hull moving averages. By default it calculates the ROC on 60-period HMA (green and red) and 180-period HMA (blue and orange). The zero line represents the confirmation of change in trend. Above zero is up trend and below zero is down trend. Note the difference between the "trend reversal" and the "confirmation of a trend". I like to define trend reversal by the change in direction
The colored squares on the zero line has 4 colors that represents the overall trend. Here I include the slowdown of MAROC as the start of a trend.
- bright green = when both the slow and fast MA are trending up
- faded green = when slow MA trending up, but fast MA trending down
- faded red = when slow MA trending down, but fast MA trending up
- bright red = when both the slow MA and fast MA are trending down
Trend changes triangles are shown to signal the change in trend direction (trend reversal). Green and blue triangles are trend reversal to the upside. Red and orange triangles are trend reversal to the downside.
This indicator includes the option of displaying buy(long) and sell(short) signals that follows these rules. Use at your own discretion, as it may not apply well with your market or ticker.
- Long = Bright green square and either fast or slow MAROC changes trend direction to the upside
- Short = Bright red square and either fast or slow MAROC changes trend direction to the downside
Enjoy~! Please let me know if you find this useful and which market / ticker and timeframe you are using it on~ :)

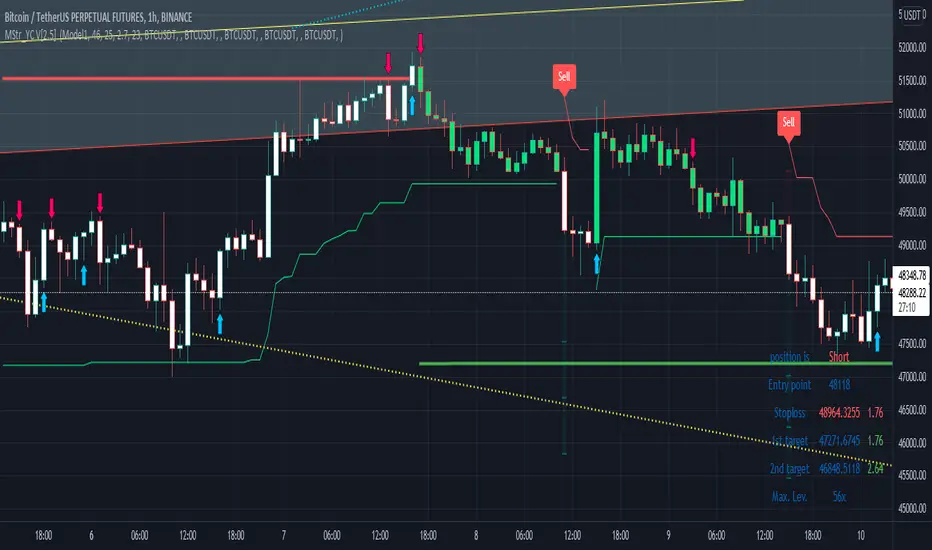
Buy and Sell with Master_in_chart-ind. [V1]This script indicates the Buy and Sell positions on your chart. In addition, it shows entry price , stop loss and possible targets on the chart. The same information are shown in a table where you can find the position type (long/short) in green and red color, entry point, stop-loss (always in red) and targets.
The targets are defined by Risk to Reward ratios 1:1, 1:1.5 and 1:2.
the labels appears when the all conditions are satisfied.
Interesting part of the script is the alert function. Here one can set the script for different
securities and activate alert in TV.
In summary, one can change and tune the setting of the indicator easily by clicking on the gear icon. In the setting, there are four sections. First section sets the slop-loss. Second section activates and shows the super trend indicator. Third section is designed to tune the signals. Finally, you can apply the script on five different symbols at different time-frames. Here you can set alarm to alert you the signals.
I hope you enjoy it!
MACD Infinity Indicator(MACDI)MACDI is the macd of macd indicators and macd of macd indicators of macd indicatrs and so on...!!
I used macd algo to find slopes of macd of price and it can helpfull when we want to find best signalls it can make amazing shapes that can be usable to everyone!
author: Masoud Azizi
github: mablue
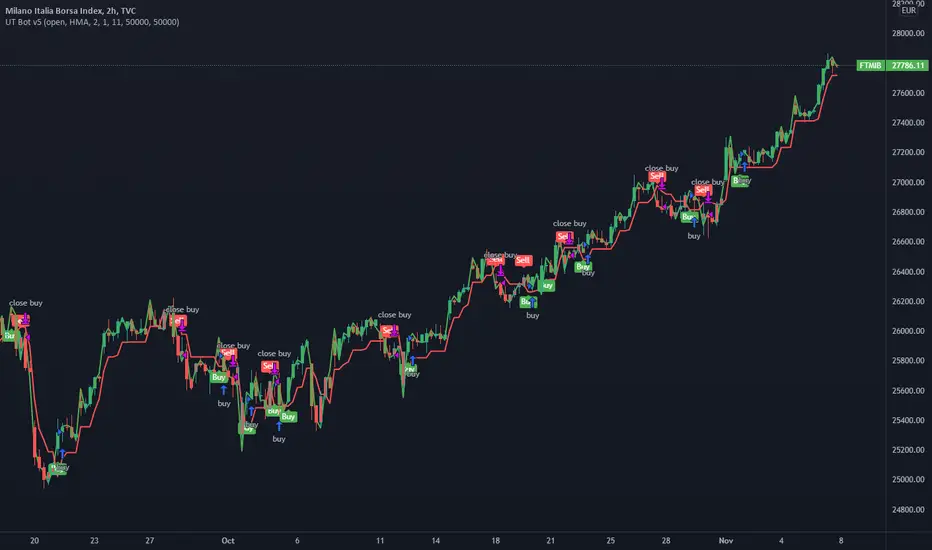
UT Bot v5This is an update by request, on someone elses strategy! well more of an edit, but also update from pine v4 to pine v5.
//CREDITS to HPotter for the orginal code. The guy trying to sell this as his own is a scammer lol.
//Edited and converted to @version=5 by SeaSide420 for Paperina
The UT Bot v5 is Movinging average (the MA) vs ATR (the ATR is in the form intended for use as trailing stop loss (ATR_TSL))
Entry logic:
buy = the MA > ATR_TSL and Price > ATR_TSL
sell = the MA < ATR_TSL and Price < ATR_TSL
The Moving average type can be changed in the settings:
options = "SMA", "EMA", "WMA", "HMA"]
the edits i made were:
convert to v5
Add TP and SL
Add Buy only or Sell only option
Add MA type option
Add price source option
Draw MA and ATR_TSL on-chart
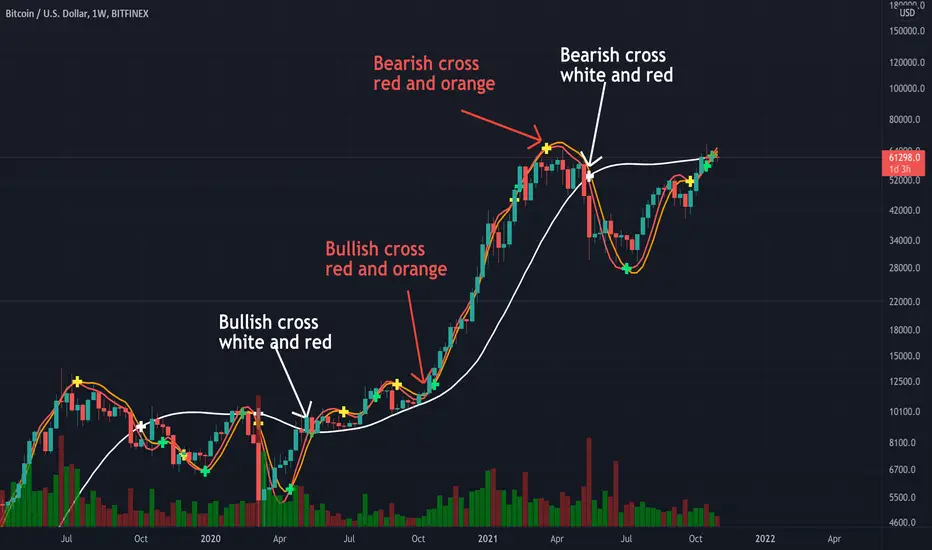
Triple Modified Hull Moving Average Cross By <Zakaria>Triple Modified Hull Moving Average Cross By
What is this?
this is a modified formula for Hull moving average, it is more accurate and predicts the golden and death cross earlier.
How to use?
Work better in high time frames (1D,1W)
the white line vs the red and the orange lines :
1 - when the white line crosses the red and the orange lines from the bottom the price will go down . Death cross!
2 - when the white line crosses the red and the orange lines from the top the price will go up . Golden Cross!
the red line vs the orange line :
1- when the orange line crosses the red line from the bottom the price will go down . Death cross!
2 - when the orange line crosses the red line from the top the price will go up . Golden Cross!
p.s: the lag between these two lines will be very small. use it in the 1W time frame to predict where exactly the bull market will end.
You can input your personalized values if you want!
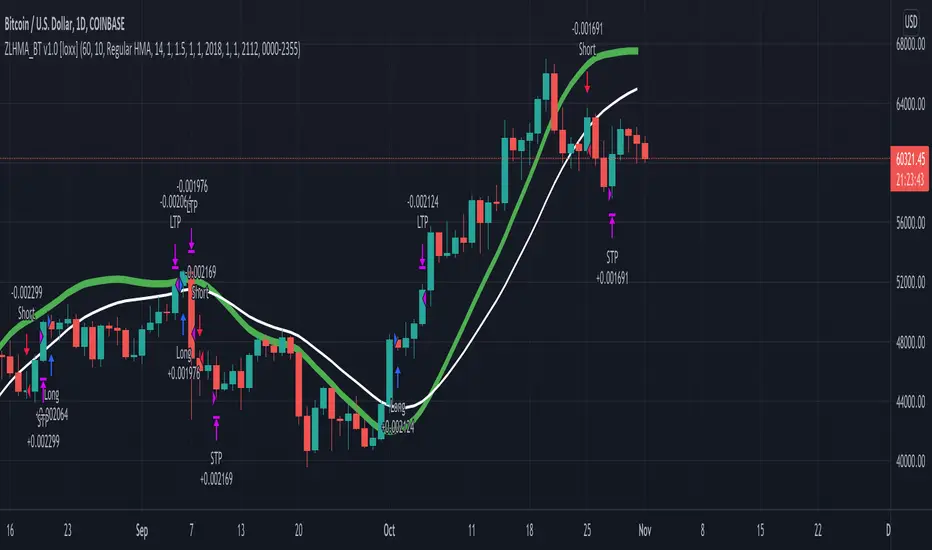
Zero-Lag HMA Backtest v1.0 [loxx]This backtest compares profitability differences between a regular Hull Moving Average ( HMA ) and a Zero-Lag HMA .
Things to know:
- Profit is set to 1 ATR
- Stop-loss is set to 1.5 ATR.
- This is by design to test the minimum the profit scenario (1 ATR up) and the worst case loss scenario (1.5 ATR down) for momentum trading. Actual results vary when additional TPs are added
How to use:
- Adjust settings and dates to view different market structures and position scenarios
- See results in the "Strategy Tester" pane
Conclusions and what's next
- Modifying HMA does very little to improve backtest results
- Future iterations will include options to backtest various moving averages with additional modifiers to improve profits and avoide losses
Comment below or send a PM with questions, comments, observations, or concerns.
Strategic Trend By TrendciHoca
Hello everyone, this indicator, which is similar to the Most indicator, which is one of the most used indicators in the market, also has the following features.
1. BB and BS point: HMA 200 bar was used for BB point. The same applies to BS. When the last closing price crosses HMA200 up, BB signals, and when it crosses down, BS signal comes.
2. GO and ATTENTION point : Attention signal should be used when the trend is long and profit can be taken at this point if desired. The Go signal should be used when the trend is short and profit can be taken at this point if desired. EMA and ATR were used to calculate these points.
All signal alarms come embedded in the indicator.

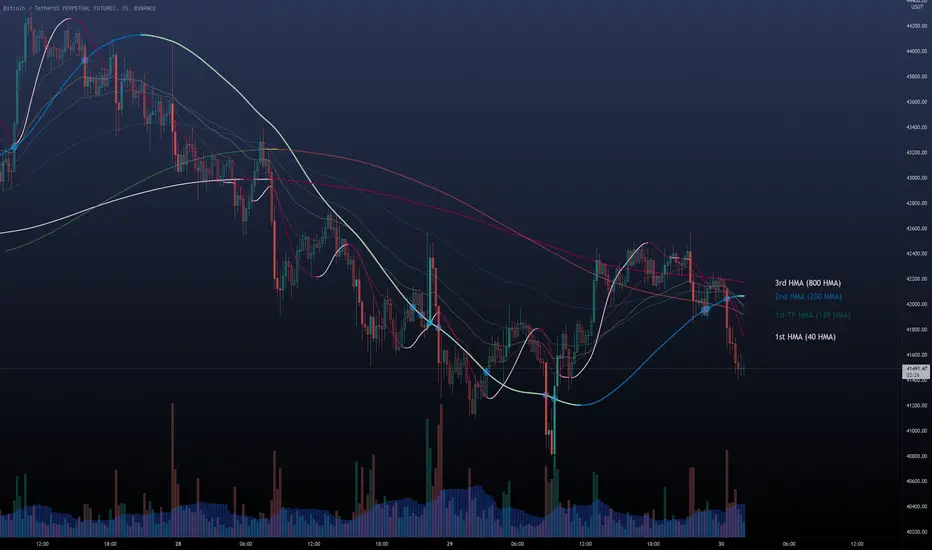
Multi HMA Lines by NB(ENG)
The Hull Moving Average (HMA) line responds quickly to volatile markets,
sometimes it provides more accurate information than the Exponancital Moving Average (EMA).
In particular, the 200 HMA line is easy to decide the overall trend of the market,
and it serves the basis entry position.
So I made indicator that provides these HMA lines into various periods so that they can be checked in one.
In addition, a custom TimeFrame HMA line function has been added so that you can check
not only the TimeFrame that meets your trading standards, but also the HMA of the other TimeFrame that you custome sets.
For example, if you want to see the 200 HMA of the 60-minute bar, you can select and set the different TimeFrame in the Multi TF section below.
For reference, 200 HMA at the 15-minute bar is the same value as 50 HMA at the 1-hour bar, so as shown in the following chart,
I use 4 HMA lines at the 15-minute bar : 20 HMA, 50 HMA, 200 HMA, and 200 HMA from 60-minute TimeFrame.
We hope it will help you in your trading. :)
(KOR)
HMA(Hull Moving Average) 라인은 변동성이 심한 시장에 빠르게 반응하며,
때때로 EMA(Exponancital Moving Average)보다 더 정확한 정보를 제공하곤 합니다.
특히 200HMA 라인은 시장의 전반적인 추세를 판단하기에 용이하며,
큰 틀에서의 포지션 진입 근거의 기반이 됩니다.
이러한 HMA 라인을 다양한 기간으로 나누어 하나의 지표에서 확인 할 수 있도록 만들어 보았습니다.
아울러, 자신의 매매 기준에 맞는 타임 프레임은 물론, 다른 타임 프레임의 HMA도 확인 할 수 있도록
커스텀 타임 프레임 HMA 라인 기능을 추가로 넣었습니다.
예를 들어, 15분 타임 프레임이 본인 매매 기준표이지만, 60분 봉의 200 HMA도 보고 싶다면
밑의 Multi TF 항목에서 해당 타임 프레임을 선택 후 설정하시면 됩니다.
참고로 15분 봉에서의 200 HMA은 1시간 봉에서의 50 HMA과 동일한 값이므로 저는 다음 차트 그림과 같이
15분 봉에서 20 HMA, 50 HMA, 200 HMA, 그리고 1시간 봉에서 200 HMA 이렇게 4개의 라인을 참고 하고 있습니다.
여러분 거래에 도움이 되기를 바랍니다. :)
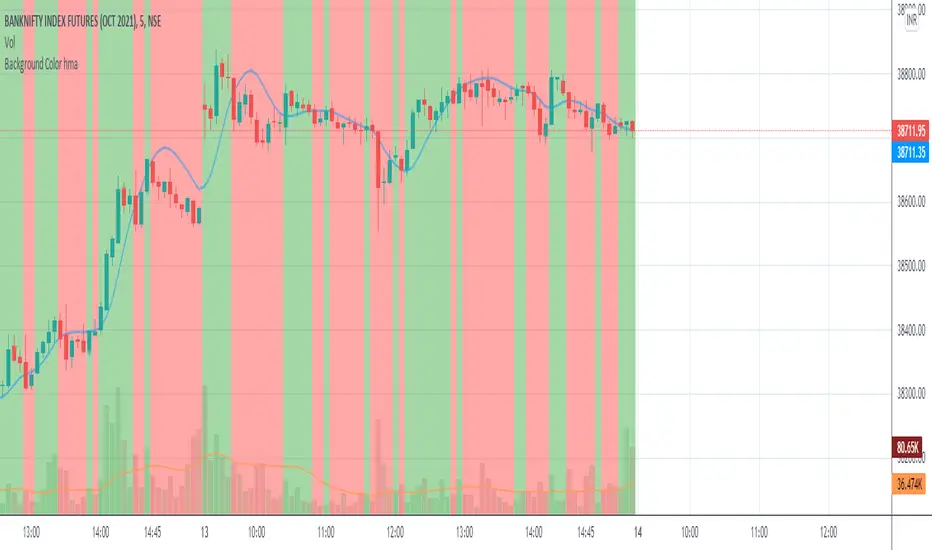
Iceberg Intraday LearningHOW TO USE?
A setup which contains Most Useful 14 indicators, that any Intraday Trader might require.
Below will see one by one-
1) Trend Following Icebergs - (3 Different Indicators to choose from)
--> The trend following indicators optionally.
--> Very simple to understand, yellow indicating sideways, green - going upside, and red - going downside.
--> Trend Indicator - 1st Iceberg is HMA Crossovers
--> Trend Indicator - 2nd Iceberg is SMA (20). It will change its color according to the trend of the market.
--> Trend Indicator - 3rd Iceberg is RSI(14) in EMA, will be plotted at the bottom of the screen.
2) Classic Pivot Points & Floor Pivot Points: - ( 2 Different Indicators to choose from )
--> Classic Pivot Points having 5 Supports & Resistances on the chart.
--> Floor Pivot Points, At the middle, it is pivot point (PP) level and multiple support and resistance levels
--> Floor Pivot Points is a very known indicator that indicates whether that helps in-stock selection.
--> This is a very crucial indicator as it shows the Floor Pivot Points levels for the next day.
--> One can make a learn by looking at next day's Floor Pivot Points that whether the stock is going to be trendy/sideways the next day.
3) Support/Resistance
--> This indicator is used for finding support and resistance levels on charts.
--> Helps in getting pullbacks and exit levels
--> Lines will change color automatically if any candle closes above the support/resistance line. It will change it's to green.
--> Similarly, it will change its color to red if the price is below the support
4) Highs/lows, SuperTrend Up Down ( 2 Different indicators to use )
--> Plots Highs / Lows in the selected time frame.
--> Added SuperTrend indicator with length 10 with source HL/2 and multiplier to be 2.
5) Dynamic ATR - Average True Range (14 Days)
--> It plots 2 important levels at the starting of the day.
--> 2 bands are plotted in the morning when the market opens, resembling strong support/resistance zones.
6) First Candle
--> This will highlight the first candle that is formed of the selected time interval.
7) Bollinger Band
--> Bollinger band is also added for better catching the momentum as seen on chart.
--> The Upper and Lower Bands are used as a way to measure volatility by watching the relationship between the Bands and price
8) VWAP
--> VWAP is useful for learning trend direction in any market conditions.
9) RSI & MACD
--> Plots label indicating the status of RSI and MACD.
This works for Intraday Trades - when the resolution is kept to less than 1 hour ( Say 3 , 5 , 10 , 15 Mins), This works well when the resolution is kept to 1 Day - Good for Swing Trades spanning over a few days, This works well when the resolution is kept to 1 Day or Week - Good for Investments.
Trend Indicator - 3rd Iceberg Is a repainted based on the hybrid RSI Logic
Stop Loss - That should be done by following ones risk appetite , Ideally the open/close of the previous candle should be the stop loss for the buy/sell but everyone has their own Risk Management Strategies based on the capital deployed.
If you like it and find it useful or if you find a defect or bug , Please let us know in the comments .. that would encouraging !! for us to develop it further
Coded for learning INDIAN Markets.
CAUTION:: There could be scenarios when the breakout/breakdown candle is rejected , especially when it is long one
so it is always recommended to have a confirmation candle that open-closes above the breakout candle / open-closes below the breakdown candle.
Disclaimer: No Investment Advice Provided , You should always understand that P AST PERFORMANCE IS NOT NECESSARILY INDICATIVE OF FUTURE RESULTS.
Inspiring to learn the Pine making market learnings easier.
Thanks & Regards,
Iceberg Intraday Learning.

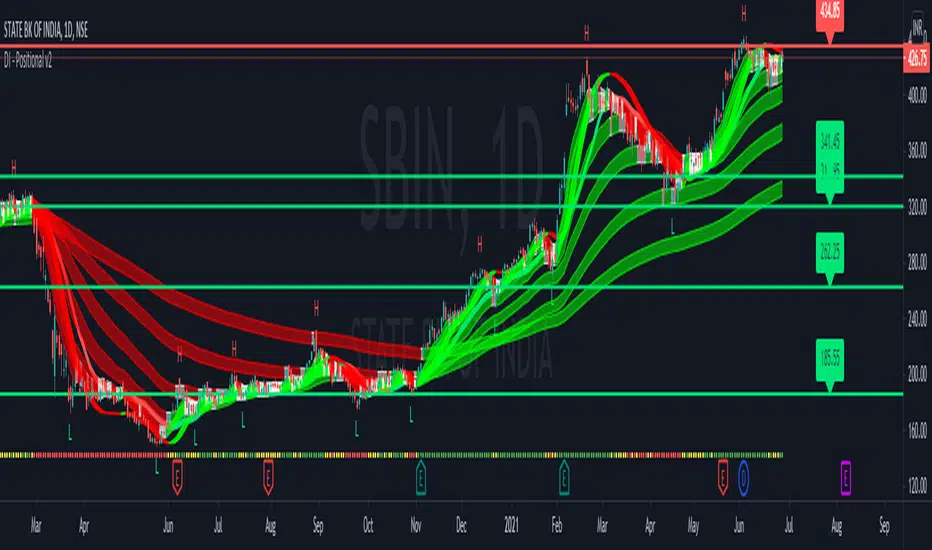
D Indicators - Positional tool*Presenting a perfect setup for Positional and Swing traders.
1) Slow and Fast Bands
# 3 fast and 3 slow, in total of 6 EMA bands are added to the indicator in order
to make accurate decisions and helping find out in which trend the price is.
Enter when price gives a breakout above or below all of the 6 bands.
2) Trend Indicators
# Total of 3 trend indicators are also included:
Trend Indicator 1 ---> It is a SMA(20) and its color changes based upon
Trend Indicator 2 ---> will be plotted at the bottom of the screen. Based upon RSI
Trend Indicator 3 ----> EHMA
Their color will be yellow whenever the market is sideways which will act
as a cautionary sign that in about next phase the price will be rangebound.
Use them as a helping hand, and check whether they show the same trend or not while you enter.
3) Support/Resistance lines
# On charts, this indicator is used to locate levels of support and resistance.
As a function, Targets and SL can be planned.
When a candle closes above the support/resistance line, the lines change
color automatically. It'll turn green.
If the price is below the sup, it will also change color to red.
4) High/Low
# Will mark the high/low of a particular swing so that, one can place the SL over there and enter.
Thank you and regards,
D Indicators
HSV Week IndicatorSquarily Gay HSV Week For All Attendees!
With this HSV Week Indicator you can pride yourself with all the colors of the spectrum right here on your chart! The more the merrier so indulge yourself with the code to see the possibilities open for you with this transformatory experience of HSV Space and Time!

B&S v3.2This strategy uses RMA, Moving Average used in RSI , to create the buy and sell signals. It is the exponentially weighted moving average with alpha = 1/length.
IT SHOWS ON THE GRAPH:
Buy: Long position.
Sell: Short position.
V ⇣: Institutional volume .
V ⇡: Institutional volume .
T ⇣: Downtrend.
T ⇡: Uptrend.
Volume (V ⇣/V ⇡) when Market Makers moving smart money.
When 200SMA is above 100SMA (T ⇡) 200SMA is below 100SMA (T ⇣)
HOW TO USE?
If you are trading any asset that is in an uptrend, avoid shorting until the sign (T ⇣) appears followed by the Institutional Volume signal (V ⇣) indicating reversion.
If you are trading any asset that is in a downtrend, avoid long positions until the signal (T ⇡) appears followed by the Institutional Volume signal (V ⇡) indicating reversal.
For long operations use "🕗 360" setting for Daily timeframe.
For Day Trade use "🕗 30" for 1 hour or 30 minutes timeframe.

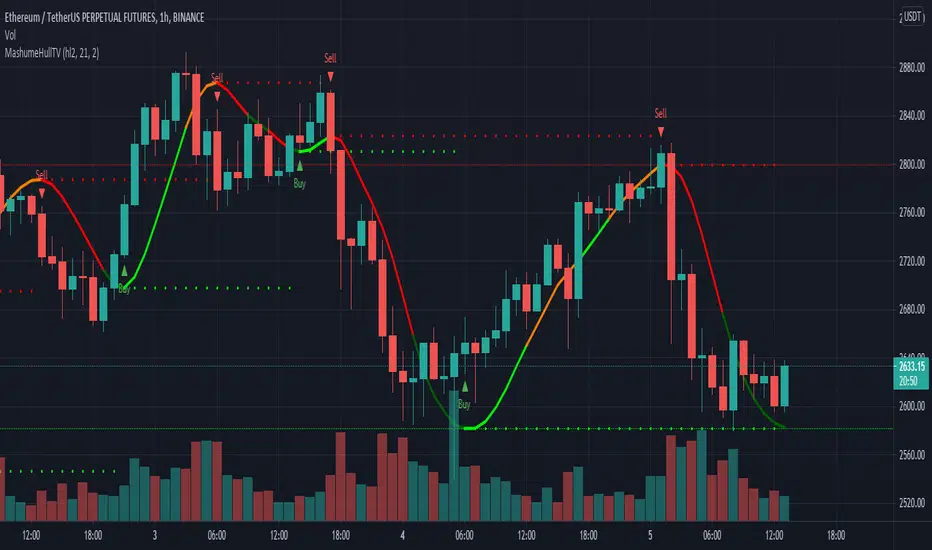
MashumeHullTV█ OVERVIEW
This plots the Hull Moving Average Turning Points and Concavity
with the addition of colored segments representing concavity and turning points: maxima, minima and inflection.
a fast way to determine the trend direction and possible reversals based on concavity of the trend
Dark Green: Concave Up but HMA decreasing. The 'mood' has changed and the declining trend of the HMA is slowing. Possible trend change to Uptrend soon
Light Green: Concave up and HMA increasing. Price is increasing, and since the curve is still concave up, it is accelerating upward. Uptrend
Orange: Concavity is now downward, and though price is still increasing, the rate has slowed, perhaps the mood has become less enthusiastic. Possible trend change to Downtrend soon
Red: Concave down and HMA decreasing. Downtrend
Buy signals generated when Hull turns from Dark Green -> Light Green
Sell signals generated when Hull turns from Orange -> Red
To best determine if this is a entry point or a trend reversal, it is recommended to use in conjunction with the QQEMoMoTV indicator
█ FEATURES
Calculations
Calculates the concavity of the Hull Moving Average comparing the Hull concavity of the current bar to the previous bar and displays the concavity in the form of 4 different colors.
Note: may cause repainting, so recommended to use with another indicator such as the QQEMoMoTV indicator to confirm signals.
Calculates divergence between the calculated HMA and the actual price and displays this in the Divergence Label.
Calculates the local minima, maxima and inflection points with the ability to display these as auto support/resistance lines.
Inputs
You can use the script's inputs to configure:
• Calculation Source (default HL2)
• HMA Length (default 21)
• Lookback (default 2)
• Whether to show Auto Support/Resist Lines
• Whether to show Buy/Sell Arrows
• Whether to show Divergence Label
• Whether to extend Local Auto Support/Resist Lines
Alerts
Buy Signal alert based on HMA crossing above MA_Min/Hull Support, when Hull turns from Dark Green -> Light Green, Bullish
Sell Signal alert based on HMA crossing below MA_Max/Hull Resistance, when Hull turns from Orange -> Red, Bearish
Experimental support for applying the indicator to higher time frames
eg. charting the hourly MashumeHull indicator on 15 min chart. See the commented code to access this feature
█ CREDITS
Original Author: Seth Urion (Mashume)
Feature upgrades and usage: Xiuying
Converted to Tradingview by: Machdragon
HMA_ATR StrategyATR with HMA experimental minimalist bot for ETHBTC .
A strategy for use by Automated Algorithm systems.
Different from normal ATR as it uses HMA for smoothing.
Example settings result shown here on chart include commission 0.5%

Dump Detector - Hull Moving AverageDump Detecter uses HMA (Hull Moving Average) to detect dumps/downtrends. Can be used as an exit trigger for long bots or an entry trigger for short bots. Pump signals can be turned on with tickbox.

Hull Suite by InSilico Extended 2x VersionJust an extended version of InSilicos great Hull Suite
Added Functions
- Second Hull Indicator with all options
- HTF color fix for the bands and barcolors
Borg's BaselineMoving average baseline comprised of and an adjustable Keltner Channel band around the MA.
Used as directional bias indicator in systems trading.

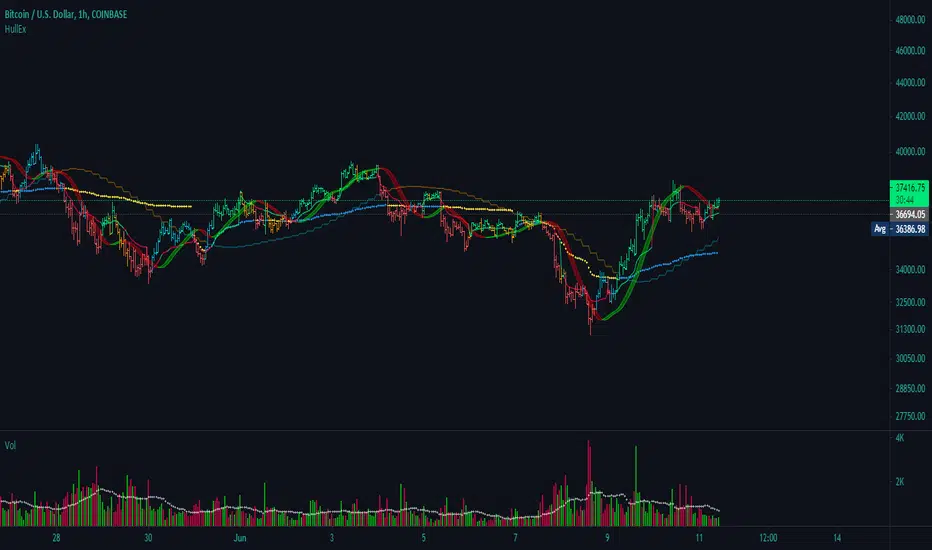
Hull MA with BB (With Alerts)This is a combination of the standard Bollinger bands with a VWAP(Pink line), and the 'Hull Trend with Kahlman' script by user capissimo, and the NMA (Moving Average 3.0 (3rd Generation)) script by everget.
You can find the original scripts here:
This indicator gives you several confirmations of a good entry and exit positions for Crypto currency like bitcoin and most alt coins. I use this on a 15min, 30min, 1hour, and 4hour chart for best results.
How to use:
Entry Signals:
-A candle closes above the NMA (Yellow Step Line). AND
-You see a Long (text) flag. AND
-The candles are near the bottom of the Bollinger bands and heading upwards.
Exit Signals:
-Candles have passed below and closed below the NMA (Yellow Step Line). AND
-You see a Short (text) flag.
It's important to use these confirmations with other indicators so you have the best entry/exit positions, and make sure you are on normal candles and not HA or any other types.
There are alerts built in that you can setup for the Short and Long text flags that you see. These are generally good alerts to follow. I use the alerts as a reminder to check the charts and see if my other indicators line up for a good trade.
