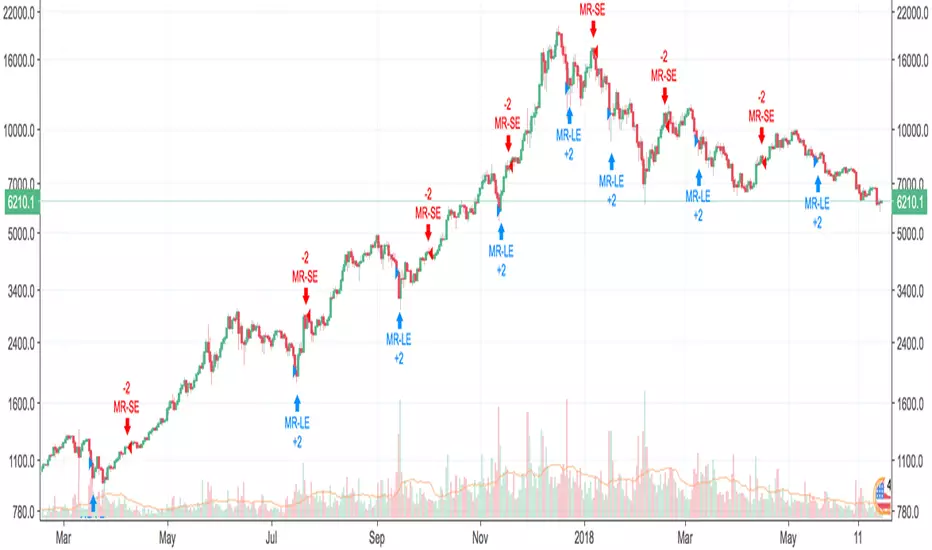
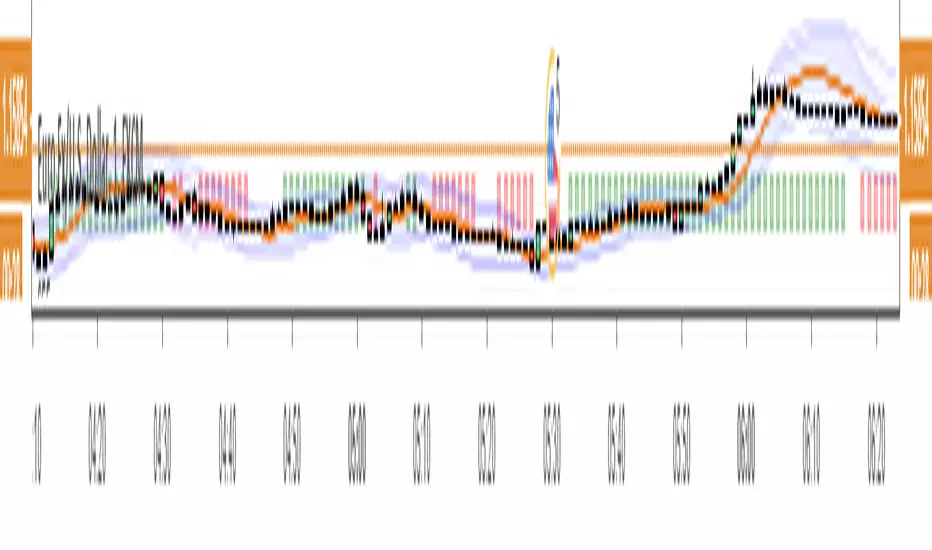
Mean Reversion w/ Bollinger BandsThis is a more advanced version of my original mean reversion script.
It employs the famous Bollinger Bands.
This robot will buy when price falls below the lower Bollinger Band, and sell when price moves above the upper Bollinger Band.
I've only tested it on the S&P 500, though you could try it out on other assets to see the backtest performance.
During the recent COVID-19 bear market drop, it produced several buy signals on the S&P which I followed, and made some nice gains so far.
I still think this would make a better investing strategy (buy undervalued / sell over-valued), rather than a trading strategy.
I use this robot for my long term portfolio.
Mean

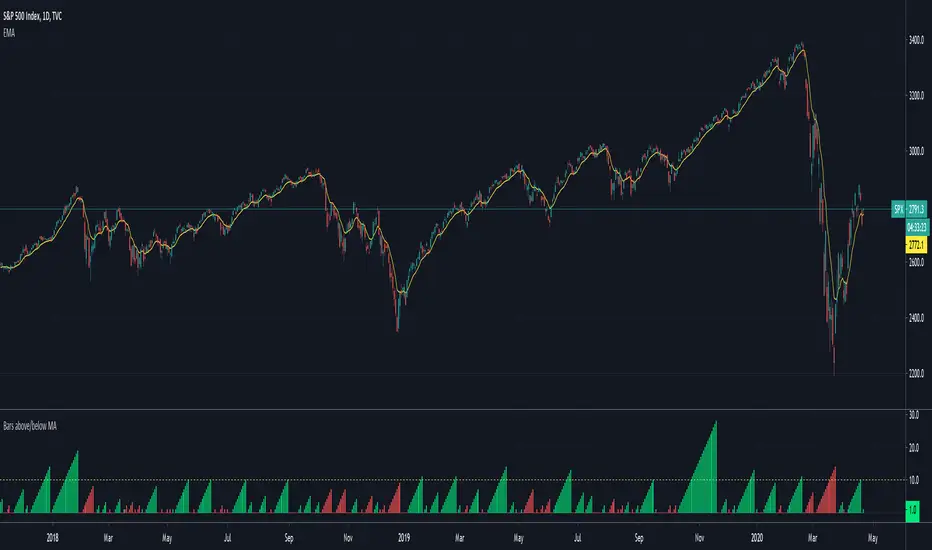
Bars above/below EMACount of previous bars above or below a chosen Exponential Moving Average. Typically price reconnects with well defined EMAs regularly. If the price has been above/below an EMA for too long, you can expect a reconnect in a short order and bet on mean reversion strategies.
Mean Absolute Deviation BandsThe other way to build bands around price that uses Mean Absolute Deviation instead of Standard Deviation.
MAD is also a measure of variability, but less frequently used. MAD is better for use with distributions other than the Gaussian.
MAD is always less than or equal to Standard Deviation and the resulting bands are more tighter for the same parameters if we compare it to Bollinger Bands.
If you use band stops this can be useful.

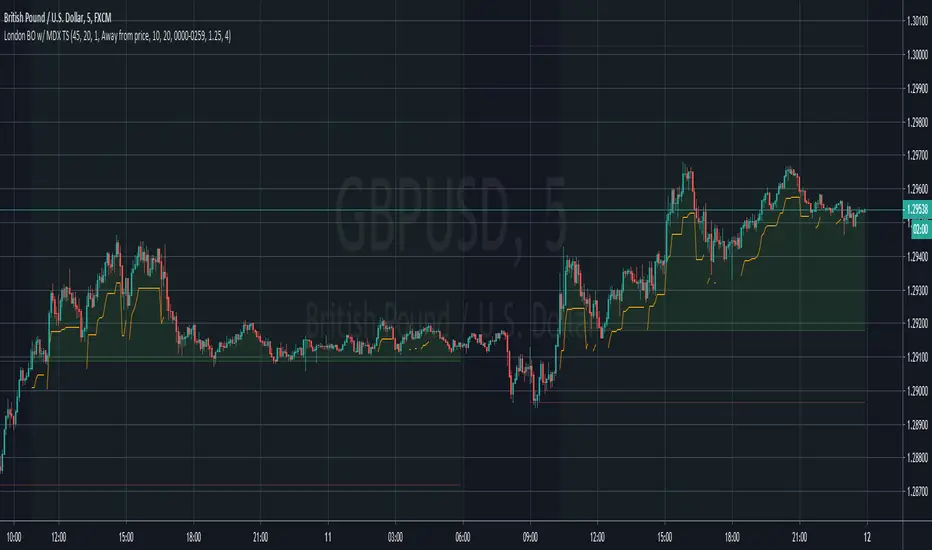
London Breakout with MDX Trailing StopThis indicator aims to aid in using the regular London Breakout strategy, as well as improve on it by adding a trailing stop based on the Mean Deviation Index.
The London Breakout strategy (according to my personal understanding) basically sees the morning before London open as the accumulation or distribution range for large buyers or sellers, and assumes the market will break either above that mornings high or below that mornings low when they start to move price. It is mostly used to trade stock indices and forex.
This indicator plots the morning high and low for each day. The green line is the morning high, and the red line is the morning low. If price moves above the green line (the morning high) it fills that area with a green color. If price moves below the green line (the morning low) it fills that area with a red color. This makes the breakouts easy to spot.
The background color of the chart turns green when the MDX is above 0 (price is more than X times ATR above the mean) and a breakout above the morning high has occurred, and stays green until the opposite happens.
The background color of the chart turns red when the MDX is below 0 (price is more than X times ATR below the mean) and a breakout above the morning high has occurred, and stays green until the opposite happens.
The default for X above is 1.0, but this can be changed in the settings by changing "ATR Multiplier".
The background is always neutral during the morning session since the morning high and morning low are not established yet.
A trailing stop is shown when price is more than X times away from the mean and a breakout has occured. The distance is set using the MDX. The trailing stop uses a separate ATR multiplier though, to make the signal and trailing stop MDX values different, if one likes. The default ATR multiplier for the trailing stop is 1.25, but this can be changed is the settings by changing "ATR multiplier for trailing stop".
When the high or low of a candle breaks the trailing stop, it is moved further away, indicating you have been stopped out, but gives opportunity to use it if you enter again (so it doesn't just disappear).
As an added bonus, take profit levels have been added based on the mornnig range. The take profit distance is set by multiplying the range with a factor. The levels are then plotted that distance from the morning high and morning low.
MDX:
Mean Deviation IndexThe Mean Deviation Index (MDX) is used to see how much price is deviating from the mean. This indicator takes both volatility and mean deviation in consideration.
It uses the standard deviation of the ATR to filter an EMA, and uses this as the mean. It then only plots > or < 0 if price is more than one x ATR away from the mean. If index is positive, the background turns green, meaning price is more than 1 x ATR above the mean. If the index is negative, the background turns red, meaning price is more than 1 x ATR below the mean. This setting can be changed by changing the setting "ATR Multiplier", but the default is 1 x ATR.
There are two main ways to use this index.
1. Use it aggressively to find trends (by combining it with other indicators) by entereding each time the background changes color to green for longs or red for shorts.
2. Use it spot breakouts, waiting for a pullback, and then entering on the next move in the same direction. In this context for a short, you wait for the background color to turn green, then wait for the index to pull back, and then enter once it starts moving up again.

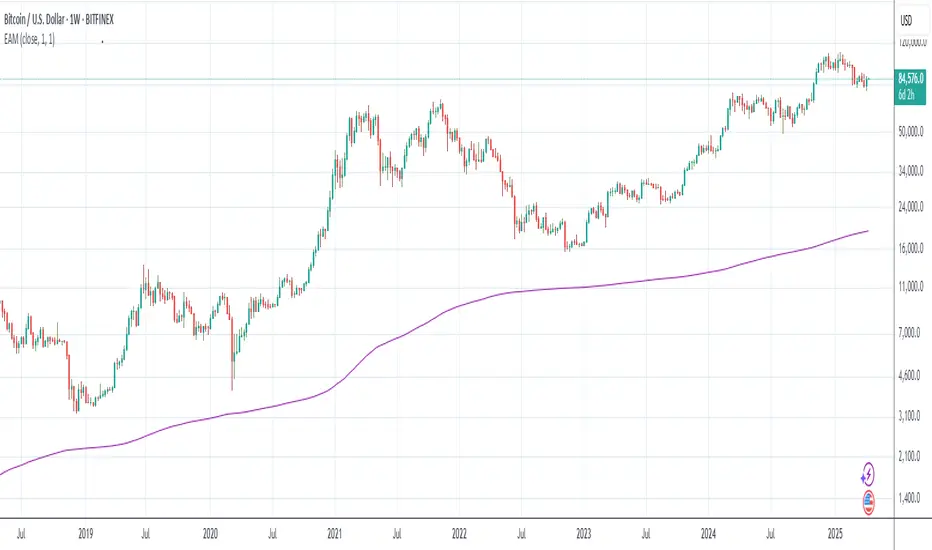
YJ Mean ReversionMean reversion strategy, based upon the price deviation (%) from a chosen moving average (bars). Do note that the "gains" are always relative to your starting capital, so if you set a smaller starting capital (e.g. $10000) your gains will look bigger. Also when the strategy tester has finished calculating, check the "Open P/L", as there could still be open trades.
Some Tips:
- Was designed firstly to work on an index like the S&P 500 , which over time tends to go up in value.
- Avoid trading too frequently (e.g. Daily, Weekly), to avoid getting eaten by fees.
- If you change the underlying asset, or time frame, tweaking the moving average may be necessary.
- Can work with a starting capital of just $1000, optimise the settings as necessary.
- Accepts floating point values for the amount of units to purchase (e.g. Bitcoin ).
- If price of units exceeds available capital, script will cancel the buy.
- Adjusted the input parameters to be more intuitive.

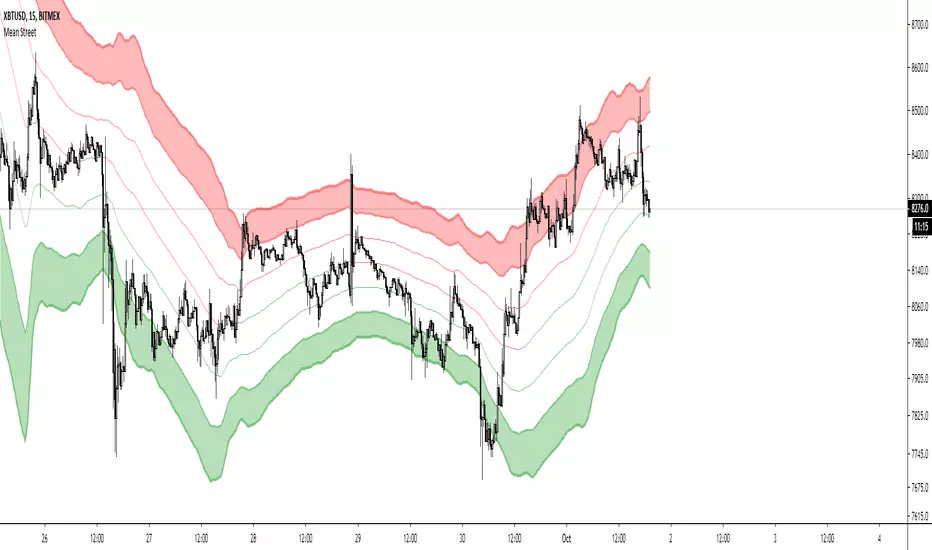
Mean Street V1script for mean reversion conditions - tweak-able based on the volatility of the asset its used on, and the time frame
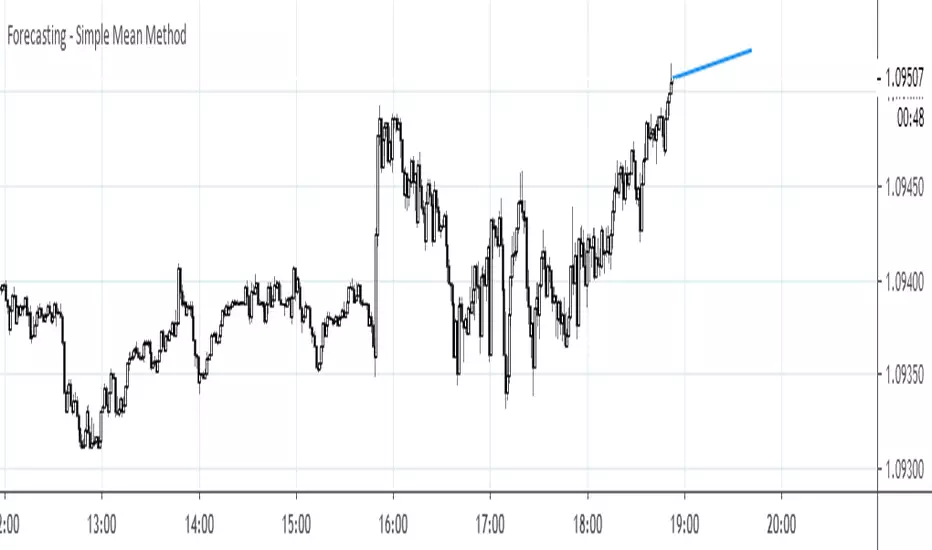
Forecasting - Simple Mean MethodThis is a continuation of my series on forecasting techniques. The idea behind the Simple Mean method is to somehow extend historical mean to the future. In this case a forecast equals to last value plus average change.
Mean Reversion IndicatorThis is a mean reversion indicator that anticipates a local trend reversion. Basically, it is a channel with the mid-line serving as a moving mean baseline. Each of the two curves run up and down within this channel bouncing off from the top and bottom bounds. Touching the bounds serves as an indication of a local trend reversal. The reversal signal is stronger when there exists a resonance (symmetry) in the two curves. The background histogram shows a Karobein oscillator that contributes support or resistance for the signal.

Return to the Mean OscillatorThe Return to the Mean Oscillator shows the spread between the selected mean study and the actual close in price.
In this first version, I'm including the All-Time Historical Mean, which is the evolution of the mean value of that asset since its inception.
By using this indicator we are able to see if a particular market is trading above/below historical mean value.
The Mean value equals zero in the oscillator scale.
Therefore, we can use this indicator to clearly identify 'Return to the Mean' moves.
Note: Tradingview limits the number of candles we can use on each time frame.
Depending on the deepness of historical data, it is possible that the mean value could miss old data and therefore plot different levels for each timeframe.
That is especially true for markets with a long history or when we calculate it for intraday time frames.
In case of doubt, refer to the mean value at higher time frames.

Return to the MeanThe Return to the Mean plots reference values that price action tends to revisit each cycle.
In this first version, I'm including the All-Time Historical Mean, which is the evolution of the mean value of that asset since its inception.
By using this indicator we are able to see if a particular market is trading above/below historical mean value.
Moreover, we can use this indicator to anticipate powerful 'Return to the Mean' moves.
In addition to the All-Time Historical Mean, I'm planning to add alternative 'return to the mean' studies to this indicator.
Note: Tradingview limits the number of candles we can use on each time frame.
Depending on the deepness of historical data, it is possible that the mean value could miss old data and therefore plot different levels for each timeframe.
That is especially true for markets with long history or when we calculate it for intraday time frames.
In case of doubt, refer to the mean value at higher time frames.

Escape VelocityThis script is meant to calculate the Escape Velocity from the mean. According to Investopedia "Mean reversion is theory used in finance that suggests that asset prices and historical returns eventually return back to the long-run mean or average level of the entire data set."
Escape Velocity is the lowest velocity which a body must have in order to escape the gravitational attraction of a particular planet or other object, in this case the mean. It is recommended that you use a moving average with the same length as the ones that you decide to use for this indicator.
Escape Velocity= sqrt((2*Gravitational Constant * Mass)/Distance from the mean)
The Escape Velocity is in red and the velocity of price is in green. When price velocity (green) is positive and greater and than escape velocity (red) and price is above the mean, this would indicate that price is breaking away from the mean (bullish). When price velocity is negative and less than escape velocity and price is below the mean, this would indicate that price is breaking away from the mean (bearish).

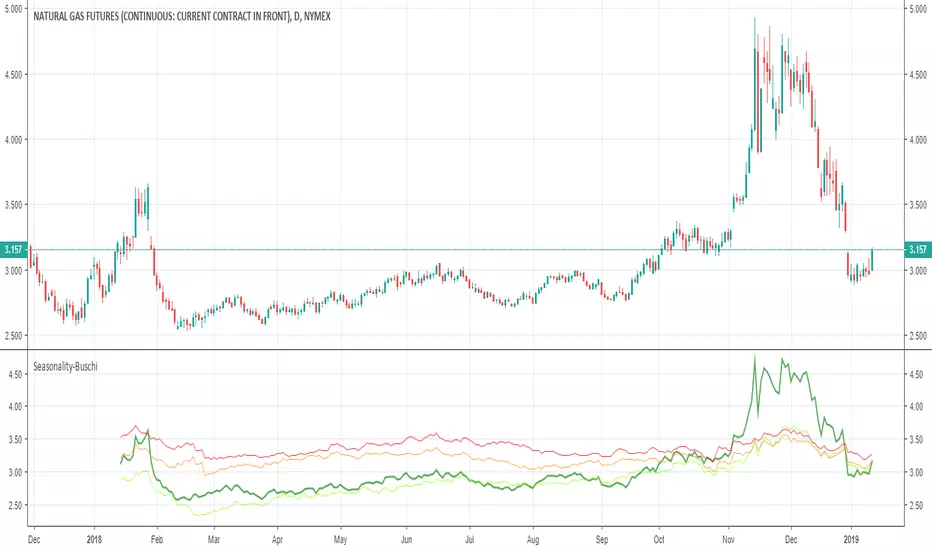
Seasonality-Buschi
English:
This script shows the price development over the last year (default: green) and mean prices over the last three (default: light green), six (default: orange) and nine (default: red) years and is therefore at least some kind of approach towards true seasonality.
Thanks to user "apozdnyakov" for providing most of the code!
Deutsch:
Dieses Skript zeigt den Kursverlauf über das letzte Jahr (Standard: grün) und die durchschnittlichen Verläufe über die letzten drei (Standard: hellgrün), sechs (Standard: orange) und neun (Standard: rot) Jahre und stellt damit zumindest eine Annäherung zu einer echten Saisonalität dar.
Dank an User "apozdnyakov", der den Großteil des Codes zur Verfügung gestellt hat!
TRI Mean OscillatorThe Mean Oscillator shows the spread between the historical mean and the actual close price.
By using this indicator we are able to see if a particular market is trading above/below historical mean value.
The Mean value equals zero in the oscillator scale.
Therefore, we can use this indicator to clearly identify 'Return to the Mean' moves.
Note: Tradingview limits the number of candles we can use in each time frame.
It is possible that the mean value could miss old data.
That is especially true for markets with a long history or when we calculate it for intraday time frames.
Credit for this idea goes to Brian Beamish www.therationalinvestor.com

TRI Mean MachineThe Mean Machine plots the evolution of the mean value of that asset since its inception.
By using this indicator we are able to see if a particular market is trading above/below historical mean value.
Moreover, we can use this indicator to anticipate powerful 'Return to the Mean' moves.
Note: Tradingview limits the number of candles we can use on each time frame.
It is possible that the mean value could miss old data.
That is specially true for markets with long history or when we calculate it for intraday time frames.
Credit for this idea goes to Brian Beamish www.therationalinvestor.com

[RESEARCH] Mean Absolute DeviationHello traders and developers!
I was wondering how built-in "dev" function in Pine is calculated so I made a little research.
I examined 7 samples:
0) "dev" function itself
1) "dev" according to its description: series - sma(series)
2) Mean Absolute Deviation
3) ratio of the absolute difference from 1) divided by period
4) ratio of the difference from 1) divided by period
5) Median Absolute Deviation
6) tricky for-loop to calculate Mean Absolute Deviation
The results of the null and sixth samples are identical.
So, TV built-in "dev" function represents Mean Absolute Deviation and it's description is incorrect.
Where it is used? For example: Commodity Channel Index. You can check its original formula and if you used simple standard deviation instead of MAD in your CCIs - well guys, you were wrong.
Good luck!

MCI and VCI - Modified CCI FormulasFor private peeps only
- Takes a modified version of the CCI formula into 2 parts
VCI - Volume Channel Index (Yellow Histogram)
- Measures accurate accumulation and distribution levels and times
MCI - Modified Channel Index
- Measures (when compared to VCI) levels where clearly buys are interested vs not interested.
Example:
If VCI > MCI
- Shows buyer's are more than interested in buying, you've either hit a bottom or heavy resistance
if MCI > VCI
- Show's buyer's aren't interested and will most likely result in a dump/lower price
Great for monitoring accumulation and distribution, these auto buy and sells look for the transition points over 0, works on EVERY commodity/stock/FOREX/Crypto
Results are from trading 1 BTC x25 leveraging. Not all trades will get in if put in at limit, but it does survive with profits after the massive 0.075 fee (results shown are after fees)

Mean Reversion and Momentum - Updated with gaussiana smoothingMean Reversion and Momentum
Interpretation:
- Divergence means trend reversal
- Parallel movement means trend continuation
Squares above serve as a confirming signal

Mean Reversion and Momentum - Indicator versionMean Reversion and Momentum
Interpretation:
- Divergence means trend reversal
- Parallel movement means trend continuation
Squares above serve as a confirming signal
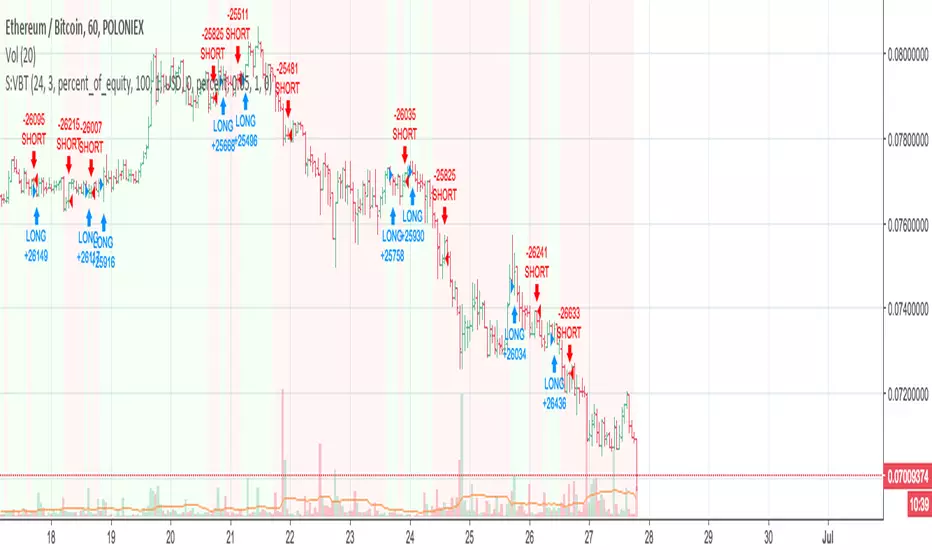
Nick's Momentum Trading Strategy - Beats Buy and Hold manifolds!This script works on the principle of short-term mean reversion and long term trend following, and uses minimal parameters to ensure no overfitting.
The scripts beats buy and hold for almost all major pairs that satisfy the following conditions:
- are trading on multiple exchanges as either ALTBTC or ALTUSD pairs
- have good volume available with them
- have an established history - (try not to use this script with really new pairs)
To run the script, follow these rules:
- script should be run on ALTBTC pair
- set first parameter such that when multiplied with resolution of chart, we get a whole day/week/month, etc. e.g. for a '4H' chart, set this to multiples of 6. The reason being that most algorithmic rebalancing in cryptosphere happens at these times, and we want to make effective use of this.
- set second parameter in the range of 1-6 - this is the smoothing factor (ema) we want to apply to our indicator (governed by our first parameter) - more smoothing = lesser trades. See what works for you.
- Last parameter is a filter condition. Just check/uncheck it once to see if market works better with this on or off.
- If script does not beat buy and hold on this pair (rarely), don't use script on this pair at all.
Access available only to friends. I do code trading strategies on request - so, let me know if you have a good set of rules to create a strategy.
Moving Average Mean Reversion StrategyA basic mean-reversion strategy. Shorts when the close is 10% above the MA, and goes long when it's 10% below the MA.