Stalonte EMA - Stable Long-Term EMA with AlertsStalonte EMA - The Adaptive & Stable EMA - Almost Eternal
Here's why you will love "Stalonte":
The Stalonte (Stable Long-Term EMA) is a highly versatile trend-following tool. Unlike standard EMAs with fixed periods, it uses a configurable smoothing constant (alpha), allowing traders to dial in the exact level of responsiveness and stability they need. Finding the "sweet spot" (e.g., alpha ~0.03) creates a uniquely effective moving average: it is smooth enough to filter out noise and identify safe, high-probability trends, yet responsive enough to provide actionable signals without extreme lag. It includes alerts for crossovers and retests.
Pros and Cons of the Stalonte EMA
Pros:
Unparalleled Adaptability: This is its greatest strength. The alpha input lets you seamlessly transform the indicator from an ultra-slow "trend-revealer" (low alpha) into a highly effective and "safe" trend-following tool (medium alpha, e.g., 0.03), all the way to a more reactive one.
Optimized for Safety & Signal Quality: As you astutely pointed out, with the proper setting (like 0.03), it finds the perfect balance. It provides a smoother path than a standard 20-50 period EMA, which reduces whipsaws and false breakouts, leading to safer, higher-confidence signals.
Superior Trend Visualization: It gives a cleaner and more intuitive representation of the market's direction than many conventional moving averages, making it easier to "see" the trend and stick with it.
Objective Dynamic Support/Resistance: The line created with a medium alpha setting acts as a powerful dynamic support in uptrends and resistance in downtrends, offering excellent areas for entries on retests with integrated alerts.
Cons:
Requires Calibration: The only "con" is that its performance is not plug-and-play; it requires the user to find their optimal alpha value for their specific trading style and the instrument they are trading. This demands a period of testing and customization, which a standard 50-period EMA does not.
Conceptual Hurdle: For traders only familiar with period-based EMAs, the concept of a "smoothing constant" can be initially confusing compared to simply setting a "length."
In summary:
The Stalonte EMA is not a laggy relic. It is a highly sophisticated and adaptable tool. Its design allows for precise tuning, enabling a trader to discover a setting that offers a superior blend of stability and responsiveness—a "sweet spot" that provides safer and often more effective signals than many traditional moving averages. Thank you for pushing for a more accurate and fair assessment.
Use Case Example:
You can combine it with classical EMAs to find the perfect entry.
Moving
HMA super trade by @arkancapMulti-HMA with five customizable moving averages: visual colors, transparency via picker, flexible line styles, and label/alert for HMA50↔HMA100 crossovers. Lightweight, readable, and ready for trading templates.
Мульти-HMA с пятью настраиваемыми скользящими: визуальные цвета, прозрачность через пикер, гибкие стили линий и метка/алерт для пересечений HMA50↔HMA100. Лёгкий, читабельный и готовый к торговым шаблонам.
Five Hull moving averages that show the trend and indicate key crossovers. Customize colors, thickness, and get accurate alerts. Suitable for scalping and multi-timeframes. Support for filling between moving averages to visually highlight areas of strength or weakness.
Пять Hull-скользящих, которые показывают тренд и подсказывают ключевые пересечения. Настраивай цвета, толщину и получай аккуратные алерты. Подходит для скальпа и мульти-таймфрейма. Поддержка заливки между скользящими для наглядного выделения зон силы или слабости.

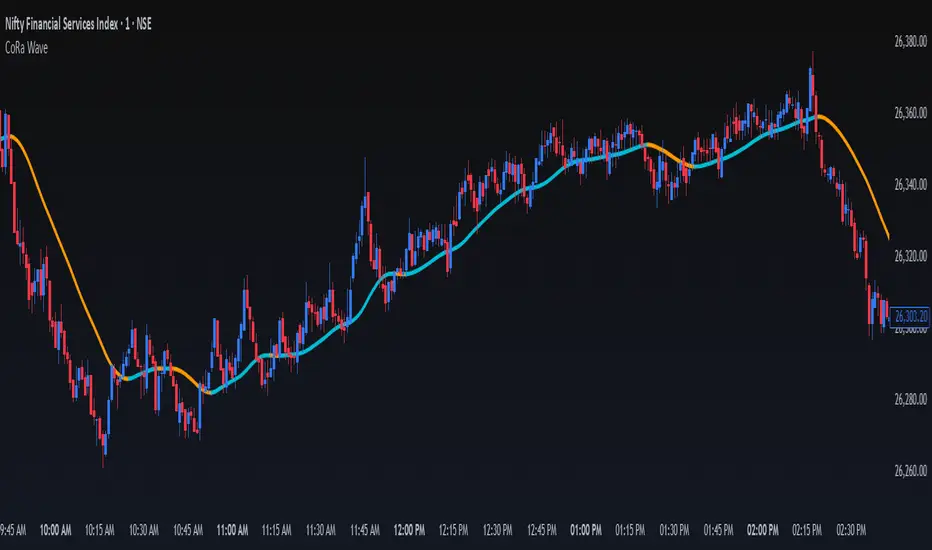
ConeWave MACoRa Wave is a custom-weighted moving average designed to adapt intelligently to market dynamics. It builds upon the foundational logic of the Comp_Ratio_MA by @redktrader, incorporating a compound ratio-based weighting curve that emphasizes recent price action while preserving smoothness and structure with pinescript version 6.
This version introduces modular enhancements, including:
A Comp Ratio Multiplier for fine-tuned responsiveness
Optional Auto Smoothing based on wave length
Streamlined plotting for clarity and performance
Whether you're confirming market structure, identifying trend shifts, or seeking a cleaner alternative to noisy indicators, CoRa Wave offers a visually intuitive and mathematically elegant solution.
🛠 Reimagined by @atulgalande75 — optimized for traders who value precision, adaptability, and clean charting. Original concept by @redktrader.
Triple EMA with Alert | 21, 50, 200 EMA Strategy + Crossover🚀 Boost your trading edge with the Triple EMA with Alert — a professional-grade indicator designed for traders who want precise, real-time trend confirmation across short, medium, and long-term market movements.
🔹 What Makes This Indicator Powerful?
Three Adjustable EMAs — Default: 21, 50, 200 periods (fully customizable 1–200).
Toggle Visibility — Show only the EMAs you need for your strategy.
Real-Time Alerts — Get notified instantly when:
EMA 1 crosses EMA 2 → short-term trend change.
EMA 2 crosses EMA 3 → medium-term trend alignment.
Works on All Markets & Timeframes — Forex, crypto, stocks, indices, and commodities.
🔹 Why Traders Love It
📊 Multi-Timeframe Trend Confirmation — Filter out noise and trade with market momentum.
🎯 Accurate Crossover Signals — Identify bullish and bearish momentum shifts.
🔔 Hands-Free Monitoring — Alerts keep you informed even when you’re away from the chart.
💡 Versatile for Any Strategy — Perfect for scalping, swing trading, or long-term investing.
🔹 How to Use It
Bullish Signal — EMA 1 crossing above EMA 2 or EMA 2 crossing above EMA 3.
Bearish Signal — EMA 1 crossing below EMA 2 or EMA 2 crossing below EMA 3.
Combine with support/resistance zones, RSI, or volume for higher probability trades.
📌 Pro Tip:
Use EMA 21 & EMA 50 for momentum confirmation.
Use EMA 200 to spot the overall market direction.
If you’re serious about trend trading with precision, the Triple EMA with Alert will keep you one step ahead of market moves — no more missed entries or exits.

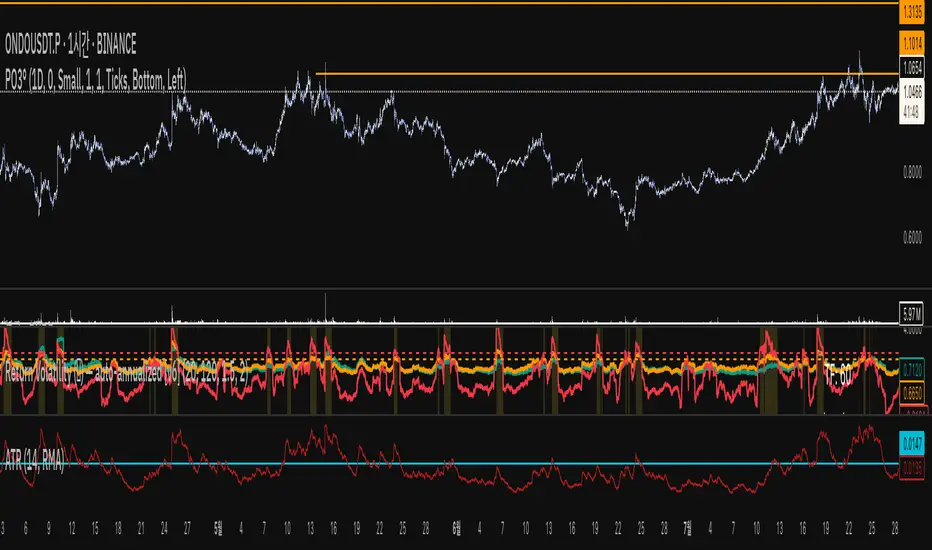
Return Volatility (σ) — auto-annualized [v6]Overview
This indicator calculates and visualizes the return-based volatility (standard deviation) of any asset, automatically adjusting for your chart's timeframe to provide both absolute and annualized volatility values.
It’s designed for traders who want to filter trades, adjust position sizing, and detect volatility events based on statistically significant changes in market activity.
Key Features
Absolute Volatility (abs σ%) – Standard deviation of returns for the current timeframe (e.g., 1H, 4H, 1D).
Annualized Volatility (ann σ%) – Converts abs σ% into an annualized figure for easier cross-timeframe and cross-asset comparison.
Relative Volatility (rel σ) – Ratio of current volatility to the long-term average (default: 120 periods).
Z-Score – Number of standard deviations the current volatility is above or below its historical average.
Auto-Timeframe Adjustment – Detects your chart’s bar size (seconds per bar) and calculates bars/year automatically for crypto’s 24/7 market.
Highlight Mode – Optional yellow background when volatility exceeds set thresholds (rel σ ≥ threshold OR z-score ≥ threshold).
Alert Conditions – Alerts trigger when relative volatility or z-score exceed defined limits.
How It Works
Return Calculation
Log returns: ln(Pt / Pt-1) (default)
or Simple returns: (Pt / Pt-1) – 1
Volatility Measurement
Standard deviation of returns over the lookback period N (default: 20 bars).
Absolute volatility = σ × 100 (% per bar).
Annualization
Uses: σₐₙₙ = σ × √(bars/year) × 100 (%)
Bars/year auto-calculated based on timeframe:
1H = 8,760 bars/year
4H ≈ 2,190 bars/year
1D = 365 bars/year
Relative and Statistical Context
Relative σ = Current σ / Historical average σ (baseLen, default: 120)
Z-score = (Current σ – Historical average σ) / Std. dev. of σ over baseLen
Trading Applications
Volatility Filter – Only allow trade entries when volatility exceeds historical norms (trend traders often benefit from this).
Risk Management – Reduce position size during high volatility spikes to manage risk; increase size in low-volatility trending environments.
Market Scanning – Identify assets with the highest relative volatility for momentum or breakout strategies.
Event Detection – Highlight significant volatility surges that may precede large moves.
Suggested Settings
Lookback (N): 20 bars for short/medium-term trading.
Base Length (M): 120 bars to establish long-term volatility baseline.
Relative Threshold: 1.5× baseline σ.
Z-score Threshold: ≥ 2.0 for statistically significant volatility shifts.
Use Log Returns: Recommended for more consistent scaling across prices.
Notes & Limitations
Volatility measures movement magnitude, not direction. Combine with trend or momentum filters for directional bias.
Very low volatility may still produce false breakouts; combine with volume and market structure analysis.
Crypto markets trade 24/7 — annualization assumes no market closures; adjust for other asset classes if needed.
💡 Best Practice: Use this indicator as a pre-trade filter for breakout or trend-following strategies, or as a risk control overlay in mean-reversion systems.
Multi Averages - CustomizableThis script adds up to 5 moving averages to your plot!
Both type and length are customizable.

Simple 5 Moving Averages 5 MAs - Shubhashish DixitEnjoy the 5 Moving Average to Support your analysis deeper

Zone Shift [ChartPrime]⯁ OVERVIEW
Zone Shift is a dynamic trend detection tool that uses EMA/HMA-based bands to determine trend shifts and plot key reaction levels. It highlights trend direction through colored candles and marks important retests with visual cues to help traders stay aligned with momentum.
⯁ KEY FEATURES
Dynamic EMA-HMA Band:
Creates a three-line channel using the average of an EMA and HMA for the midline, and expands it using average candle range to form upper and lower bounds. This band visually adapts to market volatility.
float ema = ta.ema(close, length)
float hma = ta.hma(close, length-40)
float dist = ta.sma(high-low, 200)
float mid = math.avg(ema, hma)
float top = mid + dist
float bot = mid - dist
Trend Detection (Band Cross Logic):
Detects an uptrend when the Low crosses above the top band.
Detects a downtrend when the High crosses below the bottom band.
Bars change color to lime for uptrends and blue for downtrends.
Trend Initiation Level:
At the start of a new trend, the indicator locks in the extreme point (low for uptrend, high for downtrend) and plots a dashed horizontal level, serving as a potential retest zone.
Trend Retest Signal:
If price crosses back over the Trend Initiation level in the direction of the trend, a diamond label (⯁) is plotted at the retest point — confirming that price is revisiting a key shift level.
Visual Band Layout:
Midline: Dashed line shows the average of EMA and HMA.
Top/Bottom: Solid lines showing dynamic thresholds above/below the midline.
These help visualize compression, expansion, and possible breakout zones.
Color-Based Candle Plotting:
Candles are recolored in real time according to the current trend, allowing instant visual alignment with the market’s directional bias.
Noise-Filtered Retests:
To avoid repetitive signals, retests are only marked if they occur more than 5 bars after the previous one — filtering out minor fluctuations.
⯁ USAGE
Use colored candles to align trades with the dominant trend.
Treat dashed trendStart levels as important support/resistance zones.
Watch for ⯁ diamond labels as confirmation of retests for continuation or entry.
Use band boundaries to assess trend strength and volatility expansion.
Combine with your existing setups to validate momentum and zone shifts.
⯁ CONCLUSION
Zone Shift helps traders visually capture trend changes and key reaction points with precision. By combining band breakouts with real-time retest signals and trend-colored candles, this tool simplifies the process of reading market structure shifts and identifying high-confluence entry areas.

Moving Average Exponential (Daily Frozen EMA)This script plots an Exponential Moving Average (EMA) based on the daily timeframe, but with a unique twist:
✅ The EMA value is frozen for the entire current daily session, only updating when a new daily candle begins.
🔍 How it works:
The EMA is calculated using the 1-day timeframe, regardless of the chart's current timeframe.
This EMA value remains fixed throughout the day — it doesn't fluctuate intrabar.
It updates only once the daily candle has closed, providing a stable and reliable reference point during the trading day.
The default is the 5 day EMA but can be changed to any EMA timeframe you desire such as 9, 21, 50, 100. 200, etc.
✨ Additional Features:
✅ Optional smoothing with various moving average types (SMA, EMA, WMA, SMMA, VWMA).
✅ Optional Bollinger Bands on top of the smoothed EMA.
✅ Adjustable settings for EMA length, smoothing type, Bollinger Band deviation, and display options.
🛠️ Use Cases:
Ideal for traders who want a non-reactive EMA during intraday trading.
Helps reduce signal noise by anchoring EMA to higher timeframe structure.
Useful for strategy development where EMA should represent confirmed daily bias only.
Hope this helps, happy trading!

Quad Rotation StochasticQuad Rotation Stochastic
The Quad Rotation Stochastic is a powerful and unique momentum oscillator that combines four different stochastic setups into one tool, providing an incredibly detailed view of market conditions. This multi-timeframe stochastic approach helps traders better anticipate trend continuations, reversals, and momentum shifts with greater precision than traditional single stochastic indicators.
Why this indicator is useful:
Multi-layered Momentum Analysis: Instead of relying on one stochastic, this script tracks four independent stochastic readings, smoothing out noise and confirming stronger signals.
Advanced Divergence Detection: It automatically identifies bullish and bearish divergences for each stochastic, helping traders spot potential reversals early.
Background Color Alerts: When a configurable number (e.g., 3 or 4) of the stochastics agree in direction and position (overbought/oversold), the background colors green (bullish) or red (bearish) to give instant visual cues.
ABCD Pattern Recognition: The script recognizes "shield" patterns when Stochastic 4 remains stuck at extreme levels (above 90 or below 10) for a set time, warning of potential trend continuation setups.
Super Signal Alerts: If all four stochastics align in extreme conditions and slope in the same direction, the indicator plots a special "Super Signal," offering high-confidence entry opportunities.
Why this indicator is unique:
Quad Confirmation Logic: Combining four different stochastics makes this tool much less prone to false signals compared to using a single stochastic.
Customizable Divergence Coloring: Traders can choose to have divergence lines automatically match the stochastic color for clear visual association.
Adaptive ABCD Shields: Innovative use of bar counting while a stochastic remains extreme acts as a "shield," offering a unique way to filter out minor fake-outs.
Flexible Configuration: Each stochastic's sensitivity, divergence settings, and visual styling can be fully customized, allowing traders to adapt it to their own strategy and asset.
Example Usage: Trading Bitcoin with Quad Rotation Stochastic
When trading Bitcoin (BTCUSD), you might set the minimum count (minCount) to 3, meaning three out of four stochastics must be in agreement to trigger a background color.
If the background turns green, and you notice an ABCD Bullish Shield (Green X), you might look for bullish candlestick patterns or moving average crossovers to enter a long trade.
Conversely, if the background turns red and a Super Down Signal appears, it suggests high probability for further downside, giving you strong confirmation to either short BTC or avoid entering new longs.
By combining divergence signals with background colors and the ABCD shields, the Quad Rotation Stochastic provides a layered confirmation system that gives traders greater confidence in their entries and exits — particularly in fast-moving, volatile markets like Bitcoin.

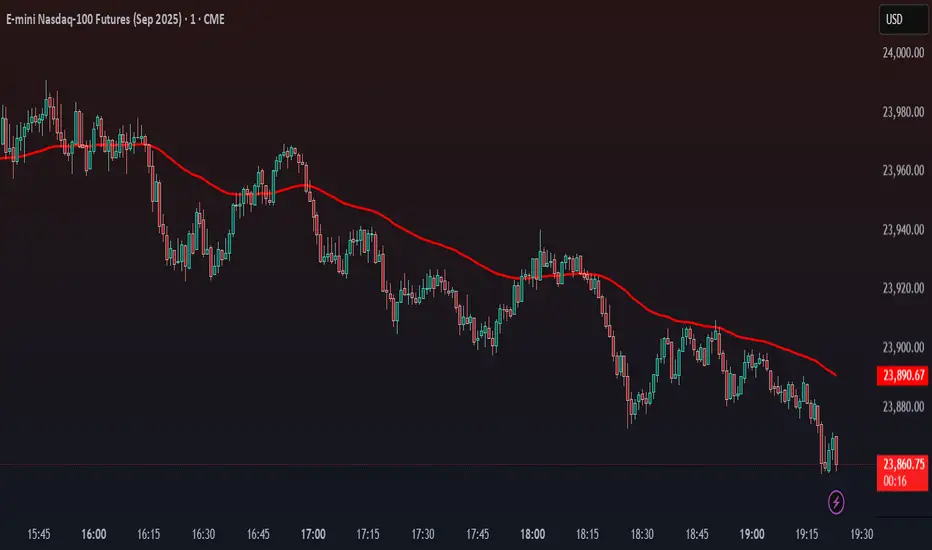
HL2 Moving Average with BandsThis indicator is designed to assist traders in identifying potential trade entries and exits for S&P 500 (ES) and Nasdaq-100 (NQ) futures. It calculates a Simple Moving Average (SMA) based on the HL2 value (average of high and low prices) of the current candle over a user-defined lookback period (default: 200 periods). The indicator plots this SMA as a blue line, providing a smoothed reference for price trends.
Additionally, it includes upper and lower bands calculated as a percentage (default: 0.5%) above and below the SMA, plotted as green and red lines, respectively. These bands act as dynamic thresholds to identify overbought or oversold conditions. The indicator generates trade signals based on price action relative to these bands:
Long Entry: A green upward triangle is plotted below the candle when the close crosses above the upper band, signaling a potential buy.
Close Long: A red square is plotted above the candle when the close crosses back below the upper band, indicating an exit for the long position.
Short Entry: A red downward triangle is plotted above the candle when the close crosses below the lower band, signaling a potential sell.
Close Short: A green square is plotted below the candle when the close crosses back above the lower band, indicating an exit for the short position.
The script is customizable, allowing users to adjust the SMA length and band percentage to suit their trading style or market conditions. It is plotted as an overlay on the price chart for easy integration with other technical analysis tools.
Recommended Time Frame and Settings for Trading S&P 500 and Nasdaq-100 Futures
Based on research and market dynamics for S&P 500 (ES) and Nasdaq-100 (NQ) futures, the 5-minute chart is recommended as the optimal time frame for day trading with this indicator. This time frame strikes a balance between capturing intraday trends and filtering out excessive noise, which is critical for futures trading due to their high volatility and leverage. The 5-minute chart aligns well with periods of high liquidity and volatility, such as the U.S. market open (9:30 AM–11:00 AM EST) and the afternoon session (2:00 PM–4:00 PM EST), when institutional traders are most active.
Why 5-minute? It allows traders to react to short-term price movements while avoiding the rapid fluctuations of 1-minute charts, which can be prone to false signals in choppy markets. It also provides enough data points to make the SMA and bands meaningful without the lag associated with longer time frames like 15-minute or hourly charts.
Recommended Settings
SMA Length: Set to 200 periods. This longer lookback period smooths the HL2 data, reducing noise and providing a reliable trend reference for the 5-minute chart. A 200-period SMA helps identify significant trend shifts without being overly sensitive to minor price fluctuations.
Band Percentage: 0.5% is more suitable for the volatility of ES and NQ futures on a 5-minute chart, as it generates fewer but higher-probability signals. Wider bands (e.g., 1%) may miss short-term opportunities, while narrower bands (e.g., 0.1%) may produce excessive false signals.
Trading Session Recommendations
Futures markets for ES and NQ are open nearly 24 hours (Sunday 6:00 PM EST to Friday 5:00 PM EST, with a daily break from 4:00 PM–5:00 PM EST), but not all hours are equally optimal due to varying liquidity and volatility. The best times to trade with this indicator are:
U.S. Market Open (9:30 AM–11:00 AM EST): This period is characterized by high volume and volatility, driven by the opening of U.S. equity markets and economic data releases (e.g., 8:30 AM EST reports like CPI or GDP). The indicator’s signals are more reliable during this window due to strong order flow and price momentum.
Afternoon Session (2:00 PM–4:00 PM EST): After the lunchtime lull, volume picks up as institutional traders return, and news or FOMC announcements often drive price action. The indicator can capture breakout moves as prices test the upper or lower bands.
Pre-Market (7:30 AM–9:30 AM EST): For traders comfortable with lower liquidity, this period can offer opportunities, especially around 8:30 AM EST economic releases. However, use tighter risk management due to wider spreads and potential volatility spikes.
Additional Tips
Avoid Low-Volume Periods: Steer clear of trading during low-liquidity hours, such as the overnight session (11:00 PM–3:00 AM EST), when spreads widen and price movements can be erratic, leading to false signals from the indicator.
Combine with Other Tools: Enhance the indicator’s effectiveness by pairing it with support/resistance levels, Fibonacci retracements, or volume analysis to confirm signals. For example, a long entry signal above the upper band is stronger if it coincides with a breakout above a key resistance level.
Risk Management: Given the leverage in futures (e.g., Micro E-mini contracts require ~$1,200 margin for ES), use tight stop-losses (e.g., below the lower band for longs or above the upper band for shorts) to manage risk. Aim for a risk-reward ratio of at least 1:2.
Test Settings: Backtest the indicator on a demo account to optimize the SMA length and band percentage for your specific trading style and risk tolerance. Micro E-mini contracts (MES for S&P 500, MNQ for Nasdaq-100) are ideal for testing due to their lower capital requirements.
Why These Settings and Time Frame?
The 5-minute chart with a 200-period SMA and 0.5% bands is tailored for the volatility and liquidity of ES and NQ futures during peak trading hours. The longer SMA period ensures the indicator captures meaningful trends, while the 0.5% bands are tight enough to signal actionable breakouts but wide enough to avoid excessive whipsaws. Trading during high-volume sessions maximizes the likelihood of valid signals, as institutional participation drives clearer price action.
By focusing on these settings and time frames, traders can leverage the indicator to capitalize on the dynamic price movements of S&P 500 and Nasdaq-100 futures while managing the inherent risks of these markets.

AllMA Trend Radar [trade_lexx]📈 AllMA Trend Radar is your universal trend analysis tool!
📊 What is AllMA Trend Radar?
AllMA Trend Radar is a powerful indicator that uses various types of Moving Averages (MA) to analyze trends and generate trading signals. The indicator allows you to choose from more than 30 different types of moving averages and adjust their parameters to suit your trading style.
💡 The main components of the indicator
📈 Fast and slow moving averages
The indicator uses two main lines:
- Fast MA (blue line): reacts faster to price changes
- Slow MA (red line): smoother, reflects a long-term trend
The combined use of fast and slow MA allows you to get trend confirmation and entry/exit points from the market.
🔄 Wide range of moving averages
There are more than 30 types of moving averages at your disposal:
- SMA: Simple moving average
- EMA: Exponential moving average
- WMA: Weighted moving average
- DEMA: double exponential MA
- TEMA: triple exponential MA
- HMA: Hull Moving Average
- LSMA: Moving average of least squares
- JMA: Eureka Moving Average
- ALMA: Arnaud Legoux Moving Average
- ZLEMA: moving average with zero delay
- And many others!
🔍 Indicator signals
1️⃣ Fast 🆚 Slow MA signals (intersection and ratio of fast and slow MA)
Up/Down signals (intersection)
- Buy (Up) signal:
- What happens: the fast MA crosses the slow MA from bottom to top
- What does the green triangle with the "Buy" label under the candle look
like - What does it mean: a likely upward trend reversal or an uptrend strengthening
- Sell signal (Down):
- What happens: the fast MA crosses the slow MA from top to bottom
- What does it look like: a red triangle with a "Sell" mark above the candle
- What does it mean: a likely downtrend reversal or an increase in the downtrend
Greater/Less signals (ratio)
- Buy signal (Greater):
- What happens: the fast MA becomes higher than the slow MA
- What does it look like: a green triangle with a "Buy" label under the candle
- What does it mean: the formation or confirmation of an uptrend
- Sell signal (Less):
- What happens: the fast MA becomes lower than the slow MA
- What does it look like: a red triangle with a "Sell" mark above the candle
- What does it mean: the formation or confirmation of a downtrend
2️⃣ Signals ⚡️ Fast MA (fast MA and price)
Up/Down signals (intersection)
- Buy signal (Up Fast):
- What happens: the price crosses the fast MA from bottom to top
- What does it look like: a green triangle with a "Buy" label under the candle
- What does it mean: a short-term price growth signal
- Sell signal (Down Fast):
- What happens: the price crosses the fast MA from top to bottom
- What does it look like: a red triangle with a "Sell" label above the candle
- What does it mean: a short-term price drop signal
Greater/Less signals (ratio)
- Buy signal (Greater Fast):
- What happens: the price is getting higher than the fast MA
- What does it look like: a green triangle with a "Buy" label under the candle
- What does it mean: the price is above the fast MA, which indicates an upward movement
- Sell signal (Less Fast):
- What happens: the price is getting lower than the fast MA
- What does it look like: a red triangle with a "Sell" mark above the candle
- What does it mean: the price is under the fast MA, which indicates a downward movement
3️⃣ Signals 🐢 Slow MA (slow MA and price)
Up/Down signals (intersection)
- Buy signal (Up Slow):
- What happens: the price crosses the slow MA from bottom to top
- What does it look like: a green triangle with a "Buy" label under the candle
- What does it mean: a potential medium-term upward trend reversal
- Sell signal (Down Slow):
- What happens: the price crosses the slow MA from top to bottom
- What does it look like: a red triangle with a "Sell" label above the candle
- What does it mean: a potential medium-term downward trend reversal
Greater/Less signals (ratio)
- Buy signal (Greater Slow):
- What happens: the price is getting above the slow MA
- What does it look like: a green triangle with a "Buy" label under the candle
- What does it mean: the price is above the slow MA, which indicates a strong upward movement
- Sell signal (Less Slow):
- What is happening: the price is getting below the slow MA
- What does it look like: a red triangle with a "Sell" mark above the candle
- What does it mean: the price is under the slow MA, which indicates a strong downward movement
🛠 Filters to filter out false signals
1️⃣ Minimum distance between the signals
- What it does: sets the minimum number of candles between signals of the same type
- Why it is needed: it prevents the appearance of too frequent signals, especially during periods of high volatility
- How to set it up: Set a different value for each signal type (default: 3-5 bars)
- Example: if the value is 3 for Up/Down signals, after the buy signal appears, the next buy signal may appear no earlier than 3 bars later
2️⃣ Advanced indicator filters
🔍 RSI Filter
- What it does: Checks the Relative Strength Index (RSI) value before generating a signal
- Why it is needed: it helps to avoid countertrend entries and catch reversal points
- How to set up:
- For buy signals (🔋 Buy): set the RSI range, usually in the oversold zone (for example, 1-30)
- For sell signals (🪫 Sell): set the RSI range, usually in the overbought zone (for example, 70-100)
- Example: if the RSI = 25 (in the range 1-30), the buy signal will be confirmed
📊 MFI Filter (Cash Flow Index)
- What it does: analyzes volumes and the direction of price movement
- Why it is needed: confirms signals with data on the activity of cash flows
- How to set up:
- For buy signals (🔋 Buy): set the MFI range in the oversold zone (for example, 1-25)
- For sell signals (🪫 Sell): set the MFI range in the overbought zone (for example, 75-100)
- Example: if MFI = 80 (in the range of 75-100), the sell signal will be confirmed
📈 Stochastic Filter
- What it does: analyzes the position of the current price relative to the price range
- Why it is needed: confirms signals based on overbought/oversold conditions
- How to configure:
- You can configure the K Length, D Length and Smoothing parameters
- For buy signals (🔋 Buy): set the stochastic range in the oversold zone (for example, 1-20)
- For sell signals (🪫 Sell): set the stochastic range in the overbought zone (for example, 80-100)
- Example: if stochastic = 15 (is in the range of 1-20), the buy signal will be confirmed
🔌 Connecting to trading strategies
The indicator provides various connectors to connect to your trading strategies.:
1️⃣ Individual connectors for each type of signal
- 🔌Fast vs Slow Up/Down MA Signal🔌: signals for the intersection of fast and slow MA
- 🔌Fast vs Slow Greater/Less MA Signal🔌: signals of the ratio of fast and slow MA
- 🔌Fast Up/Down MA Signal🔌: signals of the intersection of price and fast MA
- 🔌Fast Greater/Less MA Signal🔌: signals of the ratio of price and fast MA
- 🔌Slow Up/Down MA Signal🔌: signals of the intersection of price and slow MA
- 🔌Slow Greater/Less MA Signal🔌: Price versus slow MA signals
2️⃣ Combined connectors
- 🔌Combined Up/Down MA Signal🔌: combines all the crossing signals (Up/Down)
- 🔌Combined Greater/Less MA Signal🔌: combines all the signals of the ratio (Greater/Less)
- 🔌Combined All MA Signals🔌: combines all signals (Up/Down and Greater/Less)
❗️ All connectors return values:
- 1: buy signal
- -1: sell signal
- 0: no signal
📚 How to start using AllMA Trend Radar
1️⃣ Selection of types of moving averages
- Add an indicator to the chart
- Select the type and period for the fast MA (default: DEMA with a period of 14)
- Select the type and period for the slow MA (default: SMA with a period of 14)
- Experiment with different types of MA to find the best combination for your trading style
2️⃣ Signal settings
- Turn on the desired signal types (Up/Down, Greater/Less)
- Set the minimum distance between the signals
- Activate and configure the necessary filters (RSI, MFI, Stochastic)
3️⃣ Checking on historical data
- Analyze how the indicator works based on historical data
- Pay attention to the accuracy of the signals and the presence of false alarms
- Adjust the settings if necessary
4️⃣ Introduction to the trading strategy
- Decide which signals will be used to enter the position.
- Determine which signals will be used to exit the position.
- Connect the indicator to your trading strategy through the appropriate connectors
🌟 Practical application examples
Scalping strategy
- Fast MA: TEMA with a period of 8
- Slow MA: EMA with a period of 21
- Active signals: Fast MA Up/Down
- Filters: RSI (range 1-40 for purchases, 60-100 for sales)
- Signal spacing: 3 bars
Strategy for day trading
- Fast MA: TEMA with a period of 10
- Slow MA: SMA with a period of 20
- Active signals: Fast MA Up/Down and Fast vs Slow Greater/Less
- Filters: MFI (range 1-25 for purchases, 75-100 for sales)
- Signal spacing: 5 bars
Swing Trading Strategy
- Fast MA: DEMA with a period of 14
- Slow MA: VWMA with a period of 30
- Active signals: Fast vs Slow Up/Down and Slow MA Greater/Less
- Filters: Stochastic (range 1-20 for purchases, 80-100 for sales)
- Signal spacing: 8 bars
A strategy for positional trading
- Fast MA: HMA with a period of 21
- Slow MA: SMA with a period of 50
- Active signals: Slow MA Up/Down and Fast vs Slow Greater/Less
- Filters: RSI and MFI at the same time
- The distance between the signals: 10 bars
💡 Tips for using AllMA Trend Radar
1. Select the types of MA for market conditions:
- For trending markets: DEMA, TEMA, HMA (fast MA)
- For sideways markets: SMA, WMA, VWMA (smoothed MA)
- For volatile markets: KAMA, AMA, VAMA (adaptive MA)
2. Combine different types of signals:
- Up/Down signals work better when moving from a sideways trend to a directional
one - Greater/Less signals are optimal for fixing a stable trend
3. Use filters effectively:
- The RSI filter works great in trending markets
- MFI filter helps to confirm the strength of volume movement
- Stochastic filter works well in lateral ranges
4. Adjust the minimum distance between the signals:
- Small values (2-3 bars) for short-term trading
- Average values (5-8 bars) for medium-term trading
- Large values (10+ bars) for long-term trading
5. Use combination connectors:
- For more reliable signals, connect the indicator through the combined connectors
💰 With the AllMA Trend Radar indicator, you get a universal trend analysis tool that can be customized for any trading style and timeframe. The combination of different types of moving averages and advanced filters allows you to significantly improve the accuracy of signals and the effectiveness of your trading strategy!

Win-Loss Streak PlotterWin-Loss Streak Plotter
This indicator tracks the win/loss streaks of moving average crossovers (using simple moving averages for illustration purposes). It calculates the price change after each crossover, marking each as a win (green) or loss (red). The win rate is shown separately.
Inputs:
Source: Price series (default: open)
Fast MA: Fast moving average (default: open)
Slow MA: Slow moving average (default: open)
Total Crosses to Analyze: Number of crossovers to track
Crosses per Row: Number of crossovers per row in the table
Output:
A table displays each crossover’s result (win/loss).
A separate win rate table shows the percentage of wins.
Suggestions are always welcomed!

Moving Average Shift WaveTrend StrategyMoving Average Shift WaveTrend Strategy
🧭 Overview
The Moving Average Shift WaveTrend Strategy is a trend-following and momentum-based trading system designed to be overlayed on TradingView charts. It executes trades based on the confluence of multiple technical conditions—volatility, session timing, trend direction, and oscillator momentum—to deliver logical and systematic trade entries and exits.
🎯 Strategy Objectives
Enter trades aligned with the prevailing long-term trend
Exit trades on confirmed momentum reversals
Avoid false signals using session timing and volatility filters
Apply structured risk management with automatic TP, SL, and trailing stops
⚙️ Key Features
Selectable MA types: SMA, EMA, SMMA (RMA), WMA, VWMA
Dual-filter logic using a custom oscillator and moving averages
Session and volatility filters to eliminate low-quality setups
Trailing stop, configurable Take Profit / Stop Loss logic
“In-wave flag” prevents overtrading within the same trend wave
Visual clarity with color-shifting candles and entry/exit markers
📈 Trading Rules
✅ Long Entry Conditions:
Price is above the selected MA
Oscillator is positive and rising
200-period EMA indicates an uptrend
ATR exceeds its median value (sufficient volatility)
Entry occurs between 09:00–17:00 (exchange time)
Not currently in an active wave
🔻 Short Entry Conditions:
Price is below the selected MA
Oscillator is negative and falling
200-period EMA indicates a downtrend
All other long-entry conditions are inverted
❌ Exit Conditions:
Take Profit or Stop Loss is hit
Opposing signals from oscillator and MA
Trailing stop is triggered
🛡️ Risk Management Parameters
Pair: ETH/USD
Timeframe: 4H
Starting Capital: $3,000
Commission: 0.02%
Slippage: 2 pips
Risk per Trade: 2% of account equity (adjustable)
Total Trades: 224
Backtest Period: May 24, 2016 — April 7, 2025
Note: Risk parameters are fully customizable to suit your trading style and broker conditions.
🔧 Trading Parameters & Filters
Time Filter: Trades allowed only between 09:00–17:00 (exchange time)
Volatility Filter: ATR must be above its median value
Trend Filter: Long-term 200-period EMA
📊 Technical Settings
Moving Average
Type: SMA
Length: 40
Source: hl2
Oscillator
Length: 15
Threshold: 0.5
Risk Management
Take Profit: 1.5%
Stop Loss: 1.0%
Trailing Stop: 1.0%
👁️ Visual Support
MA and oscillator color changes indicate directional bias
Clear chart markers show entry and exit points
Trailing stops and risk controls are transparently managed
🚀 Strategy Improvements & Uniqueness
In-wave flag avoids repeated entries within the same trend phase
Filtering based on time, volatility, and trend ensures higher-quality trades
Dynamic high/low tracking allows precise trailing stop placement
Fully rule-based execution reduces emotional decision-making
💡 Inspirations & Attribution
This strategy is inspired by the excellent concept from:
ChartPrime – “Moving Average Shift”
It expands on the original idea with advanced trade filters and trailing logic.
Source reference:
📌 Summary
The Moving Average Shift WaveTrend Strategy offers a rule-based, reliable approach to trend trading. By combining trend and momentum filters with robust risk controls, it provides a consistent framework suitable for various market conditions and trading styles.
⚠️ Disclaimer
This script is for educational purposes only. Trading involves risk. Always use proper backtesting and risk evaluation before applying in live markets.

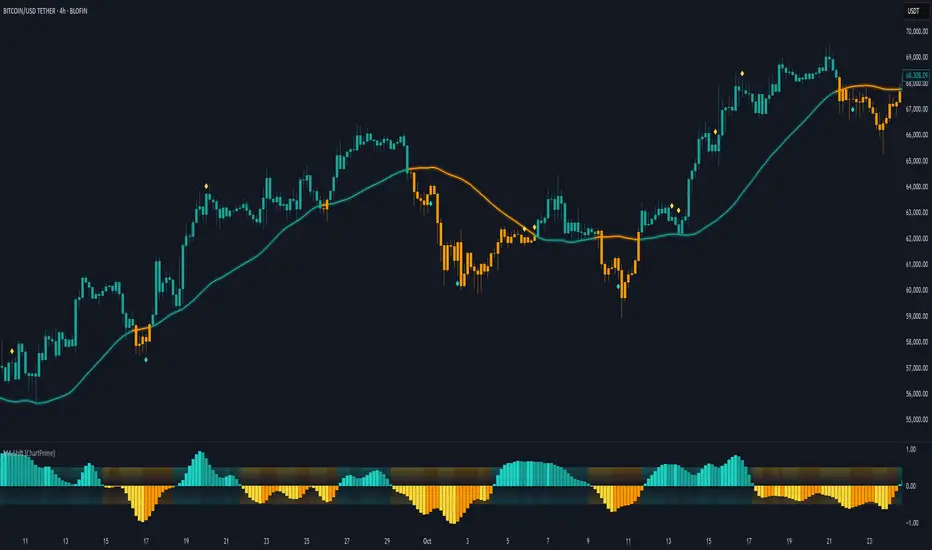
OBVX Conviction Bias🧮 The OBVX Conviction Bias overlay tracks the flow of directional volume using the classic On-Balance Volume calculation, then filters it through a layered moving average system to expose crowd commitment , pressure transitions , and momentum fatigue . The tool applies two smoothed averages to the OBV line—a fast curve and a longer-term baseline scaled using Euler’s constant (2.718)—and visualizes their relationship using a color-coded crossover ribbon and pressure fills. When used correctly, it reveals whether a move is being supported by meaningful volume, or whether the crowd is starting to disengage.
🚦 The core signal compares OBV to its fast moving average. When OBV climbs above the short average, it fills green—suggesting real directional effort. When OBV sinks below, the fill turns maroon—flagging fading conviction or pullback potential. A second fill between the short and long OBV moving averages captures the broader trend of volume intention. If the short is above the long, this space fills greenish, showing constructive pressure. If it flips, the fill fades red, signaling crowd hesitation, rotation, or early exhaustion.
⚖️ All smoothing is user-selectable, defaulting to VWMA for effort-sensitive structure. The long-term average is auto-scaled using the natural exponential multiplier (2.718), offering rhythm that reflects the curve of participation. OBVX Conviction Bias isn’t trying to predict—it’s trying to show you where the crowd is leaning , and whether that lean is gaining traction or losing strength.
🧐 Ideal Use-Cases:
• Detect divergence between volume flow and price action
• Confirm breakout validity with volume alignment
• Fade breakouts where OBV fails to follow through
• Time pullback entries when OBV pressure resumes in trend direction
🍷 Recommended Pairings:
• ZVOL to measure whether volume is statistically significant or just noise (as shown)
• RVOL Effort Matrix to validate crowd effort by tier and structure zone
• SUPeR TReND 2.718 and/or MA Ribbons for directional confluence
• ATR Turbulence to track volatility-phase alignment with volume intention

Moving Average Shift [ChartPrime]Moving Average Shift indicator combines multiple moving average (MA) types with a unique MA Shift Oscillator to help traders visualize trend direction, price deviations, and mean reversion states.
⯁ KEY FEATURES
Customizable Moving Averages: Choose from SMA, EMA, SMMA (RMA), WMA, or VWMA.
Trend-Based Coloring: Candles are dynamically colored based on price position relative to the MA.
MA Shift Oscillator: Identifies price deviations and potential mean reversion zones.
Threshold Filtering: Helps filter mean reversion signals using a user-defined threshold.
Diamond Signals for Mean Reversion: Plots diamonds on the chart when the oscillator crosses back above or below the threshold level.
Oscillator Color Coding: The oscillator has four color states:
Color 1: Above 0 and increasing.
Color 2: Above 0 and decreasing.
Color 3: Below 0 and increasing.
Color 4: Below 0 and decreasing.
⯁ HOW TO USE
Use the indicator to follow the trend based on MA direction and price relation to it.
The MA Shift Oscillator helps identify potential mean reversion points where price may revert toward the MA.
The threshold setting allows traders to filter out weak mean reversion signals and focus on significant shifts.
The four-color oscillator visually indicates trend momentum and potential trend shifts.
⯁ CONCLUSION
The Moving Average Shift indicator is a powerful tool that merges trend-following and mean reversion strategies into one comprehensive system. By allowing traders to select different types of moving averages, it provides flexibility in trend analysis while visually enhancing price action with dynamic candle coloring. The MA Shift Oscillator further strengthens decision-making by detecting deviations and highlighting potential mean reversion points.
Flow Optimized Moving AverageOverview
The Flow Optimized Moving Average (Flow OMA) is an advanced adaptive moving average designed to dynamically adjust smoothing factors based on market efficiency and volatility. By integrating the Efficiency Ratio (ER) with an Adaptive Moving Average (AMA) and leveraging ATR-based bands, this indicator provides traders with a refined tool for identifying trend direction, strength, and potential reversal zones.
Key Features
Adaptive Moving Average (AMA)
Adjusts to price action based on the Efficiency Ratio (ER), reducing lag in trending markets while smoothing noise in ranging conditions.
Efficiency Ratio (ER)
Measures the effectiveness of price movement over a defined lookback period.
Helps in dynamically adjusting the smoothing constant of the AMA.
ATR-Based Volatility Bands
Creates upper and lower dynamic bands based on the Average True Range (ATR).
Expands in high volatility and contracts in low volatility, providing traders with a contextual understanding of price action.
Slope-Based Trend Strength
Normalizes the moving average slope relative to ATR.
Generates a trend strength score, which influences band opacity, making strong trends visually distinguishable.
Dynamic Color Coding
Bullish Trends: Cyan/Turquoise (#00e2ff)
Bearish Trends: Blue (#003ff5)
Neutral Trends: Gray
The transparency of the bands dynamically adjusts based on trend strength.
Fill Zone Effect
The area between the ATR bands is filled with a gradient-like effect, giving a clear visual representation of trend strength and transitions.
Indicator Components
Inputs (User Settings)
ER Lookback Period: Defines how many bars are used in the Efficiency Ratio calculation (default: 10).
Fast & Slow Periods: Control the sensitivity of the Adaptive Moving Average (default: 2 & 30).
ATR Period: Defines the lookback for Average True Range (default: 14).
Band Multiplier: Determines the width of ATR-based bands (default: 1.5).
Slope Average Period: Smooths trend slope for more stable trend assessment (default: 5).
Efficiency Ratio Calculation
Measures how effectively price moves in a straight line compared to its total movement.
A higher ER value suggests strong trend momentum, while a lower value implies consolidation.
Adaptive Moving Average (AMA)
Dynamically adjusts its smoothing factor based on ER.
Uses a smoothing constant that ranges between the fastest and slowest specified values.
Volatility-Based Bands
Constructed using the ATR multiplier.
Expand and contract dynamically in response to market volatility.
Trend Strength & Direction
Computed using the normalized slope of AMA against ATR.
Positive slope = Bullish trend, Negative slope = Bearish trend.
Visual Enhancements
Colored Adaptive MA Line: Changes based on trend direction.
ATR Bands with Gradient Fill: Visual representation of market conditions.
Dynamic Opacity: Highlights trend strength through transparency.
How to Use the Flow OMA Indicator
Trend Identification
When the Adaptive MA is rising and colored cyan, a bullish trend is in play.
When the Adaptive MA is falling and colored blue, a bearish trend is present.
Trend Strength Assessment
A stronger trend results in more opaque band fills, indicating a clear directional bias.
Weaker trends or consolidations result in fainter fills, signaling a loss of momentum.
Reversal Signals
If price touches the upper band in a bullish move and starts reversing, it can indicate potential profit-taking areas.
If price approaches the lower band in a bearish move and rebounds, a short-term reversal may be imminent.
Volatility Insights
Narrow bands indicate low volatility and possible breakout conditions.
Wider bands suggest increased volatility, warning traders of potential price swings.
Best Practices
✅ Combine with Other Indicators
Use RSI, MACD, or Volume Profile for confirmation before executing trades.
✅ Apply to Multiple Timeframes
Works effectively in higher timeframes (1H, 4H, Daily) for trend trading.
Can be utilized in lower timeframes (5m, 15m) for scalping setups.
✅ Adjust Parameters Based on Asset Volatility
Increase ATR Period for stocks with high volatility.
Reduce ATR Multiplier for forex pairs to avoid excessive band width.
The Flow Optimized Moving Average (Flow OMA) is a powerful trend-following tool designed for both swing and intraday traders. Its adaptive nature allows it to efficiently track trends while minimizing false signals. By incorporating dynamic volatility bands and trend-sensitive color coding, this indicator enhances traders' ability to read price action effectively. Whether used standalone or in combination with other indicators, Flow OMA provides a significant edge in trend analysis.

MTF Signal XpertMTF Signal Xpert – Detailed Description
Overview:
MTF Signal Xpert is a proprietary, open‑source trading signal indicator that fuses multiple technical analysis methods into one cohesive strategy. Developed after rigorous backtesting and extensive research, this advanced tool is designed to deliver clear BUY and SELL signals by analyzing trend, momentum, and volatility across various timeframes. Its integrated approach not only enhances signal reliability but also incorporates dynamic risk management, helping traders protect their capital while navigating complex market conditions.
Detailed Explanation of How It Works:
Trend Detection via Moving Averages
Dual Moving Averages:
MTF Signal Xpert computes two moving averages—a fast MA and a slow MA—with the flexibility to choose from Simple (SMA), Exponential (EMA), or Hull (HMA) methods. This dual-MA system helps identify the prevailing market trend by contrasting short-term momentum with longer-term trends.
Crossover Logic:
A BUY signal is initiated when the fast MA crosses above the slow MA, coupled with the condition that the current price is above the lower Bollinger Band. This suggests that the market may be emerging from a lower price region. Conversely, a SELL signal is generated when the fast MA crosses below the slow MA and the price is below the upper Bollinger Band, indicating potential bearish pressure.
Recent Crossover Confirmation:
To ensure that signals reflect current market dynamics, the script tracks the number of bars since the moving average crossover event. Only crossovers that occur within a user-defined “candle confirmation” period are considered, which helps filter out outdated signals and improves overall signal accuracy.
Volatility and Price Extremes with Bollinger Bands
Calculation of Bands:
Bollinger Bands are calculated using a 20‑period simple moving average as the central basis, with the upper and lower bands derived from a standard deviation multiplier. This creates dynamic boundaries that adjust according to recent market volatility.
Signal Reinforcement:
For BUY signals, the condition that the price is above the lower Bollinger Band suggests an undervalued market condition, while for SELL signals, the price falling below the upper Bollinger Band reinforces the bearish bias. This volatility context adds depth to the moving average crossover signals.
Momentum Confirmation Using Multiple Oscillators
RSI (Relative Strength Index):
The RSI is computed over 14 periods to determine if the market is in an overbought or oversold state. Only readings within an optimal range (defined by user inputs) validate the signal, ensuring that entries are made during balanced conditions.
MACD (Moving Average Convergence Divergence):
The MACD line is compared with its signal line to assess momentum. A bullish scenario is confirmed when the MACD line is above the signal line, while a bearish scenario is indicated when it is below, thus adding another layer of confirmation.
Awesome Oscillator (AO):
The AO measures the difference between short-term and long-term simple moving averages of the median price. Positive AO values support BUY signals, while negative values back SELL signals, offering additional momentum insight.
ADX (Average Directional Index):
The ADX quantifies trend strength. MTF Signal Xpert only considers signals when the ADX value exceeds a specified threshold, ensuring that trades are taken in strongly trending markets.
Optional Stochastic Oscillator:
An optional stochastic oscillator filter can be enabled to further refine signals. It checks for overbought conditions (supporting SELL signals) or oversold conditions (supporting BUY signals), thus reducing ambiguity.
Multi-Timeframe Verification
Higher Timeframe Filter:
To align short-term signals with broader market trends, the script calculates an EMA on a higher timeframe as specified by the user. This multi-timeframe approach helps ensure that signals on the primary chart are consistent with the overall trend, thereby reducing false signals.
Dynamic Risk Management with ATR
ATR-Based Calculations:
The Average True Range (ATR) is used to measure current market volatility. This value is multiplied by a user-defined factor to dynamically determine stop loss (SL) and take profit (TP) levels, adapting to changing market conditions.
Visual SL/TP Markers:
The calculated SL and TP levels are plotted on the chart as distinct colored dots, enabling traders to quickly identify recommended exit points.
Optional Trailing Stop:
An optional trailing stop feature is available, which adjusts the stop loss as the trade moves favorably, helping to lock in profits while protecting against sudden reversals.
Risk/Reward Ratio Calculation:
MTF Signal Xpert computes a risk/reward ratio based on the dynamic SL and TP levels. This quantitative measure allows traders to assess whether the potential reward justifies the risk associated with a trade.
Condition Weighting and Signal Scoring
Binary Condition Checks:
Each technical condition—ranging from moving average crossovers, Bollinger Band positioning, and RSI range to MACD, AO, ADX, and volume filters—is assigned a binary score (1 if met, 0 if not).
Cumulative Scoring:
These individual scores are summed to generate cumulative bullish and bearish scores, quantifying the overall strength of the signal and providing traders with an objective measure of its viability.
Detailed Signal Explanation:
A comprehensive explanation string is generated, outlining which conditions contributed to the current BUY or SELL signal. This explanation is displayed on an on‑chart dashboard, offering transparency and clarity into the signal generation process.
On-Chart Visualizations and Debug Information
Chart Elements:
The indicator plots all key components—moving averages, Bollinger Bands, SL and TP markers—directly on the chart, providing a clear visual framework for understanding market conditions.
Combined Dashboard:
A dedicated dashboard displays key metrics such as RSI, ADX, and the bullish/bearish scores, alongside a detailed explanation of the current signal. This consolidated view allows traders to quickly grasp the underlying logic.
Debug Table (Optional):
For advanced users, an optional debug table is available. This table breaks down each individual condition, indicating which criteria were met or not met, thus aiding in further analysis and strategy refinement.
Mashup Justification and Originality
MTF Signal Xpert is more than just an aggregation of existing indicators—it is an original synthesis designed to address real-world trading complexities. Here’s how its components work together:
Integrated Trend, Volatility, and Momentum Analysis:
By combining moving averages, Bollinger Bands, and multiple oscillators (RSI, MACD, AO, ADX, and an optional stochastic), the indicator captures diverse market dynamics. Each component reinforces the others, reducing noise and filtering out false signals.
Multi-Timeframe Analysis:
The inclusion of a higher timeframe filter aligns short-term signals with longer-term trends, enhancing overall reliability and reducing the potential for contradictory signals.
Adaptive Risk Management:
Dynamic stop loss and take profit levels, determined using ATR, ensure that the risk management strategy adapts to current market conditions. The optional trailing stop further refines this approach, protecting profits as the market evolves.
Quantitative Signal Scoring:
The condition weighting system provides an objective measure of signal strength, giving traders clear insight into how each technical component contributes to the final decision.
How to Use MTF Signal Xpert:
Input Customization:
Adjust the moving average type and period settings, ATR multipliers, and oscillator thresholds to align with your trading style and the specific market conditions.
Enable or disable the optional stochastic oscillator and trailing stop based on your preference.
Interpreting the Signals:
When a BUY or SELL signal appears, refer to the on‑chart dashboard, which displays key metrics (e.g., RSI, ADX, bullish/bearish scores) along with a detailed breakdown of the conditions that triggered the signal.
Review the SL and TP markers on the chart to understand the associated risk/reward setup.
Risk Management:
Use the dynamically calculated stop loss and take profit levels as guidelines for setting your exit points.
Evaluate the provided risk/reward ratio to ensure that the potential reward justifies the risk before entering a trade.
Debugging and Verification:
Advanced users can enable the debug table to see a condition-by-condition breakdown of the signal generation process, helping refine the strategy and deepen understanding of market dynamics.
Disclaimer:
MTF Signal Xpert is intended for educational and analytical purposes only. Although it is based on robust technical analysis methods and has undergone extensive backtesting, past performance is not indicative of future results. Traders should employ proper risk management and adjust the settings to suit their financial circumstances and risk tolerance.
MTF Signal Xpert represents a comprehensive, original approach to trading signal generation. By blending trend detection, volatility assessment, momentum analysis, multi-timeframe alignment, and adaptive risk management into one integrated system, it provides traders with actionable signals and the transparency needed to understand the logic behind them.

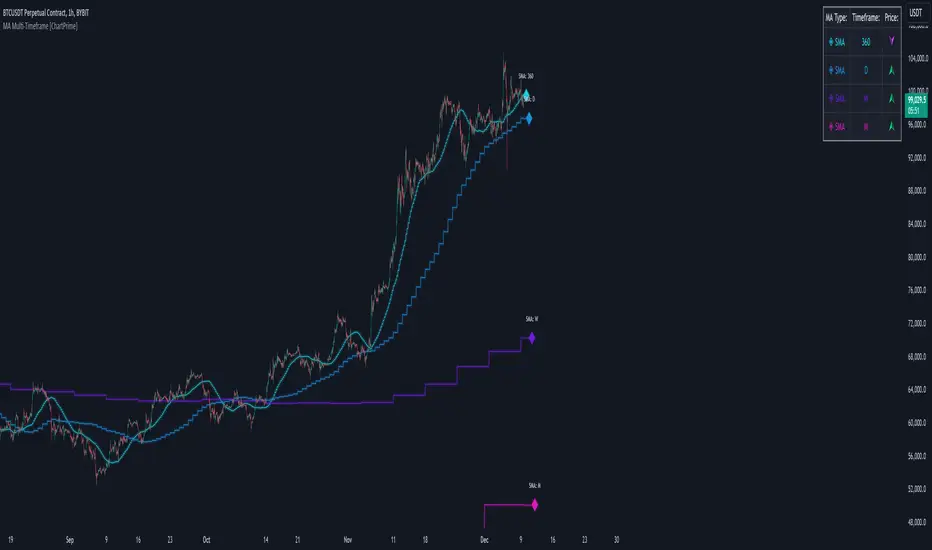
MA Multi-Timeframe [ChartPrime]The MA Multi-Timeframe indicator is designed to provide multi-timeframe moving averages (MAs) for better trend analysis across different periods. This tool allows traders to monitor up to four different MAs on a single chart, each coming from a selectable timeframe and type (SMA, EMA, SMMA, WMA, VWMA). The indicator helps traders gauge both short-term and long-term price trends, allowing for a clearer understanding of market dynamics.
⯁ KEY FEATURES AND HOW TO USE
⯌ Multi-Timeframe Moving Averages :
The indicator allows traders to select up to four MAs, each from different timeframes. These timeframes can be set in the input settings (e.g., Daily, Weekly, Monthly), and each moving average can be displayed with its corresponding timeframe label directly on the chart.
Example of different timeframes for MAs:
⯌ Moving Average Types :
Users can choose from several types of moving averages, including SMA, EMA, SMMA, WMA, and VWMA, making the indicator adaptable to different strategies and market conditions. This flexibility allows traders to tailor the MAs to their preference.
Example of different types of MAs:
⯌ Dashboard Display :
The indicator includes a built-in dashboard that shows each MA, its timeframe, and whether the price is currently above or below that MA. This dashboard provides a quick overview of the trend across different timeframes, allowing traders to determine whether the overall trend is up or down.
Example of trend overview via the dashboard:
⯌ Polyline Representation :
Each MA is plotted using polylines to avoid plot functions and create a curves across up to 4000 bars back, ensuring that historical data is visualized clearly for a deeper analysis of how the price interacts with these levels over time.
if barstate.islast
for i = 0 to 4000
cp.push(chart.point.from_index(bar_index , ma ))
polyline.delete(polyline.new(cp, curved = false, line_color = color, line_style = style) )
Example of polylines for moving averages:
⯌ Customization Options :
Traders can customize the length of the MAs for all timeframes using a single input. The color, style (solid, dashed, dotted) of each moving average are also customizable, giving users full control over the visual appearance of the indicator on their chart.
Example of custom MA styles:
⯁ USER INPUTS
MA Type : Select the type of moving average for each timeframe (SMA, EMA, SMMA, WMA, VWMA).
Timeframe : Choose the timeframe for each moving average (e.g., Daily, Weekly, Monthly).
MA Length : Set the length for the moving averages, which will be applied to all four MAs.
Line Style : Customize the style of each MA line (solid, dashed, or dotted).
Colors : Set the color for each MA for better visual distinction.
⯁ CONCLUSION
The MA Multi-Timeframe indicator is a versatile and powerful tool for traders looking to monitor price trends across multiple timeframes with different types of moving averages. The dashboard simplifies trend identification, while the customizable options make it easy to adapt to individual trading strategies. Whether you're analyzing short-term price movements or long-term trends, this indicator offers a comprehensive solution for tracking market direction.
J Lines EMA + VWAPThe EMA + VWAP indicator combines the power of Exponential Moving Averages (EMA) with the Volume Weighted Average Price (VWAP) to help traders spot trends, identify potential entries/exits, and understand market momentum with ease. This dual-purpose tool is designed to give both beginner and experienced traders a clear view of price direction and volume influence, whether for day trading or swing trading.
Key Features:
Dynamic EMA Lines:
Six customizable moving averages (EMA by default) adapt to your selected timeframe. EMAs help track trend direction and strength, with various colors and opacity settings that visually separate them for clarity.
VWAP Tracking: A standalone VWAP line (blue) shows the average trading price adjusted for volume, making it ideal for pinpointing significant price levels where institutional interest often lies.
EMA Ribbons for Trend Confirmation: Soft-colored ribbons are placed between EMA pairs to make the trend strength visually apparent, with different color fills between lines. This makes it easy to gauge bullish or bearish conditions at a glance.
Flexible MA Options: Besides EMA, you can choose from SMA, WMA, HMA, and RMA, allowing you to adapt the indicator to various trading strategies.
This tool simplifies trend-following and volume-based analysis by giving you insight into both price momentum and market participation levels. EMAs adapt to volatility and changing market conditions, while the VWAP keeps you aware of critical price zones based on trading volume. Together, these help you stay on the right side of the market, avoid false breakouts, and make informed decisions on when to enter or exit trades.
Ideal for beginners due to its visual clarity and flexible enough for seasoned traders, EMA + VWAP is your go-to indicator for a structured approach to market trends.

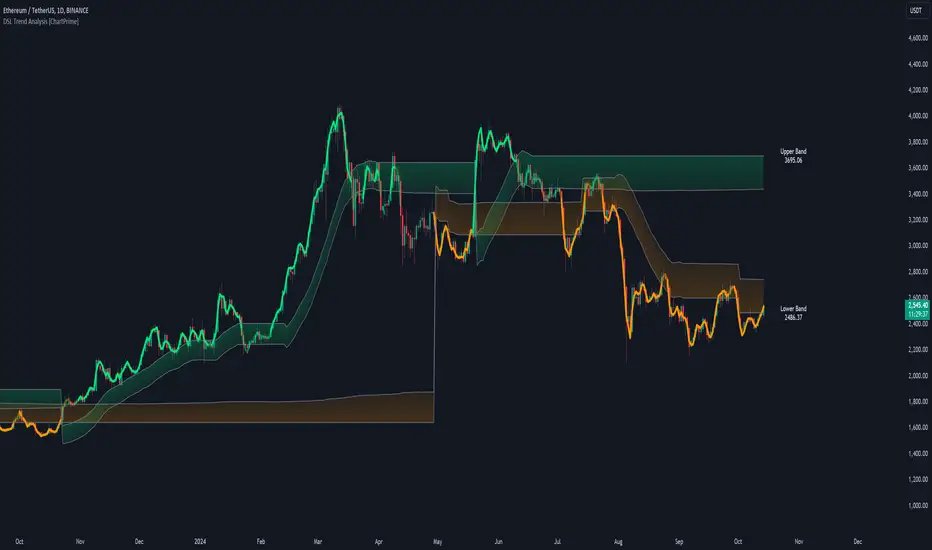
DSL Trend Analysis [ChartPrime]The DSL Trend Analysis indicator utilizes Discontinued Signal Lines (DSL) deployed directly on price, combined with dynamic bands, to analyze the trend strength and momentum of price movements. By tracking the high and low price values and comparing them to the DSL bands, it provides a visual representation of trend momentum, highlighting both strong and weakening phases of market direction.
⯁ KEY FEATURES AND HOW TO USE
⯌ DSL-Based Trend Detection :
This indicator uses Discontinued Signal Lines (DSL) to evaluate price action. When the high stays above the upper DSL band, the line turns lime, indicating strong upward momentum. Similarly, when the low stays below the lower DSL band, the line turns orange, indicating strong downward momentum. Traders can use these visual signals to identify strong trends in either direction.
⯌ Bands for Trend Momentum :
The indicator plots dynamic bands around the DSL lines based on ATR (Average True Range). These bands provide a range within which price can fluctuate, helping to distinguish between strong and weakening trends. If the high remains within the upper band, the lime-colored line becomes transparent, showing weakening upward momentum. The same concept applies for the lower band, where the line turns orange with transparency, indicating weakening downward momentum.
If high and low stays between bands line has no color
to make sure indicator catches only strong momentum of price
⯌ Real-Time Band Price Labels :
The indicator places two labels on the chart, one at the upper DSL band and one at the lower DSL band, displaying the real-time price values of these bands. These labels help traders track the current price relative to the key bands, which are essential in determining potential breakout or reversal zones.
⯌ Visual Confirmation of Momentum Shifts :
By monitoring the relationship between the high and low values of the price relative to the DSL bands, this indicator provides a reliable way to confirm whether the trend is gaining or losing strength. This allows traders to act accordingly, whether it's to enter or exit positions based on trend strength or weakness.
⯁ USER INPUTS
Length : Defines the period used to calculate the DSL lines, influencing the sensitivity of the trend detection.
Offset : Adjusts the offset applied to the upper and lower DSL bands, affecting how the thresholds for strong or weak momentum are set.
Width (ATR Multiplier) : Determines the width of the DSL bands based on an ATR multiplier, providing a dynamic range around the price for momentum analysis.
⯁ CONCLUSION
The DSL Trend Analysis indicator is a powerful tool for assessing price momentum and trend strength. By combining Discontinued Signal Lines with dynamically calculated bands, traders can easily spot key moments when momentum shifts from strong to weak or vice versa. The color-coded lines and real-time price labels provide valuable insights for trading decisions in both trending and ranging markets.
MENTFX AVERAGES MULTI TIMEFRAMEThe MENTFX AVERAGES MULTIME TIMEFRAME indicator is designed to provide traders with the ability to visualize multiple moving averages (MAs) from higher timeframes on their current chart, regardless of the chart's timeframe. It combines the power of exponential moving averages (EMAs) to help traders identify trends, spot potential reversal points, and make more informed trading decisions.
Key Features:
Multi-Timeframe Moving Averages: This indicator plots moving averages from daily timeframes directly on your chart, helping you keep track of higher timeframe trends while trading in any timeframe.
Customizable Moving Averages: You can adjust the length and visibility of up to three EMAs (default settings are 5, 10, and 20-period EMAs) to suit your trading style.
Overlay on Price: The indicator is designed to be overlaid on your price chart, seamlessly integrating with your existing analysis.
Simple but Effective: By offering a clear visual guide to where price is trading relative to important higher timeframe levels, this indicator helps traders avoid trading against major trends.
Why It’s Unique:
Validation Timeframe Flexibility: Unlike traditional moving average indicators that only work within the same chart's timeframe, the MENTFX AVERAGES M indicator allows you to pull moving averages from higher timeframes (default: Daily) and overlay them on any chart you're currently viewing, whether it's intraday (minutes) or even weekly. This cross-timeframe visibility is critical in determining the true market trend, adding context to your trades.
Customizability: Although the default settings focus on daily EMAs (5, 10, and 20 periods), traders can modify the parameters, including the type of moving average (Simple, Weighted, etc.), making it adaptable for any strategy. Whether you want shorter-term or longer-term averages, this indicator covers your needs.
Trend Confirmation Tool: The use of multiple EMAs helps traders confirm trend direction and potential price breakouts or reversals. For example, when the shorter-term 5 EMA crosses above the 20 EMA, it can signal a potential bullish trend, while the opposite could indicate bearish pressure.
How This Indicator Helps:
Identify Key Support and Resistance Levels: Higher timeframe moving averages often act as dynamic support and resistance. This indicator helps you stay aware of those critical levels, even when trading lower timeframes.
Trend Identification: Knowing where the market is relative to the 5, 10, and 20 EMAs from a higher timeframe gives you a clearer picture of whether you're trading with or against the prevailing trend.
Improved Decision Making: By aligning your trades with the direction of higher timeframe trends, you can increase your confidence in trade entries and exits, avoiding low-probability setups.
Multi-Market Use: This indicator works well across various asset classes—stocks, forex, crypto, and commodities—making it versatile for any trader.
How to Use:
Intraday Trading: Use the daily EMAs as a guide to see if intraday price movements align with longer-term trends.
Swing Trading: Plot daily EMAs to track the strength of a larger trend, using pullbacks to the moving averages as potential entry points.
Trend Trading: Monitor crossovers between the moving averages to signal potential changes in trend direction.
Default Settings:
5 EMA (Daily) – Blue Line
10 EMA (Daily) – Black Line
20 EMA (Daily) – Red Line
These lines will plot on your chart with a subtle opacity (33%) to ensure they don’t obstruct price action, while still providing crucial visual guidance on market trends.
This indicator is perfect for traders who want to blend technical analysis with multi-timeframe insights, helping you stay in sync with broader market movements while executing trades on any timeframe.

Technical Analysis ExpressionsDescription:
The indicator allows to display different moving averages and price levels from any timeframe. Instead of setting each plot one by one, you can specify all of them in one expression.
Inputs:
There's only one input, which is a text area where you can specify each plot as an expression. Each expression must be on a new line. Each expression can specify the source of the displayed values, the plot color and the timeframe from which that value is taken.
Here's an example expression that will plot SMA(20) of Close price from Daily timeframe, and the plot is going to be red. This will also plot an EMA(50) of High price from current timeframe, and the plot is going to be green (notice that you can specify the color as one of the standard Pinescript colors, or using a HEX color, and even using transparency if needed):
SMA(close, 20) red "D"
EMA(high, 50) #00ff00
You can also specify the color to be "chart.fg" which is the Foreground Color of current chart (it depends on whether the "Dark Theme" is enabled in Tradingview). The available moving averages are: SMA, EMA, WMA, HMA, RMA, VWMA. The available sources are: open, high, low, close, hl2, hlc3, hlcc4, ohlc4.
