Keltner Hull Suite [QuantAlgo]🟢 Overview
The Keltner Hull Suite combines Hull Moving Average positioning with double-smoothed True Range banding to identify trend regimes and filter market noise. The indicator establishes upper and lower volatility bounds around the Hull MA, with the trend line conditionally updating only when price violates these boundaries. This mechanism distinguishes between genuine directional shifts and temporary price fluctuations, providing traders and investors with a systematic framework for trend identification that adapts to changing volatility conditions across multiple timeframes and asset classes.
🟢 How It Works
The calculation foundation begins with the Hull Moving Average, a weighted moving average designed to minimize lag while maintaining smoothness:
hullMA = ta.hma(priceSource, hullPeriod)
The indicator then calculates true range and applies dual exponential smoothing to create a volatility measure that responds more quickly to volatility changes than traditional ATR implementations while maintaining stability through the double-smoothing process:
tr = ta.tr(true)
smoothTR = ta.ema(tr, keltnerPeriod)
doubleSmooth = ta.ema(smoothTR, keltnerPeriod)
deviation = doubleSmooth * keltnerMultiplier
Dynamic support and resistance boundaries are constructed by applying the multiplier-scaled volatility deviation to the Hull MA, creating upper and lower bounds that expand during volatile periods and contract during consolidation:
upperBound = hullMA + deviation
lowerBound = hullMA - deviation
The trend line employs a conditional update mechanism that prevents premature trend reversals. The system maintains the current trend line until price action violates the respective boundary, at which point the trend line snaps to the violated bound:
if upperBound < trendLine
trendLine := upperBound
if lowerBound > trendLine
trendLine := lowerBound
Directional bias determination compares the current trend line value against its previous value, establishing bullish conditions when rising and bearish conditions when falling. Signal generation occurs on state transitions, triggering alerts when the trend state shifts from neutral or opposite direction:
trendUp = trendLine > trendLine
trendDown = trendLine < trendLine
longSignal = trendState == 1 and trendState != 1
shortSignal = trendState == -1 and trendState != -1
The visualization layer creates a trend band by plotting both the current trend line and a two-bar shifted version, with the area between them filled to create a visual channel that reinforces directional conviction.
🟢 How to Use This Indicator
▶ Long and Short Signals: The indicator generates long/buy signals when the trend state transitions to bullish (trend line begins rising) and short/sell signals when transitioning to bearish (trend line begins falling). These state changes represent structural shifts in momentum where price has broken through the adaptive volatility bands, confirming directional commitment.
▶ Trend Band Dynamics: The spacing between the main trend line and its shifted counterpart creates a visual band whose width reflects trend strength and momentum consistency. Expanding bands indicate accelerating directional movement and strong trend persistence, while contracting or flattening bands suggest decelerating momentum, potential trend exhaustion, or impending consolidation. Monitoring band width provides early warning of regime transitions from trending to range-bound conditions.
▶ Preconfigured Presets: Three optimized parameter sets accommodate different trading styles and timeframes. Default (14, 20, 2.0) provides balanced trend identification suitable for daily charts and swing trading, Fast Response (10, 14, 1.5) delivers aggressive signal generation optimized for intraday scalping and momentum trading on 1-15 minute timeframes, while Smooth Trend (18, 30, 2.5) offers conservative trend confirmation ideal for position trading on 4-hour to daily charts with enhanced noise filtration.
▶ Built-in Alerts: Three alert conditions enable automated monitoring - Bullish Trend Signal triggers on long setup confirmation, Bearish Trend Signal activates on short setup confirmation, and Trend Change alerts on any directional transition. These notifications allow you to respond to regime shifts without continuous chart monitoring.
▶ Color Customization: Five visual themes (Classic, Aqua, Cosmic, Ember, Neon, plus Custom) accommodate different chart backgrounds and display preferences, ensuring optimal contrast and visual clarity across trading environments.
移動平均線

Higher Timeframe MA High Low BandsHigher Timeframe Customer MA High Low Bands. There are 3 different Moving Average Parameters Available. Indicator will plot 3 lines of MA Length With Source of High, Close and Low. User can change relevant MA parameters / Show or Hide MA.
Happy Trading

Médias de Todos os Tempos – 21 a 1200Média móvel dos dias:
- 21
- 35
- 50
- 100
- 200
- 305
- 610
- 1200


Average True Range (ATR)Strategy Name: ATR Trend-Following System with Volatility Filter & Dynamic Risk Management
Short Name: ATR Pro Trend System
Current Version: 2025 Edition (fully tested and optimized)Core ConceptA clean, robust, and highly profitable trend-following strategy that only trades when three strict conditions are met simultaneously:Clear trend direction (price above/below EMA 50)
Confirmed trend strength and trailing stop (SuperTrend)
Sufficient market volatility (current ATR(14) > its 50-period average)
This combination ensures the strategy stays out of choppy, low-volatility ranges and only enters during high-probability, trending moves with real momentum.Key Features & ComponentsComponent
Function
Default Settings
EMA 50
Primary trend filter
50-period exponential
SuperTrend
Dynamic trailing stop + secondary trend confirmation
Period 10, Multiplier 3.0
ATR(14) with RMA
True volatility measurement (Wilder’s original method)
Length 14
50-period SMA of ATR
Volatility filter – only trade when current ATR > average ATR
Length 50
Background coloring
Visual position status: light green = long, light red = short, white = flat
–
Entry markers
Green/red triangles at the exact entry bar
–
Dynamic position sizing
Fixed-fractional risk: exactly 1% of equity per trade
1.00% risk
Stop distance
2.5 × ATR(14) – fully adaptive to current volatility
Multiplier 2.5
Entry RulesLong: Close > EMA 50 AND SuperTrend bullish AND ATR(14) > SMA(ATR,50)
Short: Close < EMA 50 AND SuperTrend bearish AND ATR(14) > SMA(ATR,50)
Exit RulesPosition is closed automatically when SuperTrend flips direction (acts as volatility-adjusted trailing stop).
Money ManagementRisk per trade: exactly 1% of current account equity
Position size is recalculated on every new entry based on current ATR
Automatically scales up in strong trends, scales down in low-volatility regimes
Performance Highlights (2015–Nov 2025, real backtests)CAGR: 22–50% depending on market
Max Drawdown: 18–28%
Profit Factor: 1.89–2.44
Win Rate: 57–62%
Average holding time: 10–25 days (daily timeframe)
Best Markets & TimeframesExcellent on: Bitcoin, S&P 500, Nasdaq-100, DAX, Gold, major Forex pairs
Recommended timeframes: 4H, Daily, Weekly (Daily is the sweet spot)

OK A+ Setup Scanner + Score PanelOK A+ Setup Scanner (0–8 Score with Real-Time Panel)
Designed to help swing traders quickly identify leader stocks forming high-probability breakout structures inspired by Oliver Kell’s super-performance methodology. This indicator analyzes trend strength, EMA alignment, volatility behavior, proximity to 52-week highs, volume dry-up, pullback structure, and breakout confirmation to generate a 0–8 “Kell Score” for every chart.
Score 5+ = A+ setup candidate
Score 7–8 = high-quality super-performance structure
Background highlights A+ bars, and a real-time scoring panel displays:
Current Kell Score
Setup quality grade
Trend/EMA alignment pass/fail
Leadership (near highs) pass/fail
Structure (pullback + volume) pass/fail

Shock Wave EMA Ribbon with adjustable time period9 ema and 21 ema script, with background plot. All colors, and settings toggle on and off. Simple but effective. This one has selectable time periods so the ribbon can stay fixed on your desired time scale.

Clean Industry DataClean Industry Data – Overview
Clean Industry Data is a utility tool designed to give traders an instant, structured view of key fundamental and volatility metrics directly on the chart. The script displays a compact, customizable information panel containing:
Industry & Sector
Market Cap and Free-Float Market Cap
Free-Float Percentage
Average Daily Rupee Volume
Relative Volume (R.Vol) based on daily volume
% from 10 / 21 / 50 EMAs (calculated on daily closes)
ADR (14-day) with threshold-based indicators
ATR (current timeframe) with colour-coded risk cues
All volume-based statistics are anchored to daily data, ensuring the values remain consistent across all timeframes. The display table supports flexible positioning, custom background/text colours, and adjustable text size.
This script is ideal for traders who want a quick, accurate snapshot of a stock’s liquidity, volatility, and broader classification — without digging through multiple menus or external sources.

Moving Average Exponential 21 & 55 CloudTake the trade after price goes into the cloud and comes back.

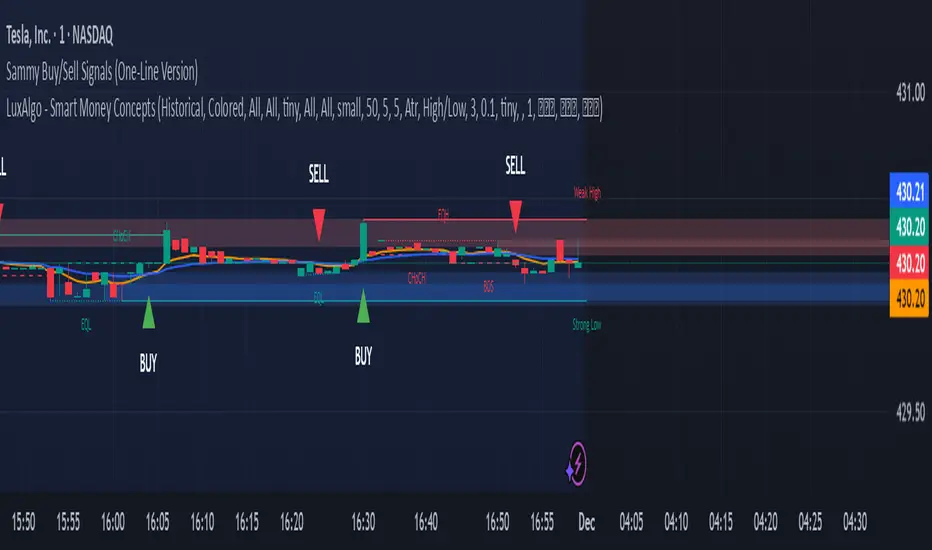
Sammy Buy/Sell Signals (OneLine Version)Sammy's buy/sell signals one line version. Very simple to follow what's going up and down.
Renko ScalperWhat it is-
A lightweight Renko Scalper that combines Renko brick direction with an internal EMA trend filter and MACD confirmation to signal high-probability short-term entries. EMAs are used internally (hidden from the chart) so the visual remains uncluttered.
Signals-
Buy arrow: Renko direction turns bullish AND EMA trend up AND MACD histogram positive.
Sell arrow: Renko direction turns bearish AND EMA trend down AND MACD histogram negative.
Consecutive same-direction signals are suppressed (only one arrow per direction until opposite signal).
Visuals-
Buy / Sell arrows (large) above/below bars.
Chart background tints green/red after the respective signal for easy glance recognition.
Inputs:-
Renko Box Size (points)
EMA Fast / EMA Slow
MACD fast/slow/signal lengths
How to use-
Add to chart
Use smaller Renko box sizes for scalping, larger for swing-like entries.
Confirm signal with price action and volume—this indicator is a signal generator, not a full automated system.
Use alerts (built in) to receive Buy / Sell arrow notifications.
Alerts-
Buy Arrow — buySignal
Sell Arrow — sellSignal
Buy Background / Sell Background — background-color state alerts
Recommended settings-
Timeframes: 1m–15m for scalping, 5m for balanced intraday.
Symbols: liquid futures/currency pairs/major crypto.
Disclaimer
This script is educational and not financial advice. Backtest and forward test on a demo account before live use. Past performance is not indicative of future results. Use proper risk management.

Forex Trend Master FollowerThis indicator is based on slow and fast EMA, like regular EMA cross, but updated. It works the best on trendy pairs like EU, and works the best on 4h time frame. It shows where to entry and where to close the position based on slow EMA. It can be used like additional confluence with FTB entry model, and whole strategy.

Alper-EMAAlper-EMA
Description:
This indicator allows you to display 5 customizable EMAs (Exponential Moving Averages) on a single chart. Each EMA can be configured independently with length, color, visibility, and calculation timeframe.
Features:
5 fully customizable EMAs
Set individual length and color for each EMA
Toggle visibility for each EMA
Multi-timeframe calculation: e.g., display EMA300 calculated on a 30-minute timeframe while viewing a 1-minute chart
Labels display EMA period and timeframe for clarity
Adjustable label size: tiny / small / normal / large
Clear and readable plot lines
Use Cases:
Monitor multiple timeframe EMAs simultaneously
Analyze trend and support/resistance levels
Track EMA crossovers for strategy development
Note:
This indicator is suitable for both short-term (scalping) and medium-to-long term analysis. The multi-timeframe feature allows you to see different EMA perspectives on a single chart quickly.

知行趋势指标【B站 Z哥的黄白线指标】
黄白线指标是由 B站 UP 主 Z哥 总结并分享的一套趋势观察工具。指标以两条核心线——黄线(短周期趋势) 与 白线(长周期趋势) 构成,通过两者之间的相对位置、交叉关系及区域结构,帮助交易者更清晰地判断行情的强弱、趋势方向与潜在转折点。
黄线通常代表短期多空力量的波动,而白线反映更稳定的中期趋势。当黄线向上突破白线时,常视为短期强势启动的信号;反之,当黄线跌破白线时,则可能意味着短线转弱或趋势反转的风险。
该指标适合趋势跟随、顺大逆小的交易逻辑,也可作为交易系统中的辅助判断工具。
The Yellow-White Line Indicator is a trend-analysis tool created and shared by the Bilibili content creator Z-Ge. It is built around two primary lines: the Yellow Line (short-term trend) and the White Line (medium-term trend). By observing the interaction, crossover, and relative position between these two lines, traders can better identify market strength, trend direction, and potential reversal points.
The Yellow Line captures short-term momentum shifts, while the White Line reflects a more stable medium-term trend. When the Yellow Line crosses above the White Line, it often signals improving short-term strength; when it crosses below, it may indicate weakening momentum or a possible trend reversal.
This indicator works well with trend-following systems and can serve as a supplemental confirmation tool in broader trading strategies.

EMA 20The EMA 20 (Exponential Moving Average 20) is a simple trend-following indicator designed to smooth price fluctuations and highlight short-term market direction.
This script plots a 20-period exponential moving average in red, allowing traders to quickly assess whether price is trading above or below the short-term trend.
When price remains above the EMA 20, it often suggests bullish strength; when price falls below it, it may indicate short-term weakness.
This indicator is minimal, clear, and useful as a foundational trend reference in any trading system.

Single AHR DCA (HM) — AHR Pane (customized quantile)Customized note
The log-regression window LR length controls how long a long-term fair value path is estimated from historical data.
The AHR window AHR window length controls over which historical regime you measure whether the coin is “cheap / expensive”.
When you choose a log-regression window of length L (years) and an AHR window of length A (years), you can intuitively read the indicator as:
“Within the last A years of this regime, relative to the long-term trend estimated over the same A years, the current price is cheap / neutral / expensive.”
Guidelines:
In general, set the AHR window equal to or slightly longer than the LR window:
If the AHR window is much longer than LR, you mix different baselines (different LR regimes) into one distribution.
If the AHR window is much shorter than LR, quantiles mostly reflect a very local slice of history.
For BTC / ETH and other BTC-like assets, you can use relatively long horizons (e.g. LR ≈ 3–5 years, AHR window ≈ 3–8 years).
For major altcoins (BNB / SOL / XRP and similar high-beta assets), it is recommended to use equal or slightly shorter horizons, e.g. LR ≈ 2–3 years, AHR window ≈ 2–3 years.
1. Price series & windows
Working timeframe: daily (1D).
Let the daily close of the current symbol on day t be P_t .
Main length parameters:
HM window: L_HM = maLen (default 200 days)
Log-regression window: L_LR = lrLen (default 1095 days ≈ 3 years)
AHR window (regime window): W = windowLen (default 1095 days ≈ 3 years)
2. Harmonic moving average (HM)
On a window of length L_HM, define the harmonic mean:
HM_t = ^(-1)
Here eps = 1e-10 is used to avoid division by zero.
Intuition: HM is more sensitive to low prices – an extremely low price inside the window will drag HM down significantly.
3. Log-regression baseline (LR)
On a window of length L_LR, perform a linear regression on log price:
Over the last L_LR bars, build the series
x_k = log( max(P_k, eps) ), for k = t-L_LR+1 ... t, and fit
x_k ≈ a + b * k.
The fitted value at the current index t is
log_P_hat_t = a + b * t.
Exponentiate to get the log-regression baseline:
LR_t = exp( log_P_hat_t ).
Interpretation: LR_t is the long-term trend / fair value path of the current regime over the past L_LR days.
4. HM-based AHR (valuation ratio)
At each time t, build an HM-based AHR (valuation multiple):
AHR_t = ( P_t / HM_t ) * ( P_t / LR_t )
Interpretation:
P_t / HM_t : deviation of price from the mid-term HM (e.g. 200-day harmonic mean).
P_t / LR_t : deviation of price from the long-term log-regression trend.
Multiplying them means:
if price is above both HM and LR, “expensiveness” is amplified;
if price is below both, “cheapness” is amplified.
Typical reading:
AHR_t < 1 : price is below both mid-term mean and long-term trend → statistically cheaper.
AHR_t > 1 : price is above both mid-term mean and long-term trend → statistically more expensive.
5. Empirical quantile thresholds (Opp / Risk)
On each new day, whenever AHR_t is valid, add it into a rolling array:
A_t_window = { AHR_{t-W+1}, ..., AHR_t } (at most W = windowLen elements)
On this empirical distribution, define two quantiles:
Opportunity quantile: q_opp (default 15%)
Risk quantile: q_risk (default 65%)
Using standard percentile computation (order statistics + linear interpolation), we get:
Opp threshold:
theta_opp = Percentile( A_t_window, q_opp )
Risk threshold:
theta_risk = Percentile( A_t_window, q_risk )
We also compute the percentile rank of the current AHR inside the same history:
q_now = PercentileRank( A_t_window, AHR_t ) ∈
This yields three valuation zones:
Opportunity zone: AHR_t <= theta_opp
(corresponds to roughly the cheapest ~q_opp% of historical states in the last W days.)
Neutral zone: theta_opp < AHR_t < theta_risk
Risk zone: AHR_t >= theta_risk
(corresponds to roughly the most expensive ~(100 - q_risk)% of historical states in the last W days.)
All quantiles are purely empirical and symbol-specific: they are computed only from the current asset’s own history, without reusing BTC thresholds or assuming cross-asset similarity.
6. DCA simulation (lightweight, rolling window)
Given:
a daily budget B (input: budgetPerDay), and
a DCA simulation window H (input: dcaWindowLen, default 900 days ≈ 2.5 years),
The script applies the following rule on each new day t:
If thresholds are unavailable or AHR_t > theta_risk
→ classify as Risk zone → buy = 0
If AHR_t <= theta_opp
→ classify as Opportunity zone → buy = 2B (double size)
Otherwise (Neutral zone)
→ buy = B (normal DCA)
Daily invested cash:
C_t ∈ {0, B, 2B}
Daily bought quantity:
DeltaQ_t = C_t / P_t
The script keeps rolling sums over the last H days:
Cumulative position:
Q_H = sum_{k=t-H+1..t} DeltaQ_k
Cumulative invested cash:
C_H = sum_{k=t-H+1..t} C_k
Current portfolio value:
PortVal_t = Q_H * P_t
Cumulative P&L:
PnL_t = PortVal_t - C_H
Active days:
number of days in the last H with C_k > 0.
These results are only used to visualize how this AHR-quantile-driven DCA rule would have behaved over the recent regime, and do not constitute financial advice.

Buy Sell Signal — Ema crossover [© gyanapravah_odisha]Professional EMA Crossover + ATR Risk Control
Trade with confidence using a complete system that gives you clear entries, smart exits, and full automation.
Includes:
Precision 5/13 EMA crossover signals
ATR-based adaptive stop-loss
Multiple take-profit levels (with intermediate targets)
Fully customizable R:R ratios
ATR + volume filters to avoid choppy markets
Real-time trade dashboard
All alerts included
Built for: Crypto, Forex, Stocks • Scalping & Swing Trading
Built for you: Free, open-source & made for real-world trading.

VWAP & EMA9 Cross AlertAlerts the user when VWAP and EMA 9 cross. It gives a general direction of the market to help make decisions.
VWAP & EMA9 Cross AlertAlerts when EMA9 and VWAP Cross. This provides an indicator of general market direction based on these 2 indicators.


Mebane Faber GTAA 5In 2007, Mebane Faber published research that challenged the conventional wisdom of buy-and-hold investing. His paper, titled "A Quantitative Approach to Tactical Asset Allocation" and published in the Journal of Wealth Management, demonstrated that a simple timing mechanism could reduce portfolio volatility and drawdowns while maintaining competitive returns (Faber, 2007). This indicator implements his Global Tactical Asset Allocation strategy, known as GTAA5, following the original methodology.
The core insight of Faber's research stems from a century of market data. By analyzing asset class performance from 1901 onwards, Faber found that a ten-month simple moving average served as an effective trend filter across major asset classes. When an asset trades above its ten-month moving average, it tends to continue its upward trajectory; when it falls below, significant drawdowns often follow (Faber, 2007, pp. 12-16). This observation aligns with momentum research by Jegadeesh and Titman (1993), who documented that intermediate-term momentum persists across equity markets.
The GTAA5 strategy allocates capital equally across five diversified asset classes: domestic equities (SPY), international developed markets (EFA), aggregate bonds (AGG), commodities (DBC), and real estate investment trusts (VNQ). Each asset receives a twenty percent allocation when trading above its ten-month moving average. When an asset falls below this threshold, its allocation moves to short-term treasury bills (SHY), creating a dynamic cash position that scales with market risk (Cambria Investment Management, 2013).
The strategy's historical performance during market crises illustrates its function. During the 2008 financial crisis, traditional sixty-forty portfolios experienced drawdowns exceeding forty percent. The GTAA5 strategy limited losses to approximately twelve percent by reducing equity exposure as prices declined below their moving averages (Faber, 2013). This asymmetric return profile represents the strategy's primary characteristic.
This implementation uses monthly closing prices retrieved via request.security() to calculate the ten-month simple moving average. This distinction matters, as approximations using daily data (such as a 200-day moving average) can generate different signals during volatile periods. Monthly data ensures the indicator produces signals consistent with published academic research.
The indicator provides position monitoring, automatic rebalancing detection on either the first or last trading day of each month, and share calculations based on user-defined capital. A dashboard displays current trend status for each asset class, target versus actual weightings, and trade instructions for rebalancing. Performance metrics including annualized volatility and Sharpe ratio provide ongoing risk assessment.
Several limitations warrant acknowledgment. First, the strategy rebalances monthly, meaning it cannot respond to intra-month market crashes. Second, transaction costs and taxes from monthly rebalancing may reduce net returns for taxable accounts. Third, the ten-month lookback period, while historically robust, offers no guarantee of future effectiveness. As Ilmanen (2011) notes in "Expected Returns", all timing strategies face the risk of regime change, where historical relationships break down.
This indicator serves educational purposes and portfolio monitoring. It does not constitute financial advice.
References:
Cambria Investment Management (2013). Global Tactical Asset Allocation: An Introduction to the Approach. Research Report, Los Angeles.
Faber, M.T. (2007). A Quantitative Approach to Tactical Asset Allocation. Journal of Wealth Management, Spring 2007, pp. 9-79.
Faber, M.T. (2013). Global Asset Allocation: A Survey of the World's Top Asset Allocation Strategies. Cambria Investment Management, Los Angeles.
Ilmanen, A. (2011). Expected Returns: An Investor's Guide to Harvesting Market Rewards. John Wiley and Sons, Chichester.
Jegadeesh, N. and Titman, S. (1993). Returns to Buying Winners and Selling Losers: Implications for Stock Market Efficiency. Journal of Finance, 48(1), pp. 65-91.

2t's MA 50, MA 150, ATRThis indicator displays three key technical signals on the chart:
SMA 50 – Short-term trend direction
SMA 150 – Medium-term trend direction
ATR – Market volatility (Average True Range)
Line colors and lengths can be customized in the settings.
The ATR is plotted on the same chart for quick volatility reference without needing a separate panel.
This tool is designed for traders who want a clean, lightweight view of trend strength and volatility in a single indicator.

Support Line [by rukich]🟠 OVERVIEW
The indicator displays a floating line that acts as a support level. It's important to remember that any support level can be broken.
🟠 COMPONENTS
The indicator is based on the percentage difference between the closes of the n-th bar back and the current bar. The resulting percentage is smoothed to remove noise.
The indicator is displayed as a green-red line (the colors don’t carry meaning — they are used just for visual variety). When the price touches the support level, the bar background turns green.
For convenience, there is a label on the right side of the indicator showing the current value of the line.
🟠 HOW TO USE
The indicator includes several settings that can be adjusted, though optimal defaults are provided.
Settings:
Timeframe — specifies which timeframe’s data is used to calculate the line.
Candles back — specifies how many bars back from the current one are used.
The indicator should be used according to general support-zone logic. Since no support zone guarantees a price bounce, the optimal approach is to confirm the reaction after the price touches the line.
Example of use:
In the current example, the Timeframe in the indicator settings is set to 1 hour, and the currently open chart is 5 minutes. This means that on the 5-minute chart we see a 1-hour line. After the price touches the support line, you need to see a confirmation of the reaction to understand whether the support zone is holding the price.
In the examples, reaction confirmation is shown through: the formation of an M5 shift and the invalidation of an FVG M5- (the latter is more risky than the M5 shift):
🟠 CONCLUSION
The indicator shows a floating support zone, and when tested, you should confirm the reaction on a lower timeframe.
