High/Low Channel Multi averages Crypto Swing strategyThis is a swing strategy designed for trending markets such as crypto and stock, with big timeframes , like 8h.
For this strategy we take SMA, EMA, VWMA, ALMA, SMMA, LSMA and VWMA and make an apply them all to both HIGH and LOW separately and make 2 averages, 1 applied to high and the other applied to low.
With them we make a channel.
Rules for entry
For long: close of a candle is above avg applied to high.
For short: close of a candle is below avg applied to low.
Rules for exit
We exit when we either hit TP or SL or when we receive a different condition than the entry one.(long- > short and viceversa)
If you have any questions, let me know !
移動平均線

Swing/Scalper HULL + T3 avg Crypto StrategyThis is a both a swing and a scalper strategy(depends on the timeframe that you use), that works with all timeframes, however I noticed that with swing 3h works the best on most crypto pairs, such as ETH, BTC and so on.
Its main components are:
Hull moving average
T3 moving average
Risk management
With them I make an average and use it as the main moving average.
Rules for entry
For long: Average moving average is bigger than previous average moving average value.
For short:Average moving average is lower than previous average moving average value.
Rules for exit
We exit when either the TP/SL has been hit, or when we get a different condition than previous one(both for long and short).
If you have any questions, let me know !

TEMA/MAMA CrossThis is a strategy based on the TEMA and Ehler's MAMA moving averages. Crosses of the fast and slow TEMA are commonly used for entry and exit strategies. The Ehler's Mesa Adaptive Moving Average is a trend-following price indicator that uses a Hilbert Transform. Having plotted both TEMA and eMAMA side-by-side for some time, I noticed a pattern where the fastTEMA crossed over the eFAMA (eFAMA is the Ehler's MAMA following/slow MA) prior to a price increase. This is a strategy to test that observation.
The strategy (at present) only does long entries. It enters long when the fastTEMA crosses up over the (slow) eFAMA. It uses a traditional exit when the fastTEMA crosses below the slowTEMA. I have tested this on several tokens on 1hr charts using a fastTEMA length of 13. Play with it on different charts and different lengths to see how it works for you.

Hull Crossover Strategy no TP or SLWhat is it?
A simple yet effective strategy ran on the 30m chart.
This is a basic idea that can be expanded on using different indicator to either add signals or filter out certain bad signals!
The strategy consists of 1 fast moving average and 1 slow moving average.
Both of these moving averages are the Hull Moving Average
What is the Hull Moving Average?
The Hull Moving Average ( HMA ) is a directional trend indicator.
It captures the current market conditions and uses recent price action to determine if conditions are bullish or bearish relative to historical data.
The Hull is different from traditional trend indicators like the EMA and the SMA .
It is designed to reduce the lag often associated with other MAs by providing a faster signal on a smoother visual plane.
How it works?
When the fast HMA crosses over the slow HMA , we initiate a long signal, and
when the fast HMA crosses under the slow HMA , we initiate a short signal.
Conclusion
The power of simplicity is what makes this such a great core to use to build onto making something even better!
The results were optimised to suit the most common market conditions seen today.
******** Not financial advice! ********

Ichimoku with MACD/ CMF/ TSIThis is a very powerful trend strategy designed for markets such as stocks market , stock index and crypto.
For time frames I found out that 1h seems to do the trick.
Components:
Ichimoku full pack
MACD histogram
CMF oscillator
TSI oscillator
Rules for entry
Long :
For Ichimoku:Tenkan part of cloud is bigger than kijun, Chikou is above 0 , close of a candle is above the Senkou
MACD histogram is above 0
CMF oscillator is positive and bigger than 0.1
TSI oscillator is above 0
Short:
For Ichimoku:Tenkan part of cloud is smaller than kijun, Chikou is below 0 , close of a candle is belowthe Senkou
MACD histogram is below 0
CMF oscillator is negative and below -0.1
TSI oscillator is below 0
Rules for exit
This strategy does not have any risk management inside. Instead it exits whenver it receives an opposite signal form the original one used for entry.
If you have any questions let me know !

Strategy TemplateTrying to include few basic things which is needed for strategy which can be used as template.
Few important components
Strategy parameters
Few important parameters include - initial_capital, default_qty_type, default_qty_value, commission_type, pyramiding and commission_value. All my strategies will have similar settings with initial captial set to 20000 to 100000. 100% of equity per trade with no pyramiding (set to 1) and minimal commission.
margin_long and margin_short can be used for leveraged trading. But, since we are not using pyramiding, it will make no effect.
Trade Limiting parameters
Two types of limiting is available in the scripts
Limiting trading direction : this is done through method strategy.risk.allow_entry_in and input parameter tradeDirection
Limiting trades to particular time window : This is achieved through adding start time and end time parameters of type input.time and check whether time is within this window
Custom Methods
customized security method to get higher timeframe data
customized moving average method to get moving average of any type
Custom Parameters
Moving average Type option list which I use quite often. Any strategy where there is need to use moving average, I try to scan through different moving average types and lengths to see which one is more appropriate for the given strategy. Hence, keeping this parameter in template to make it readily available when I start with new strategy
waitForCloseBeforeExit - this is used if trailing stop need to activated as soon as price hits the stop or only on close price. This is again something I switch quite often based on strategy. Hence, keeping this as part of the template.
Entry and Exit statements for long and short
These statements from line (57 to 62) can remain as is even with new strategy. Only thing to be set are variables - buyCondition, sellCondition, closeBuyCondition and closeSellCondition
Last but not the least
In pinescript, a long and short position cannot coexist in a strategy at any point of time. Any short positions created will automatically stop long positions and vice versa. Hence, it is important make short and long trades mutually exclusive. In this example, I have used 200 weekly moving average as trend bias. No short positions are taken when price is trading above 200 weekly moving average low/close and no long positions are taken when price is less than 200 weekly moving average high/close. Any rule built on top of this (In this case a simple supertrend rules) ensures that there are no conflicting signals and hence avoids confusing trades on the stratgy.

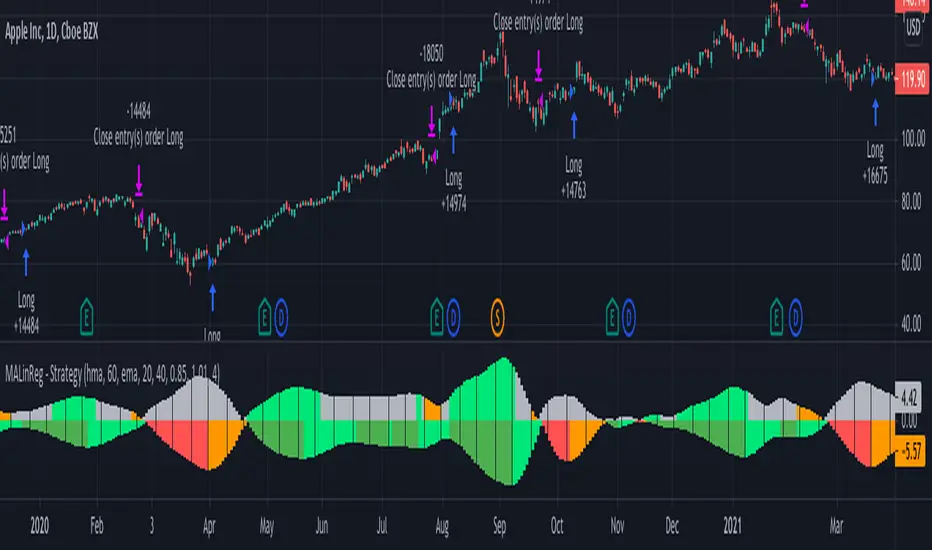
MACandles-LinearRegression-StrategyThis is combination of multiple indicators and strategies. Mainly useful for indexes and to time the entry and exits of indexes. No stoploss used - makes it less desirable for leveraged trades or trading individual stocks.
Let us rewind and look back at some of the indicators/strategies published earlier.
1. Moving Average Candles - this is one of my favourite tool for general trend filtering. Applying supertrend on moving average candles is one of the easiest ways to find reversal in trending market without exiting positions too early. Few scripts published on this basis are:
MA Candles Supertrend
MA Candles Supertrend Strategy
2. VixFix and Linear Regression - this itself is combination of two indicators.
Williams-Vix-Fix-Finds-Market-Bottoms - by @ChrisMoody
Squeeze-Momentum-Indicator - by @LazyBear
I have combined these two indicators to derive VIX-Fix linear regression to find absolute market bottoms. More description here:
VixFixLinReg-Strategy
VixFixLinReg-Indicator
Now, in this strategy, we combine all these together.
Derive moving average candles
Derive momentum of moving average candles
Derive Linear regression on momentum
Optionally, also calculate VIX Fix and Linear regression on VixFix momentum
To find market bottom:
There are two options
1. Use when momentum of MA candles hit bottom (red) and slowly turn up (orange). In aggressiveLong mode, signals are also generated when momentum starts going positive from negative.
2. Use Vix Fix linear regression of MA candles as described in the original script of VixFixLinReg-Strategy
To find market top
Here only Ma candles momentum decreasing is used as signal. If looking for longTrades , exit signal is generated only when momentum is turning negative extreme(orange). Or else, exit signal is generated when momentum has turned neutral.
At this stage, it is very much experimental - use it with caution :)
Supertrend LSMA long StrategyThis is a long strategy which combines Super trend indicator with LSMA moving average.
In general it tends to works better with long trending markets such as stocks and cryptos using a big timeframe.
The rules are simple
Long entry:
Supertrend is telling us to go long and close of a candle is above moving average
Long exit:
Supertrend is telling us to go short
IF you have any questions, let me know !

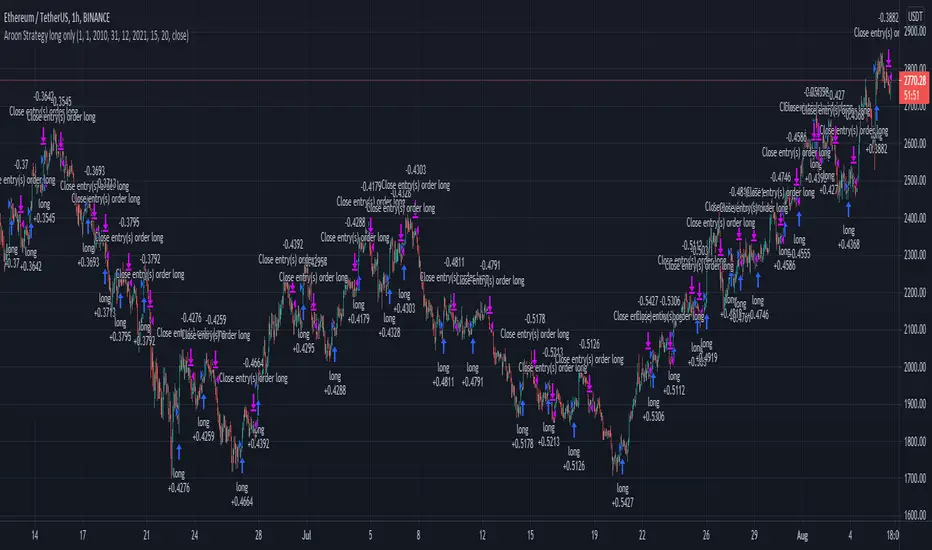
Aroon Strategy long onlyThis is a simple long only strategy made of Aroon and Least Square moving average.
The rules are simple:
Long entry = crossover of upper part with the lower part from aroon and close of the candle is above the moving average
Long exit = crossunder of upper part with the lower part from aroon and close of the candle is below the moving average
IF you have any questions let me know !
Extremely high win rate FOREX swing strategyTHis is a very simple yet extremely efficient FOREX strategy .
In general it tends to work the best against NZD and AUD pairs, however other major pairs and crosses can work as well.
It's made of a time management, together with MACD , moving average , a price action rule and a risk management.
THe logic behind is the next one :
For LONG:
We have 3 ascending candles.
Histogram of MACD is positive.
Last close of a candle is was above moving average.
If all those previous condition happened before 17/18 UTC time depending if its summer time or not, we enter the trade.
For Short:
We have 3 descending candles.
Histogram of MACD is negative.
Last close of a candle is was below moving average.
If all those previous condition happened before 17/18 UTC time depending if its summer time or not, we enter the trade.
RIsk management
For risk management, since we aim to have a 95%+ win rate, we aim to have a 5:1 or 10:1 risk to reward ratio. Meaning that for each $ we can win, we can lose 5-10$.
THats why I recommend to be extremely careful when playing with leverage with this strategy.

Full Forex scalper StrategyTHis is a FOREX scalping system that can be optimized with almost all majors and crosses pairs.
Its made of multiple elements such as :
MACD
Stochastic RSI
Fast VW moving average
Slow VW moving average
Time management( forex sessions as inputs)
Rules for entry
Long
Last 2 MACD values were ascending, fast moving average is below moving average and stochastic RSI is below 30 level. At the same time we are either into London or NY session.
Short
Last 2 MACD values were descending, fast moving average is above moving average and stochastic RSI is above 70 level. At the same time we are either into London or NY
Rules for exit
WE have 2 exit possibilities: we can exit either at the end of NY/London Session or based on a TP/SL risk management calculating % in movement.
If you have any questions let me know !

MACD, EMA, Know sure thing, Chopy Market - high adaptabilityHey there :)
This is the free version of the script. The following indicators / settings are missing:
- Support and resistance zones
- dynamic textboxes for alarms when using bots (3 Commas, Alertatron, etc.)
- a table showing the current position, indicators and other important information
With this script there is the possibility to completely customize the MACD . Starting with the MACD and signal line, the histogram and the color of the histogram.
Since the Pinecoders team has previously deleted the script, I will mention the fee settings in a bit more detail:
In this script a fee of 0.01% and a slipage of 15 was used. With each trade the total capital (100%) is used with a risk reward of 1 to 1.5.
The total capital, i.e. the risk, can be changed at any time under the "Settings" tab at "Equity".
I also added an EMA , the Know sure thing indicator and the Chopy Market indicator (by TradingRush) to the script to filter out bad trades.
The EMA:
Since the EMA is very reliable and shows whether there is an upward or downward trend, it should be used with the indicators in any case. It prevents long trades in downward movements and vice versa.
The KST Indicator:
The KST indicator has a similar movement as the MACD, but is by and large a bit more time delayed. It filters out false swings of the MACD and thus prevents bad trades.
The Chopy Market Indicator by Tradingrush:
The Chopy Market indicator, which was introduced by TradingRush in one of its videos, has the ability to detect sideways markets and block zones below this line for trades by means of a fixed value (the line).
To exit the trades, I added the following options:
ATR Exits. Exits based on past candles (lowest low, highest high).
Static exits based on set percentages.
In the next days I will create a tutorial for the script, just have a look on my profile.
If you have any questions about the script, let me know.
BTC Sentiment analysis RSI 2xEMAThis is a CRYPTO correlation strategy, which is using BTC sentiment with BITFINEX long and short ratios.
WIth them we are making from one side 2 RSI, one for long and another for short. And from another side, we are going to make multiple EMA's, using the ratios for long and short.
Rules for entry
For this scenario I created a long only strategy.
The long entry condition is : we have a crossover of the rsi long ratio with rsi short ratio and long ratio from BITFINEX is above the long EMA and short ratio from BITFINEX is below short EMA.
We exit when we get the opposite condition, in this case we have a crossunder of the rsi long ratio with rsi short ratio and long ratio from BITFINEX is below the long EMA and short ratio from BITFINEX is above short EMA.
If you have any questions, let me know !

CoinruleCombinedCryptoStratUtilizes a combination of RSI and MA to determine the best time to acquire cryptocurrencies and then sell when the markets are reaching peak prices. Best followed on lower time frames. Based on a strategy of averaging down during dips then selling at peaks with the highest volume first, then slowly liquidating as the price increases in percentage of holdings.

3 RSI 6sma/ema ribbon crypto strategyThis is a very efficient swing trading strategy designed for crypto long timeframes like 2h+.
Initially we have 3 RSI .
AFter that we use them as source for 6 SMA/EMA for each RSI, 5, 30, 50, 70, 90, 100. With those we create a ribbon that we are going to use in order to check the direction of the trend.
Rules for entry:
For long : if either all the SMA/EMA's from the 2nd RSI are telling us to go long, or all the all SMA/EMA's from the 3rd rsi are telling us to go long F
For short : if either all the SMA/EMA's from the 2nd RSI are telling us to go short, or all the all SMA/EMA's from the 3rd rsi are telling us to go short
We exit when we get an opposite condition than the entry one.
Caution: this strategy has no risk management inside, so use it with caution. If you have any questions , let me know !

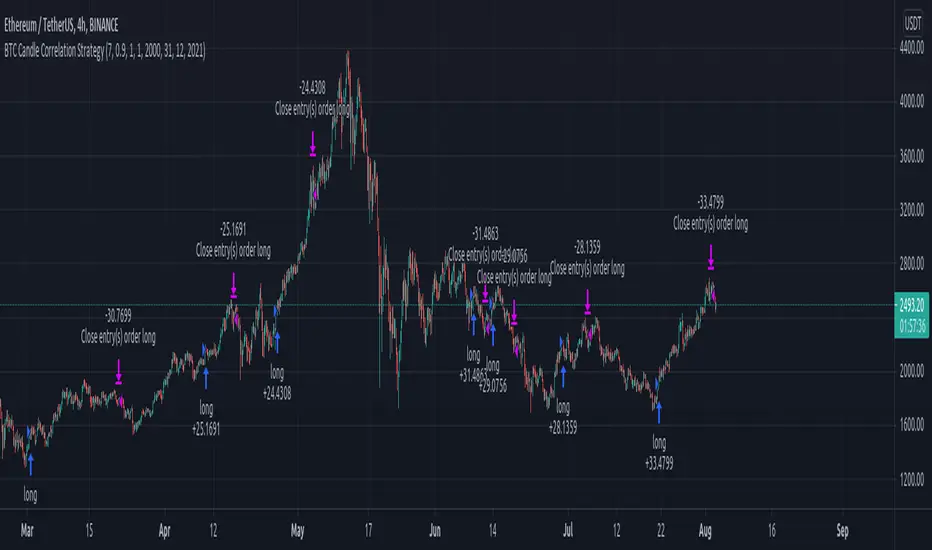
BTC Candle Correlation Strategy This is a special strategy adapted for crypto market, which instead of using the current chart candles, we use inside calculation a candle from different charts.
For best usage I recommend a big timeframe like 1-4h+.
In this case we take the high, low, open and close candles from different brokers for BTC, and with it we form up the candle that we are going to use for the logic of entry.
At the same time we are going to create an upper and lower bands using a moving average and the difference between high and low.
So in a way to put it, if BTC triggers a sell or buy order, we input instead these orders on the current chart, like in this example with ETH.
Rules for entry
For long : if we have a crossover of the btc source value with the upper band .
For short: if we have a crossunder of the btc source vale with the lower band.
For exit, we do it when we receive a different signal than the initial one.
This strategy does not have any other risk management inside, so use it with caution.
If you have any other questions, let me know !
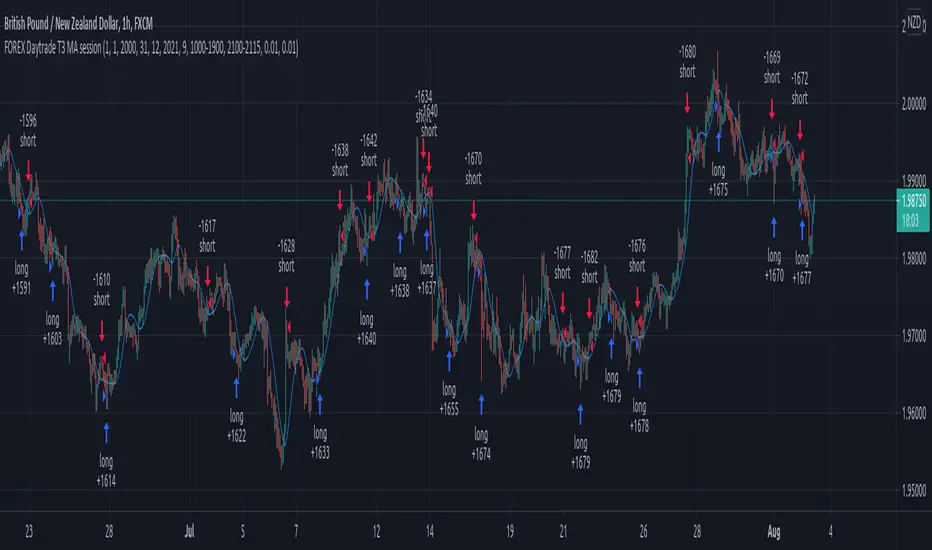
Forex Daytrade T3 MA sessionThis is a simple yet very efficient daytrading strategy for most crosses pairs, like EUR/NZD, EUR/AUD , GBP/NZD, GBP/AUD and so on.
It tends to works best with 1h and 15 min time frame charts.
Its components are :
Entry time = session that we want to trade, where we can combine for example half of London and all of NY using an hour system.
T3 Moving average
Price action.
Rules for entry
For long , we are during the hours we want to trade, current close is price is above previous high and at the same time is above moving average
For short , we are during the hours we want to trade, current close is price is below previous low and at the same time is below moving average
Rules for exit
We exit when either the opposite condition is triggered, if the hours of trading are off or based on a percentage TP/SL system movement.
For this example we use 1% movement both for TP and SL
If you have any questions, let me know !
Forex scalper 2xEMA + SRSI + MACDThis is a forex scalping strategy designed for the most liquid pairs, like major forex pairs.
Its made of
1 EMA 50
1 EMA 100
Stochastic RSI
MACD
Rules
For long :close of the candle is above moving average 50, moving average 50> moving average 100, macd histogram is positive and cross over of stochastic rsi with the oversold level.
For short :close of the candle is below moving average 50, moving average 50 < moving average 100, macd histogram is negative and cross under of stochastic rsi with the overbought level.
Exit
For exit we have take profit and stop loss using fixed pip points.
For this example on EURUSD we use 20 pips for both tp and sl
IF you have any questions let me know !

[Advanced] Hilega-Milega IndicatorThis Indicator Name is Hilega Milega, and the original Idea given by Nitish Kumar, I just coded it and add some signals for backtesting.
it works on RSI + WMA and EMA plotted.
Default Values Used :
RSI = 9
WMA = 21
EMA = 3
But i added some extra, now everyone can change the Type of WMA and EMA, also SMA for trend confirmation,
How it works ??
Buy : When RSI crossover WMA or any Type of Moving Average you choose,
Sell : When RSI crossunder WMA or any Type of Moving Average you choose,
also:
Buy : When EMA crossover WMA or any Type of Moving Average you choose,
Sell : When EMA crossunder WMA or any Type of Moving Average you choose,
also:
Buy : When RSI + EMA crossover WMA or any Type of Moving Average you choose at the Same time,
Sell : When RSI + EMA crossunder WMA or any Type of Moving Average you choose at the Same time,
and Much More...! hope so you like it,

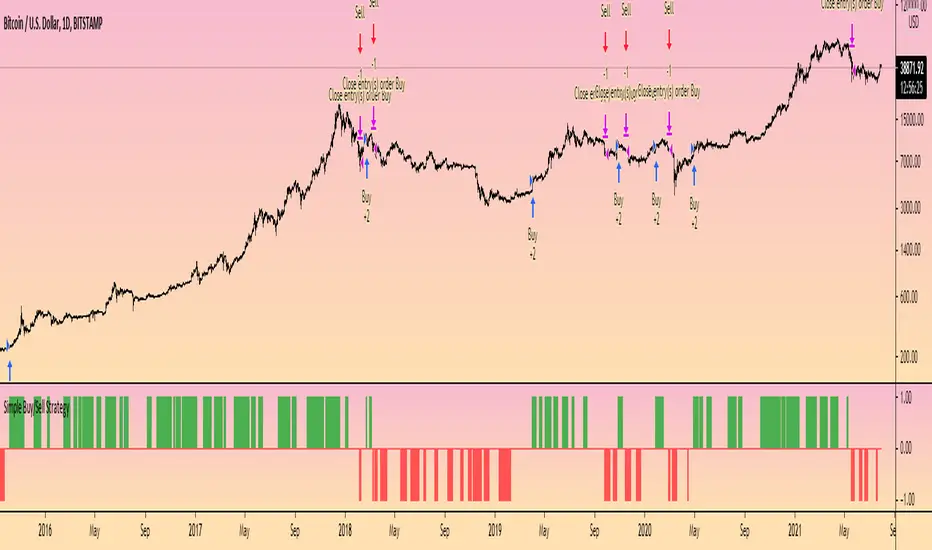
Simple Buy/Sell StrategyThis is the strategy version of the original 'Simple Buy/Sell Indicator' by @Shizaru .
The original indicator description explains the logic behind the strategy:
"The original script was posted on ProRealCode by user Doctrading.
This little and simple code allows you to draw an indicator, which show you when buy or sell conditions are met.
For "buy" conditions, I did just set :
close > MM200
close > Parabolic SAR
MACD > 0
RSI7 > 50
For "sell" conditions : the opposite.
Of course, you can set what you want, in order to test your strategies.
Of course, to be profitable, you must also set your trading rules (entry, stop loss, trailing stop, take profit, etc.)
It's only an indicator, which doesn't show entry or exit rules."
Hope this helps someone!
Multi-X by HamidBoxHello to All, introducing Multi Types Crossover strategy,
simply the best way of trading with Crossover and Crossunder Strategy, How it Works???
I added 5 types of Moving Averages,
1: Simple Moving Average ( SMA )
2: Exponential Moving Average ( EMA )
3: Weighted Moving Average ( WMA )
4: Volume Weighted Moving Average ( VWMA )
5: Relative Moving Average (RMA)
With this indicator, you can do scalping, You can trade not only with similar types of Moving Average indicators but also with different types of Moving Average indicators.
what is mean? like: Normal Condition is:
( Simple Moving Average ) Crossover to ( Simple Moving Average ), SMA x SMA
( Exponential Moving Average ) Crossover to ( Exponential Moving Average ), EMA x EMA
But we can Crossover with:
( Exponential Moving Average ) Crossover to ( Simple Moving Average ), EMA x SMA
( Simple Moving Average ) Crossover to ( Weighted Moving Average ), SMA x WMA
( Weighted Moving Average ) Crossover to ( Weighted Moving Average ), WMA x WMA
( Simple Moving Average ) Crossover to (Relative Moving Average), WMA x RMA
and also I added Moving Average ZONE in this tool, What does it work???
The zone will tell us what type of direction the market has, if the market is above the zone, it's mean we have a Bullish Trend, and if the market is below the zone, it means the market has a Bearish Trend,
so if you want to play on the safe side, never trade when the market is in Bearish Trend, and if you want to play on aggressive mood, you can skip Moving Average Zone section.

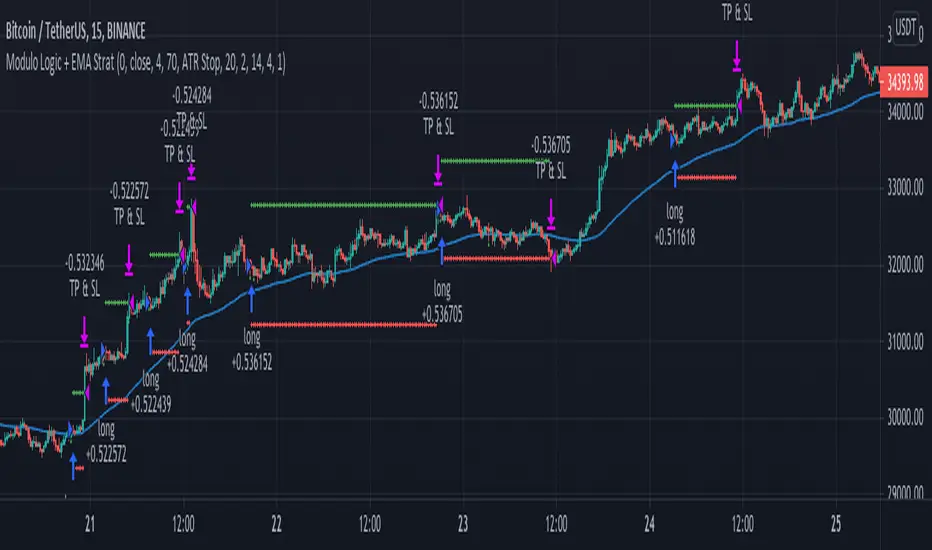
Modulo Logic + EMA StratTo understand this strategy first we need to look into the Modulo (%) operator. The modulo returns the remainder numerator
of a division's quotient (the result). If we do 5 / 3, we get 1 and 2/3 as a result, where the remainder is 2 (two thirds, in this case). This can be
used for many things, for example to determine when a number divides evenly into another number. If we divide 3/3, our result is 1,
with no remainder numerator, hence our modulo result is 0. In this strategy, we compare a given number (divisor, user defined) with the
the closing price of every candle (dividend, user defined) to determine if the result between their division is an even number.
If the answer is true, we have an entry signal. If this signal occurs below the EMA (length is defined by the user) we go short and
viceversa for longs. This logic can be reversed. In this case, the modulo works as a random-like filter for a moving average strategy
that usually struggles when the market is ranging and crosses are too often.
Money Flow Index 5 min Strategy1 - Apply the 3 period Money Flow Index indicator to the 5 minute chart, using 0 and 100 as our oversold and overbought boundaries
2 - Wait for the MFI to reach overbought levels, that indicates the presence of "big sharks" in the market. Price needs to hold up
the first two MFI overbought occurrences of the day to be considered as a bullish entry signal.*
3 - We buy when the MFI = 100 and the next candle is a bullish candle with short wicks.
4 - We place our Stop Loss below the low of the trading day and we Take Profit during the first 60 minutes after taking the trade.
The logic above can be used in a mirrored fashion to take short entries, this is a custom parameter that can be modified from
the strategy Inputs panel.
* I'm using a SMA filter to avoid buying when the price is declining. Time frame was better at 15 min according to my test.
