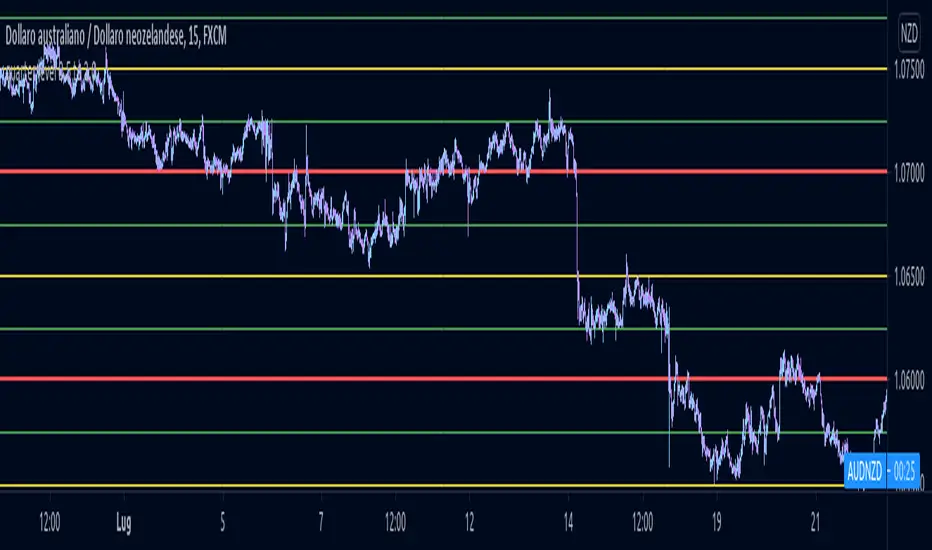
quarter level 0.5 to 2.0This script could help to see edged level for a reverse on forex, not for yen pairs and is based on quarter and round number theory.
I suggest to use it on H4 timeframe or lower to have a confermation on support or resistance level.
ピボットポイント
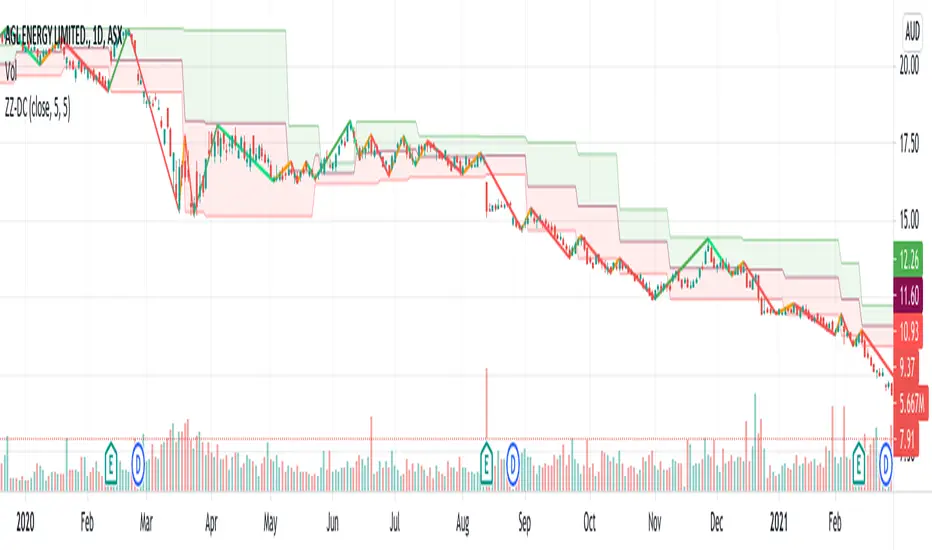
ZigZag SupertrendBack to my favourite supertrend. But, this time on the basis of zigzag pivots.
This is similar to forming supertrend based on pivot high lows - but instead of using pivot poitns, we are using zigzag pivots here.
Zigzag is derived using the same method as this script:
But, have removed labels and display options of zigzag. Older lines are also immediately deleted so that it can work well in lower timeframes without any error. Number of zigzaglines to be kept in memory depends on the parameter History
WaitForConfirmation option when selected only considers the confirmed zigzaglines and will ignore present zigzag line which is forming. This is not going to make much difference as the present zigzag line will be always opposite to low or high it formed and hence will not affect the stop loss levels or reversals.
WaitForClose is for supertrend determination. When checked uses close prices. If unchecked uses highs and lows for supertrend direction update.
ATR parameters allow you to set an adjustment below pivot high lows. This is required because support and resistence are often zones rather than single point. Hence, adds bit more wiggle room for trend continuation and delays frequent reversals on pullbacks.

SD - Average True Range v5 - DoubleSD - Average True Range - Daily Weekly Monthly Yearly v5
It gives ATR intervals as 4 hours, daily, weekly, monthly and yearly. The expectation is to fill the ATR targets within the specified ranges. It can be used to determine target points on charts with a clear direction on the train.
Unlike the previous version, it is provided to use 2 different periods in the same indicator.
Note: Developed based on the source codes of the original SD ADR indicator.

ZigZag ChannelThis is recreation of Donchian Channel - Pivot High Low indicator present here:
But, instead of traditional pivot high lows, this is based on pivots created from zigzag indicator.
This indicator is created on top of existing Zigzag indicator using lines array:
Parameter HighLowLength refers to number of zigzag lines back which can be used to calculate top and bottom of donchian channel.
PriceCatch Opensource CPRHi Friends & TradingView community.
Greetings to you.
Some traders like to use Central Pivot Range (CPR) in their chart for assessing price movement. It is usually used in combination with Pivot Levels.
Calculating CPR is a simple matter. There a few CPR scripts in the Public Library, but have the code hidden. I thought there may many users who may want to know how CPR is calculated and study it for use in their own scripts. So, here is the CPR script with the code. Use it as you please.
Note: CPR is plotted only on intra-day time-frames.
The light magenta (band) range is current day CPR.
The light blue (band) range is tomorrow's CPR projected for you today itself based on current day's price action and range.
Queries / feedback welcome.
All the best.
PS: The script is developed to the best of my ability and as with all indicators, you have to decide if it might be useful to you when adding to your chart.

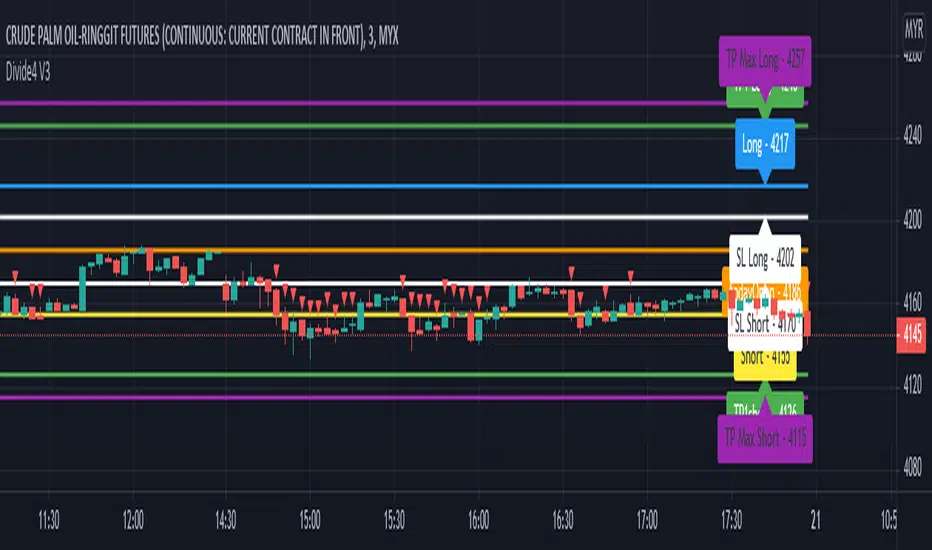
Divide4 V3This script is specially developed for the reference of Crude Palm Oil Futures (CPO) market traders.
Before using this script, traders need to know a few important things, namely:
1. Use of this script is limited to the Crude Palm Oil Futures (CPO) market only;
2. The appropriate time-frame for the purpose of using this script is a small time-frame, i.e. 1 minute to 5 minutes;
Procedures for using indicators.
1. Once the market opens, change the time-frame to 1 minute;
2. The line on the trading day will only be known after the first candle is completed, i.e. at 10.31 am;
3. Then, you can key in order if you want;
4. Let the 1 minute time-frame remain until 11 a.m. Then, you can change a larger time-frame such as 3 minutes or 5 minutes if desired.
Entry.
1. The recommended Max Entry is once Long and once Short only on the same day;
2. If the first Entry reaches Profit Target, it is not recommended to make an Entry for the second time;
3. If the first Entry is about Stop Loss, the second Entry is recommended as opposed to the first Entry.
For example, if the first Entry is Long, but does not reach Profit Target, otherwise it is about Stop Loss, then the recommended second Entry is Short, even though the price is about Entry for Long.
Long.
1. Traders can only make a purchase when the market price hits the blue line;
2. If traders hold a long position, traders can make a sale to close the long position when the price hits the green or purple line closest to the blue line;
3. On the other hand, if the price goes down again after a buy is made, traders need to make a sale to close the buy position when the price goes down to hit the white line closest to the blue line.
Short.
1. Traders can only make a sale when the market price hits the yellow line;
2. If traders hold a short position, traders can make a purchase to close the short position when the price hits the green or purple line closest to the yellow line;
3. On the other hand, if the price rises again after the sale is made, then traders need to make a purchase to close the selling position when the rising price hits the white line closest to the yellow line.
Breakout Trend Follower V2This is a variation on my other Breakout Trend Follower script. In the other script, you can use a moving average to act as a filter for your trades (i.e. if the price is below the moving average, it won't go long). After making the tool that detects trends on higher timeframes, I wanted to see if that might be a better filter than a moving average.
So this script lets you look at higher time frame trends (i.e. are there higher highs and higher lows? If so, this is an uptrend). You only take trades when you are with the trend. You have the ability to select up to two trends to act as a filter. Each trend direction is shown on a table on the chart for easy reference. The current pivot highs and lows are plotted on the chart so you can see when you might be breaking both the current timeframe's trend and higher level trends.
What I found was that in general this does not perform as well as the other strategy, but it does seem to be a lot more picky with trades. Showing higher win rates and a better profit factor. It just takes a lot less trades and the net profit isn't as good.

CPR - Daily, Weekly, Monthly and Yearly by [GSY]
This is a multi-time frame scripts for CPR .
Script draws the CPR ( TC , BC , CP), Support and Resistances (R1, R2, R3, S1, S2, S3) for Daily, Weekly, Monthly
What makes it convenient?
1. All these values are drawn on the chart for different time frames. This gives a very good visual representation of the stock behavior..
2. The settings dialog is very well organized
3. Easy selection/deselection of CPRs and pivots for different time frames
This script can be used along with another script “CPR Width Histogram for Selected timeframe by GSY” to understand the stock behavior.

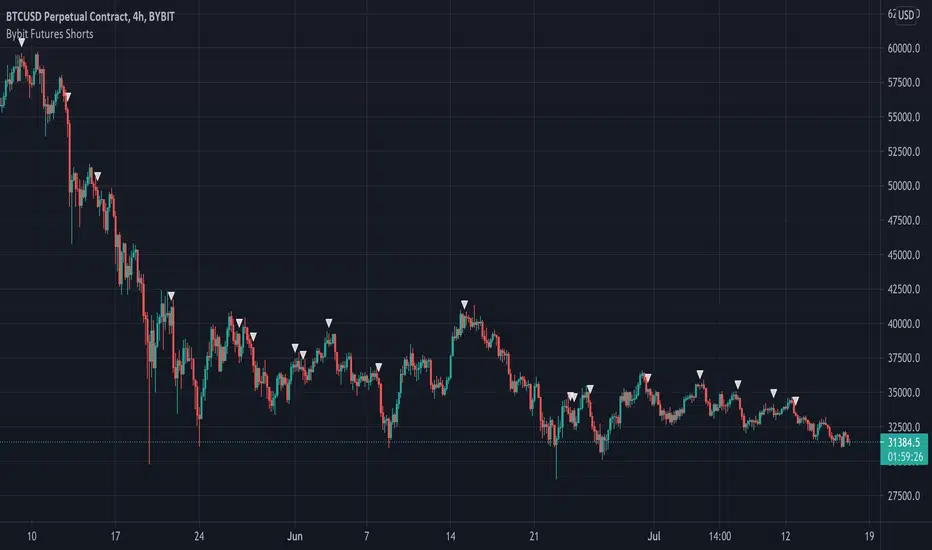
Bybit Futures ShortsThe whales love to short! This indicator emulates a strategy used by institutions to find short entries. It is designed for use on the Bybit exchange 4hr futures contracts but can be used on any timeframe on any Bybit contract. This is a great way to short with the whales. Please note this only works with Bybit.
Below is an example on 4hr chart:
Below is an example on 1hr chart:
Below is an example on Daily chart:
Good Luck!
Volume Profile / Fixed RangeHello All,
This script calculates and shows Volume Profile for the fixed range . Recently we have box.new() feature in Pine Language and it's used in this script as an example. Thanks to Pine Team and Tradingview!..
Sell/Buy volumes are calculated approximately!.
Options:
"Number of Bars" : Number of the bars that volume profile will be calculated/shown
"Row Size" : Number of the Rows
"Value Area Volume % " : the percent for Value Area
and there are other options for coloring and POC line style
Enjoy!

Pivot Weighted Moving AveragePivot points often act as magnets for price action. The Pivot Weighted Moving Average takes those important levels and integrates them as a weighting function into a moving average. Users can choose the level of weighting they would like to use; the higher the weighting level, the more influence the pivot points will have on the moving average. The Pivot Weighted Moving Average is a great tool for determining trend direction and for signaling dynamic support and resistance levels.

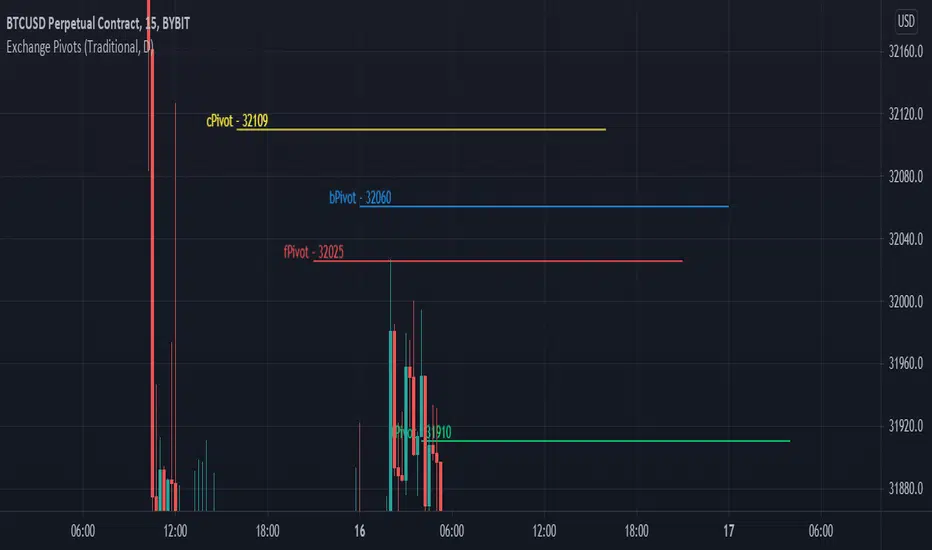
Exchange PivotsPivot points from 4 different Markets:
DailyPivot: BYBIT:BTCUSD
AsiaPivot: OKCOIN:BTCUSD
ForexPivot: FOREXCOM:BTCUSD
TradestationPivot: TRADESTATION:BTCUSD
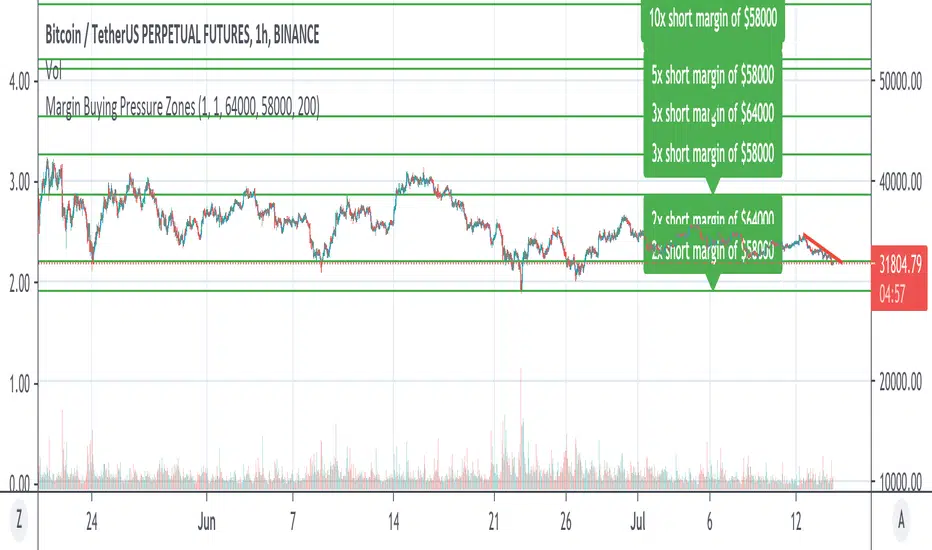
Margin Buying Pressure Zones Longs & ShortsShows the Margin Pressure Zones for longs and shorts Longs & Shorts based on 2 Base prices to be configured by you.
For definition of "Margin Pressure Zones" see: www.investopedia.com
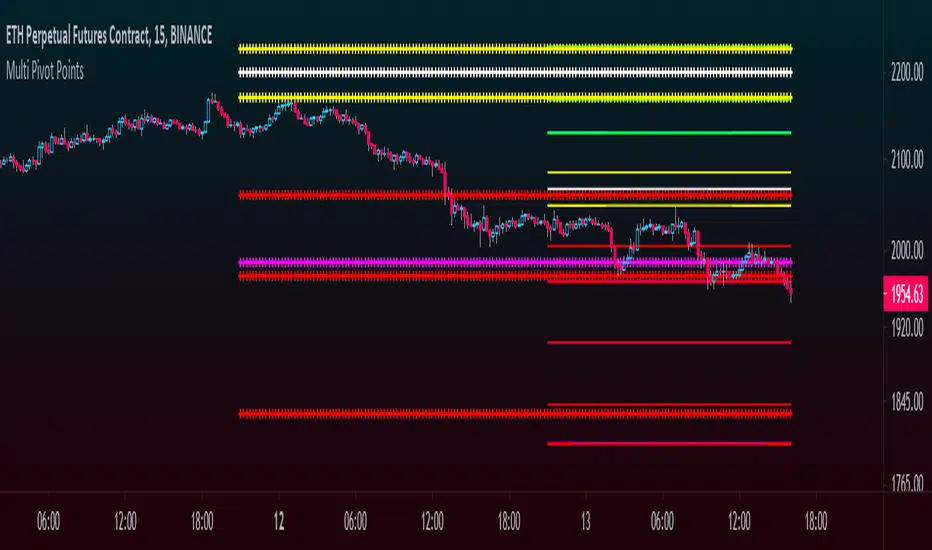
Multi Pivot Points - All in One IndicatorThis multi pivot indicator allows you to plot and overlay different types of pivot points:
-Fibonacci
-Floor Traders
-Camarilla
In addition to this, you can plot pivots from two different timeframes of your choice, for example the daily & weekly pivots, monthly & yearly, etc.
-You can select the linestyle, width and color of each pivot type for easy recognition of levels.
-You can choose to show only the current set of pivots or you can show the historical levels too.
This indicator allows traders to search for high probability targets or support and resistance zones via the confluence of both different pivot types and timeframes. These levels can work for either day traders or longer terms traders.
In the case of Fibonacci levels these can be chosen in the menu.
Enjoy!!
Auto Harmonic Patterns - Long only StrategyThis is long only strategy where entry and exits are generated based on Harmonic Patterns.
Logic used for generation of harmonic patterns is same as the below script (Double top and bottom are removed in this script):
Now to generate entry and exit signals, following rules are used:
If there is bullish pattern:
Entry : If X is between Point B and D, then use X as entry point. Else use B as entry point. Entries are managed via stop limit orders.
StopLoss : D - ( atrMult times atr)
If there is bearish pattern and useReverseTradeOnBearishPattern is selected:
Entry : D + ( atrMult times atr)
StopLoss : If X is between Point B and D, then use X as stoploss. Else use B as stoploss
If there is any existing trade while new patterns are formed, then existing stoploss and target levels are updated accordingly instead of placing new order.
Optional Profit Targets : When takeInitialProfitOnTargets is selected, minimal profit (20% of open positions) is taken based on harmonic pattern profit targets. These targets are set only based on bullish pattern recognition
First Target : Lower of A and C
Second Target : Higher of A and C
Third Target: 1.618 times AD
Example of XABCD points are shown in below picture:
Other logic involved:
Apart from stoploss generated by patterns, there is also trailing stoploss which is simply based on trailingStopAtrMult times ATR
Stoplosses, entry points and target levels are updated only if new stoploss generated either by ATR or by harmonic patterns are higher than present stoploss. If not, previous stoplosses are used.
Happy trading. Let me know your views.

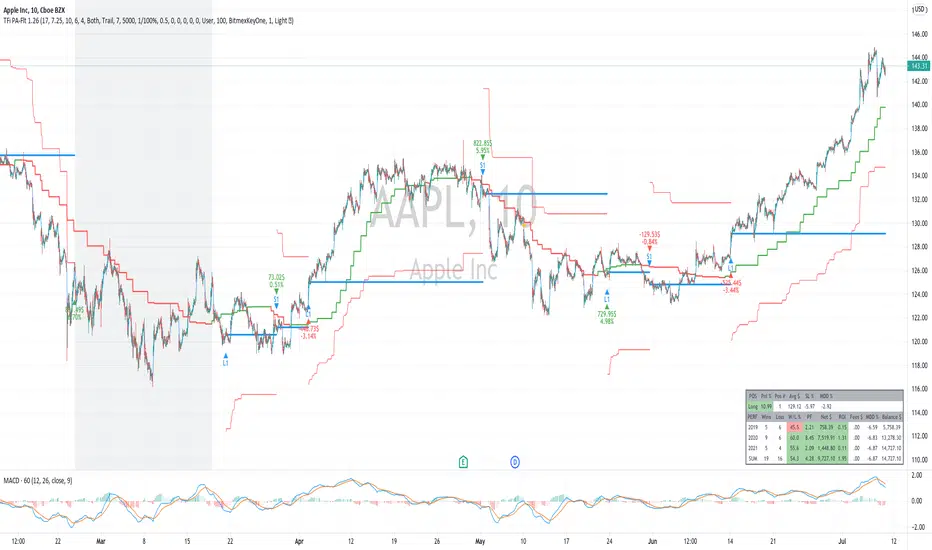
TFi Price Action Resampling Filter V1 - FULLThe script is resampling the price based on its range/price-action and creates an alternative filter to smoothen price movements.
Overview of features:
Optional stop-loss
Optional flags to control the position entry
Optional flags to control the position exit
Built-in backtesting engine with start balance, position size and pyramiding; each year will be evaluated separately
Inputs for a percentage entry and exit slippage, entry/exit and daily funding fees
Configurable alerts, which follow the exact position of the entry/exit marker
Alert messages contain predefined trading instruction to execute orders via Alertatron or TradeFab's proprietary trading server, or can be defined by the user
The script renders a performance/status table, which shows the current position status and result of the built-in trading simulation results.
It shows the following statistic values:
Current position PnL - also background turns green if position is in profit and red if in loss
Average entry price and number of positions
Current percentage distance to the optional stop-loss level
Current Maximum Draw Down
Number of wins and losses and the win/loss ratio per year and overall
Profit and loss amount, paid fees per year and overall
Profit-ratio and Maximum Draw Down per year and overall
Balance and ROI per year and overall
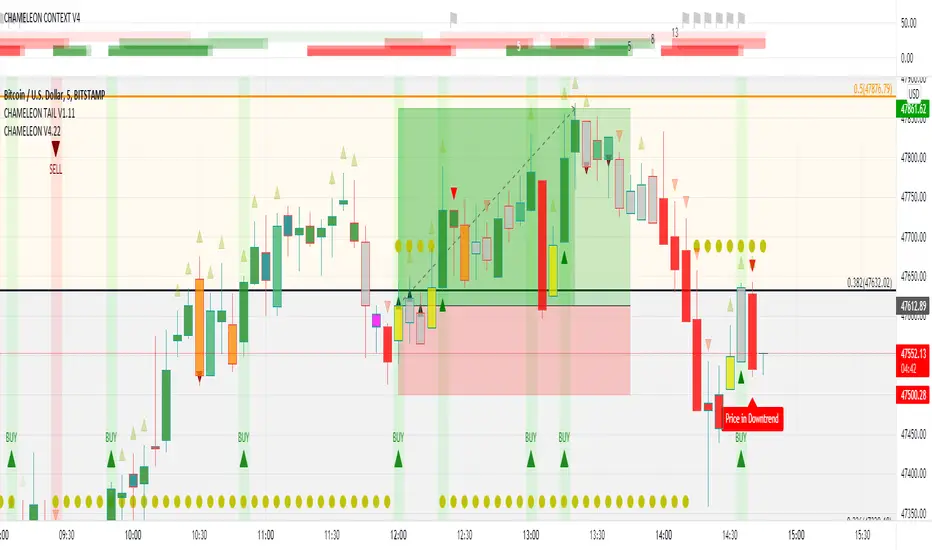
CHAMELEON V3=================
CHAMELEON:
V3 update contains more accurate conditional logic filtering
=================
A price action candle color changing indicator which adds valuable chart information on all timeframes and currency pairs AFAIK.
CHAMELEON changes the colors of the bars based on mathematical sequencing in order to identify trends and relationships between price action. This indicator suggests trade setup ideas with an acceptable probability of success especially if another filter is used such as the time resistant principles of Supply and Demand.
=================
COLOR LEGEND:
=================
MAROON candles can be excellent signals for a SHORT entry. They often act as range markers before a tradeable move down as shown, but also usually are the local top from which price recedes from quickly
FOREST GREEN candles indicate that the price is in an up trend.
RED candles indicate that the price is in an up trend.
YELLOW bars are a useful trigger to close SHORTS. They are also the first condition needed in order for a confirmed trend reversal up to be detected.
GREEN TRIANGLE UP shapes below the candle confirm the trend reversal up which was highlighted by the yellow candle.
RED TRIANGLE DOWN shapes above the candle suggests that the trend is not so strong and the stop loss should be moved up to a tighter position.
ORANGE candles help establish a local range.
ORANGE candles with a golden cross provide a clue of the direction, but are not strong enough indicators to take a trade on.
OLIVE bars are a useful trigger to close LONGS, in order to get a better entry at a lower price near to local resistance level .
MAGENTA candles help establish a local range. Unlike the ORANGE ones, these usually occur at the bottom of price structure.
TEAL Candles, indicate a High in a sequence of 5 candles. They predict a downside reversal of 1-3 bars. This is not usually an entry candle, but a possible LONG exit until the trend is clear again.
SEA GREEN candles indicate that the UP trend is weak.
GRAY signifies NO trend.
MAROON TRIANGLE DOWN shapes below the center of candle body indicates there is momentum to the downside. Use this as a filter to discourage LONG entries and also for a SHORT entry since this is a strong signal.
GREEN TRIANGLE UP shapes above the center of candle body indicates there is momentum to the upside. Use this as a filter to discourage SHORT entries.
=================
SETTINGS and ALERTS:
=================
There is a BAR 2 BAR Relationship setting which displays whether there is a simple relationship between the current bar and the previous. Bars with no Bar2Bar triangle have no relationship. So the info here would be no trend relationship, which is useful because it's not mathematically possible for a trend to start without there being a BAR 2 BAR in that direction first. Since the measurement is so short term, you wouldn't use a B2B in isolation.
The indicator has alert conditions set for the possible ENTRY candles, so you can wait for the GREEN candles on the timeframe you prefer and leave the charts until it arrives. The indicator has been tested on some FOREX markets and BTC and ETH and stands up well across all the usual timeframes.
NVME Breakout DetectorMain Description:
NVME Breakout Detector is an indicator designed for breakout traders that helps those traders simplify trading through saving their time by automatically finding appropriate high and low zones on the chart for the trader. The indicator also provides the user with alerts of newly printed zones and zones that were broken through giving a trader the confirmation to stay in a trade longer or perhaps to find a new trade position following the trend that is shown.
How To Use It?
This is a beginner and user friendly indicator that is simple to follow, firstly the user should add this script on to their charts, secondly they will see 2 generated zones (the high being in red and the low being in green), once the user identifies those zones, the user should wait for price to close past those zones to get the idea that price may want to continue in that direction.
Settings:
Use Higher Accuracy Method - This will add another condition into the zone detection algorithm causing the indicator to detect less zones but these zones will be better for accuracy.
Use Bar Close - This will add another condition into the breakout calculator and alerts, which will force the indicator to wait for the bar to close before any confirmations can take place.
Show Breakout History - This will print all the previous zones and labels for the asset you are on.
Show Breakout Labels - This will show the breakout labels next to each zone and allow the user to see how many times that zone has been broken through or if it hasn't been broken through.
Supported Assets: All Assets Supported
Will This Come With Other NVME Scripts? Yes

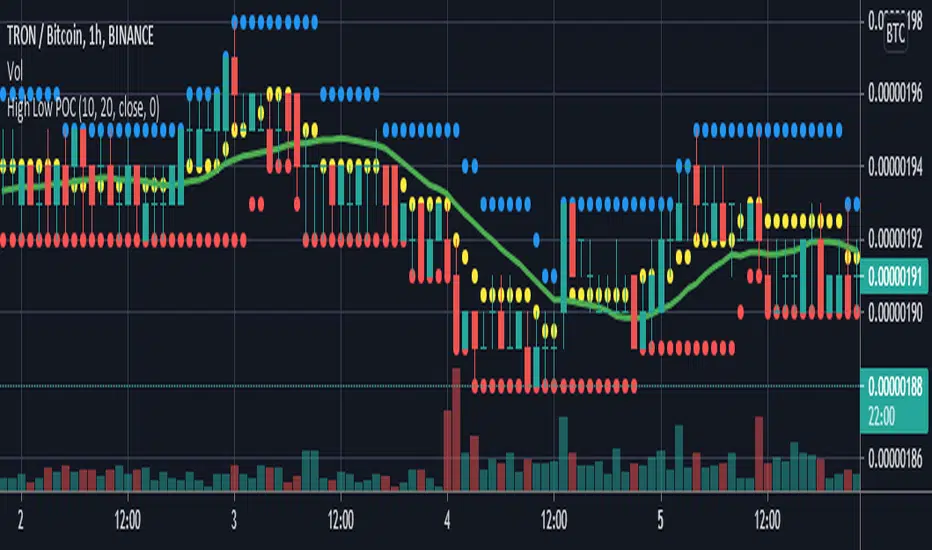
High Low POCGet centre point of highest high and lowest low from defined number of bar .
if POC above sma and price above POC then enter long .
if POC below sma and price below POC then enter short .
Planetary Aspects & Transits█ OVERVIEW
Planetary Aspects and Transits are commonly used by Astrology Traders and Gann Traders for various reasons. This script is designed to highlight these planetary aspects and transitions on your chart. You can select your favorite planet -including the sun and the moon- and also select the aspect that you would like to view and this script will highlight it on the chart. The aspects that are included to choose from are ( 0, 30, 45, 60, 72, 90, 120, 135, 144, 150, and 180 degrees ). You can also select the mode of these aspects and transits ( Heliocentric vs Geocentric ).
This script offers two running options :
1. Planet vs aspect : using this option you will be able to select a planet and an aspect and we will find/highlight all the transitions vs all the planets in that aspect.
2. Planet vs Planet : using this option you will be able to select two planet and a single aspect to view on the chart.
█ Future Plans and upgrades to this script may include :
1. Enhanced algorithm for a faster loading/processing script.
2. More future dates plotting.
And more! Feel free to contact me with any feature that you would like to see in this script
█ How to use :
1. Open the settings.
2. Choose the planet/planets, and the aspect.
3. Enable the option.
Give the script a few seconds and you should be set.
This script is coded as an addon to the Gann ToolBox package/scripts.

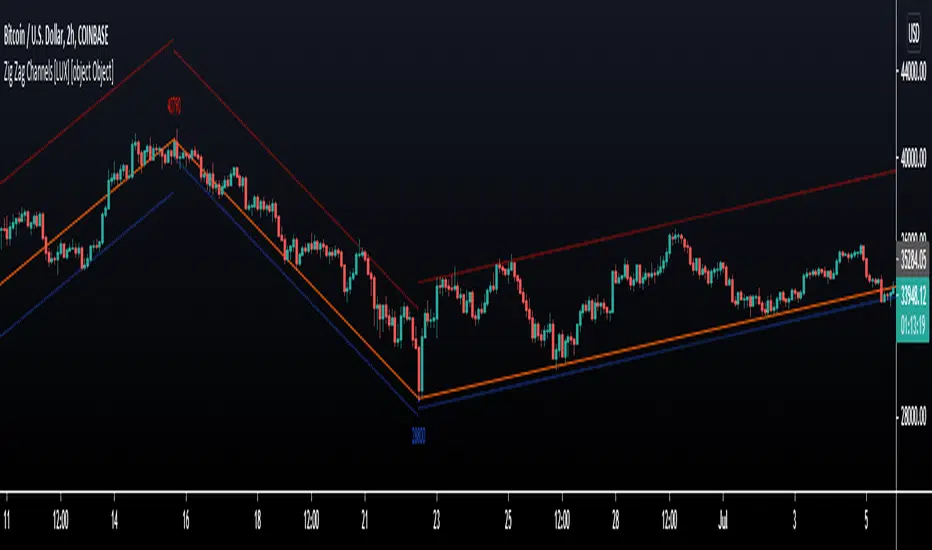
Zig Zag Channels [LuxAlgo]The Zig Zag indicator is a useful indicator when it comes to visualizing past underlying trends in the price and can make the process of using drawing tools easier. The indicator consists of a series of lines connecting points where the price deviates more than a specific percentage from a maximum/minimum point ultimately connecting local peaks and troughs.
This indicator by its very nature backpaints by default, meaning that the displayed components are offset in the past.
🔶 USAGE
The Zig Zag indicator is commonly used to returns points of references for the usage of specific drawing tools, such as Fibonacci retracements, fans, squares...etc.
The proposed indicator estimates peaks and troughs by using rolling maximums/minimums with a window size determining their significance. This window size approach allows us to have an indicator that works with a certain regularity no matter the scale of the price, something the percentage-based approach struggles with. Additionally, one upper and lower extremity are displayed, highlighting the price point that deviates the most from the Zig Zag lines.
A common usage also includes the easy determination of Elliot wave patterns in the price.
The Zig Zag indicator above highlights a downtrending motive wave.
🔹 Extremities
The novel approach taken by this Zig Zag indicator is the addition of two extremities derived from the distance between the price and the Zig Zag line, thus returning channels. It is uncommon seeing extremities in Zig Zag indicators since the line connecting peaks and troughs has rarely any other utility than seeing trend variations with more clarity and is not meant to provide an accurate estimate of underlying local trends in the price.
This channel can be useful to study the potential relationship between underlying trends and the Zig Zag line. A low width between the Zig Zag and the upper extremity indicates price variations mostly located below the Zig Zag while equal width indicates more linear trends.
When the indicator is extended to the last line, the extremities provide potential support and resistances, thus making this indicator able to forecast price variations.
🔶 SETTINGS
Length: Determines the significance of the detected peaks and troughs.
Extend To Last Bar: Extend the most recent line to the most recent closing price value.
Show Extremities: Displays the extremities.
Show Labels: Display labels highlighting the high/low prices located at peaks and troughs.
🔹 Style
Upper Extremity Color: Color of the upper extremity displayed by the indicator.
Zig Zag Color: Color of the ZigZag lines.
Lower Extremity Color: Color of the lower extremity displayed by the indicator.
Simple PivotsSuper Simple Pivots, based on
and adapted from
Will take a low or high point and compare left and right, if its the lowest or highest respectively, a line is drawn forward until another point meets the criteria
The lookback period will delay the formation of new pivots. In the original two indicators, the pivot lines would stop drawing. I have added a line extension from the most recent pivots forward to indicate whether the current market price exceeds or is within the recent pivot point ranges. If the market price is above or below the high or low pivots respectively, the line will become solid. Otherwise, the pivot extension lines will be dotted.
There is an option to place price labels below the historical pivot points. Default is disabled because it clutters the chart.
Removed all alerts and MA from the original two indicators to improve speed.
Let me know if you have any questions!
gkjch

GANN Square Of 9 PivotsGANN Square Of 9 Pivots
How to use for Intraday ?
Method 01 (From 9:05 am to 9:15 am or pre-open market)
Take the Weighted Average Price or Volume Weighted Average Price (VWAP) or Time Weighted Average Price (TWAP) of any stock or index.
You can use TWAP for Index as volume is not available.
Method 02 (From 9:05 am to 9:15 am or pre-open market)
Take the Last Traded Price (LTP) of index or stock
Method 03 (After 9:30 am or after 1st 15 min)
Only take Last Traded Price (LTP) of stock or index
Ideal Time
15min to 1hr after market opens
Indicator Features
Lines
Gray Dashed Line: Calculation Price
Teal Solid Line: Long Above
Red Solid Line: Short Below
3 Teal Dotted Lines: Bullish Targets 1, 2 & 3
3 Red Dotted Lines: Bearish Targets 1, 2 & 3
Labels
1st Numbers: Price
2nd Numbers in (): % change from LTP to that Level
For Index
As VWAP is not available for Index, TWAP (Time Weighted Average Price) values can be used for Index.
Custom Price Inputs
Price of your choice can be given manually by selecting:
Source > Custom
Enter Price > (type the price)
Timeframe
Higher timeframes like Weekly, Monthly can be changed using Timeframe Option
For More Reading
Reading: traderji.com/community/threads/intraday-trading-using-gann-calculator.39185/#post-419677
Calculator: stockmaniacs.net/freebies/free-tools/gann-square-of-9-calculator/
