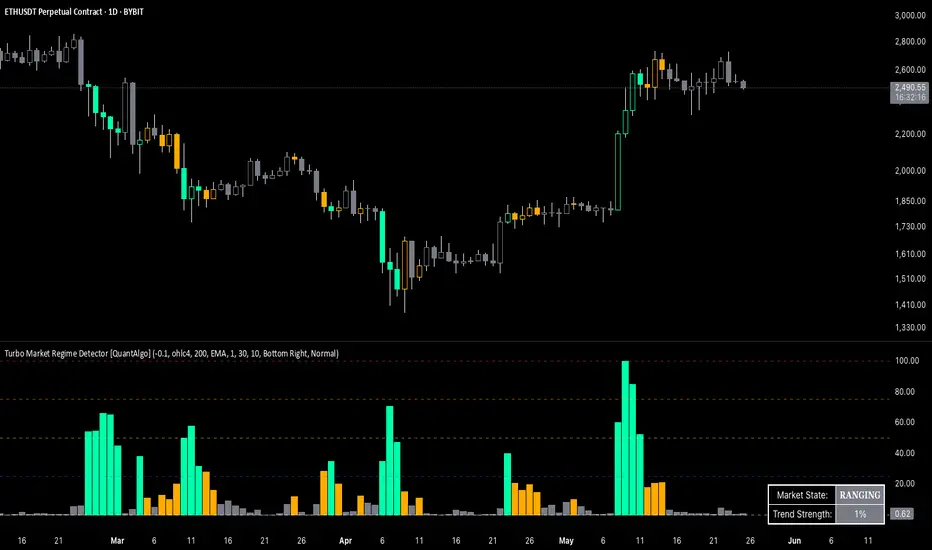
Turbo Market Regime Detector [QuantAlgo]The Turbo Market Regime Detector is a market state classification system that combines volatility-adaptive filtering with slope analysis to identify and categorize market regimes. It helps traders and investors distinguish between trending and ranging market conditions across different timeframes and asset classes.
🟢 Technical Foundation
The Turbo Market Regime Detector employs a multi-layered analytical approach to market regime identification, incorporating:
Volatility-Adaptive Regime Filter (VARF) : Uses dynamic alpha calculation based on price volatility and range to create an adaptive filter that responds to changing market conditions
Slope Analysis : Calculates the absolute slope of the VARF curve and applies customizable moving average smoothing to determine trend strength and market regime classification
Normalized Histogram : Transforms raw slope data into percentage-based metrics (0-100%) for interpretation of market conditions
Multi-Threshold Classification System : Implements user-defined thresholds to categorize markets into Strong Trend, Weak Trend, and Ranging regimes
The indicator processes price data through mathematical operations including volatility adjustment, slope normalization, and statistical range analysis. This creates a regime detection system that adapts to market volatility while maintaining classification consistency across different timeframes and asset classes.
🟢 Key Features & Signals
1. Market Regime Classification
The indicator presents market conditions through a normalized histogram that distinguishes between three distinct market states:
1/ Strong Trend Regime: When the histogram exceeds the strong trend threshold (default 30%), indicating directional market movement with sustained momentum
2/ Weak Trend Regime: When the histogram falls between weak trend (default 10%) and strong trend thresholds, representing transitional market conditions with moderate directional bias
3/ Ranging Regime: When the histogram remains below the weak trend threshold, signaling consolidation periods with limited directional movement
This classification system provides insights into:
→ Current market state with percentage-based quantification
→ Regime transitions and their timing
→ Market momentum strength across different timeframes
2. Visual Feedback System
The indicator features multiple visualization options for market analysis:
Background Coloring: Optional chart background coloring that applies regime-based colors to both the indicator pane and main price chart for visual context
Bar Coloring: Price bar coloring based on current market regime, providing visual feedback on market conditions
Reference Lines: Horizontal reference lines at 25%, 50%, 75%, and 100% levels for percentage assessment and historical comparison
Information Table: Real-time status display showing current market state and trend strength percentage with customizable positioning and sizing options
3. Alert and Notification System
The indicator generates alerts for regime transitions:
State Change Alerts: Notifications triggered when the market transitions between regime states (Strong Trend ↔ Weak Trend ↔ Ranging)
Specific Regime Entry Alerts: Individual alert conditions for entering Strong Trend, Weak Trend, or Ranging regimes for targeted trading strategies
Customizable Alert Messages: Pre-formatted alert messages including exchange and ticker information for context and decision-making
🟢 Practical Usage Guidelines
→ Regime-Based Strategy Selection: Use the indicator to identify potential trading strategies - trend-following during Strong Trend regimes, mean-reversion during Ranging periods, and adjusted position sizing during Weak Trend transitions
→ Multi-Timeframe Analysis: Apply the indicator across different timeframes to understand market regime hierarchy and identify confluence between short-term and long-term market states
→ Threshold Optimization: Adjust regime thresholds based on market volatility and asset characteristics - lower thresholds for more sensitive regime detection, higher thresholds for more definitive regime changes
🟢 Configuration Tips
VARF settings optimization:
→ Lower thresholds (-0.3 to -0.5) for more responsive regime detection in volatile markets
→ Higher thresholds (-0.1 to 0.1) for smoother signals in stable market conditions
→ Enable adaptive VARF for automatic volatility adjustment across different market cycles
Slope analysis parameter tuning:
→ Shorter MA lengths (100-200) for faster regime transition signals
→ Longer MA lengths (300-500) for more stable regime identification
→ Adjust sensitivity multiplier based on desired responsiveness vs. stability balance
Regime interpretation framework:
→ Strong Trend regimes for momentum-based strategies and trend following
→ Ranging regimes for mean-reversion and support/resistance trading
→ Weak Trend periods for reduced position sizing and cautious market approach
Complementary analysis integration:
→ Volume analysis for regime change confirmation
→ Support/resistance levels for entry/exit timing within regime contexts
→ Price action patterns for validation of regime-based trading decisions
→ Economic calendar events that may influence regime transitions
Ranging
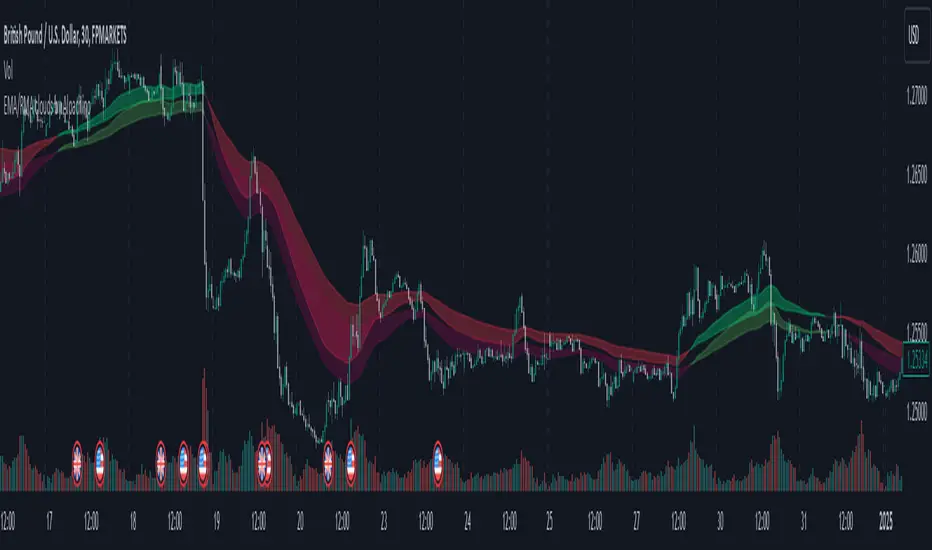
EMA/RMA clouds by AlpachinoRE-UPLOAD
The indicator is designed for faster trend determination and also provides hints about whether the trend is strong, weaker, or if a range is expected.
It consists of an exponential moving average (EMA) and a slower smoothed moving average (RMA). I chose these because EMA is the fastest and is respected by the market, while I discovered through practice that the market often respects RMA, and in some cases, even more than EMA. Their combination is necessary because I want to take advantage of the best qualities of both averages. Displaying averages based solely on the close values creates a simple line that the market might respect. However, this is often not the case. Market makers know that many traders still believe in the theory that closing above/below an EMA signals a valid new trend. They commonly apply this belief to EMA200. Traders think that if the market closes below EMA, it signals a downtrend. That’s not necessarily true. This misconception often traps inexperienced traders.
For this reason, my indicator does not include a separate line.
I use what are called envelopes. In other words, for both EMA and RMA, the calculation uses the high and low of the selected period, which can be chosen as an input in the indicator.
Why did I choose high and low?
To stabilize price fluctuations as much as possible, especially to allow enough space for the price to react to the moving average. This reaction occurs precisely between the high and low.
Modes:
EMA Cloud – This is the most common envelope in terms of averages. It shows the best reactions with a period of 50.
What should you observe: the alignment of the envelope or its slope.
Usage:
Breakouts through the entire envelope tend to be strong, which signals that the trend may change. However, what interests you most is that the first test of the envelope after a breakout is the most successful entry point for trades in the breakout direction.
In an uptrend, the first support will be the high of the envelope, and the second (let’s call it the "ultimate support") will be the low of the envelope.
If, during an uptrend, the market closes below the low, be cautious, as the trend may reverse.
If the envelope is broken, trade the retest of the envelope.
In general, if the price is above the envelope, focus on long trades; if it’s below the envelope, focus on short trades.
Double Cloud – Since we already know that highs and lows are more relevant for price respect, I utilized this in the double cloud. Here, I use calculations for EMA and RMA highs and EMA and RMA lows.
The core idea is that since the price often reacts more to RMA than EMA, I wanted to eliminate attempts by market makers to lure you into incorrect directions. By creating more space for the price to react to the highs or lows, I made the cloud fill the area between EMA and RMA highs. This serves as the last zone where the price can hold. If the price breaks above this high cloud during a return, this doesn’t happen randomly—you should pay attention, as it’s likely signaling a range or a trend change.
The same applies to the low cloud for EMA and RMA.
The advantage of the double cloud is that you can see two clouds that may move sideways. This can resemble two walls—and they really act as such.
Usage:
Let’s say we have a downtrend. The market seems to be experiencing a downtrend exhaustion. Here's the behavior you might observe:
The price returns to the EMA/RMA low; the first reaction may still have some strength, but each subsequent return will move higher and higher into the cloud with increasingly smaller rejections downward. This indicates the absorption of selling pressure by bullish pressure. Eventually, the price may close above the cloud, significantly disrupting the downtrend and potentially signaling a reversal.
A confirmation of the reversal is usually seen with a retest of the cloud and a bounce upward into an uptrend.
The second scenario, which you’ll often see, involves sharp and significant moves through both envelopes. This kind of move is the strongest signal of a trend change. However, do not jump into trades immediately—wait for the first retest, which is usually successful. Additional tests may not work, as the breakout might not signify a trend change but rather a range.
When the clouds are far apart, it signals a weak trend or that the market is in a range. You will see that this is generally true. When the clouds cross or overlap, their initial point of contact signals the start of a stronger trend. The steeper the slope, the stronger the trend.
Weighted Average Strength Index (WASI)Weighted Average Strength Index (WASI)
The Weighted Average Strength Index (WASI) is a variation of the standard RSI. It uses the Weighted Moving Average (WMA) instead of the Running Moving Average (RMA), making it more responsive to recent price changes. The hypothesis is that this weighted calculation might better capture momentum shifts, providing traders with more timely insights.
How to Use:
Backtest WASI on your preferred assets and timeframes to evaluate its effectiveness for your strategy.
Use for trend following or mean reversion :
- Overbought/Oversold (OB/OS) levels can signal potential mean-reversion opportunities.
- Midline (50 level) crossovers can be used for trend-following strategies.
- WASI and its moving average (MA) crossovers offer additional trend-following or reversal signals.
Parameters and Their Functions:
WASI Length: Determines the number of periods for WASI calculation. A longer length smooths the indicator but increases lag, while a shorter length makes it more sensitive. (When in doubt, go longer).
Source: The price source for the calculation (e.g., close, open, high, or low).
MA Type: Specifies the type of moving average applied to the WASI (options include SMA, EMA, WMA, HMA, and others).
MA Length: The number of periods for the moving average used on the WASI. Higher will lead to a smoother moving average.
Indicator Features:
Dynamic OB/OS Levels: Default overbought (70) and oversold (30) levels help identify potential reversal zones.
Midline Crossover: WASI crossing above or below the 50 level may indicate a trend shift.
WASI-MA Crossover: Crossovers between WASI and its moving average can signal trend-following or mean-reversion opportunities.
Disclaimer:
This indicator is a tool for analysis and should be used in conjunction with other forms of analysis or confirmation. Past performance does not guarantee future results.

Z-Score RSI StrategyOverview
The Z-Score RSI Indicator is an experimental take on momentum analysis. By applying the Relative Strength Index (RSI) to a Z-score of price data, it measures how far prices deviate from their mean, scaled by standard deviation. This isn’t your traditional use of RSI, which is typically based on price data alone. Nevertheless, this unconventional approach can yield unique insights into market trends and potential reversals.
Theory and Interpretation
The RSI calculates the balance between average gains and losses over a set period, outputting values from 0 to 100. Typically, people look at the overbought or oversold levels to identify momentum extremes that might be likely to lead to a reversal. However, I’ve often found that RSI can be effective for trend-following when observing the crossover of its moving average with the midline or the crossover of the RSI with its own moving average. These crossovers can provide useful trend signals in various market conditions.
By combining RSI with a Z-score of price, this indicator estimates the relative strength of the price’s distance from its mean. Positive Z-score trends may signal a potential for higher-than-average prices in the near future (scaled by the standard deviation), while negative trends suggest the opposite. Essentially, when the Z-Score RSI indicates a trend, it reflects that the Z-score (the distance between the average and current price) is likely to continue moving in the trend’s direction. Generally, this signals a potential price movement, though it’s important to note that this could also occur if there’s a shift in the mean or standard deviation, rather than a meaningful change in price itself.
While the Z-Score RSI could be an insightful addition to a comprehensive trading system, it should be interpreted carefully. Mean shifts may validate the indicator’s predictions without necessarily indicating any notable price change, meaning it’s best used in tandem with other indicators or strategies.
Recommendations
Before putting this indicator to use, conduct thorough backtesting and avoid overfitting. The added parameters allow fine-tuning to fit various assets, but be careful not to optimize purely for the highest historical returns. Doing so may create an overly tailored strategy that performs well in backtests but fails in live markets. Keep it balanced and look for robust performance across multiple scenarios, as overfitting is likely to lead to disappointing real-world results.

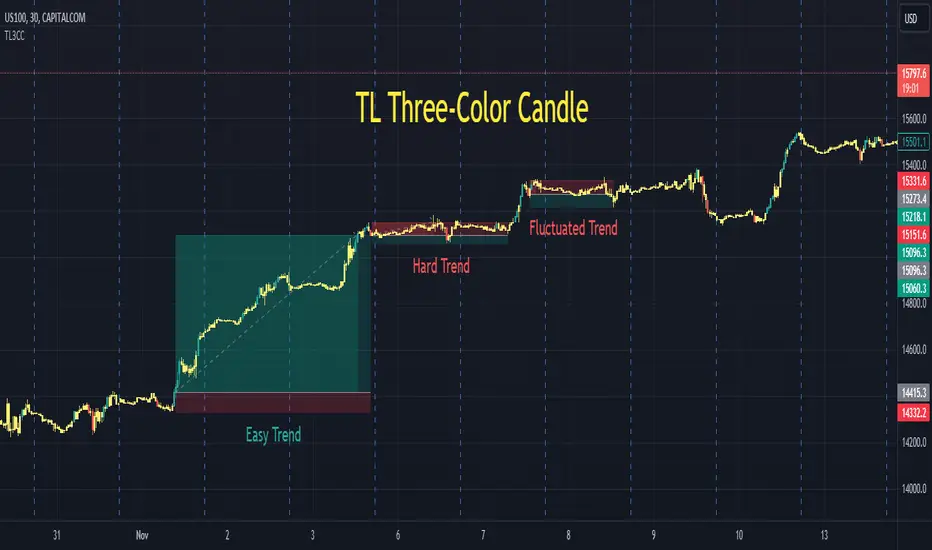
TL Three-Color CandleA traditional candle only has two colors, either green or red. A TL candle goes one step further, it has three colors: green for bullish (perfectly bullish), red for bearish (perfectly bearish), and yellow for ranging (wake-up, sleeping). A green TL candle means that its close is not only higher than its open but also higher than previous close, previous open and especially previous high, among other conditions. In the other extreme, a red TL candle indicates that its close is not only lower than its open but also lower than previous close, previous open and especially lower than previous low, among other conditions. TL candle does its best to tackle the trap of going against the trend: short when the price seems to be high in an uptrend or buy when the price seems to be low in a downtrend.
Parameters:
Volume Active Percentile % , Min Height Percentile of Bullish/Bearish Candle % . (Intraday)
Back Two Candles . (Intraday, day and above)
Usage:
After adding TL3CC to the chart, find Visual Order or Object Tree and bring TL3CC forward to be above the chart candle.
While a bullish trend includes green and yellow TL candles, a bearish trend includes red and yellow ones. It is the best to enter after the first bullish/bearish TL candle of each trend. It is extremely important, never ever try to go against TL candle.
There are many cases when red and green TL candles are twisted and we could have profit in both directions. It is the time that market is fluctuating strongly. We enter when TL candle has one color, but it changes to the opposite color after that as the price pulls back. In those cases, be calm and patient to wait for the first reversal to exit, it should come.
Markets: Developed and tested on: US100. Timeframes: Developed and tested on: 30m.
Range Detector [LuxAlgo]The Range Detector indicator aims to detect and highlight intervals where prices are ranging. The extremities of the ranges are highlighted in real-time, with breakouts being indicated by the color changes of the extremities.
🔶 USAGE
Ranging prices are defined by a period of stationarity, that is where prices move within a specific range.
Detecting ranging markets is a common task performed manually by traders. Price breaking one of the extremities of a range can be indicative of a new trend, with an uptrend if price breaks the upper range extremity, and a downtrend if price breaks the lower range extremity.
Ranges are highlighted as zones and are set retrospectively, that is the starting point of a range is offset in the past. The exact moment a range is detected is highlighted by a gray background color. The average between the maximum/minimum of a zone is also highlighted as a dotted line and is also set retrospectively.
The range extremities are set in real-time, blue extremities indicate the range extremities were not broken, green extremities indicate that price broke the upper range extremity, while red extremities indicate price broke the lower range extremity.
Extremities are extended until a new range is detected, allowing past ranges extremities can be used as future support/resistances.
🔶 DETAILS
The detection algorithm used to detect ranges tests if all the prices within a user-set window are all within two extremities. These extremities are determined by the mean of the detection window plus/minus an ATR value.
When a new range is detected, the script checks if this new range overlaps with a previously detected range, if this is the case, both ranges are merged into one; updating the extremities of the previous range.
This can be observed with the real-time extremities changing within a highlighted zone.
🔶 SETTINGS
Minimum Range Length: Minimum amount of bars needed to detect a range.
Range Width: Multiplicative factor for the ATR used to detect new ranges. Lower values detect ranges with a lower width. Using higher values might return false positives.
ATR Length: ATR length used to determine the range width.

Moving Average-TREND POWER v2.0-(AS)HELLO:
-This indicator is a waaaay simpler version of my other script - Moving Average-TREND POWER v1.1-(AS).
HOW DOES IT WORK:
-Script counts number of bars below or above selected Moving Average (u can se them by turning PLOT BARS on). Then multiplies number of bars by 0.01 and adds previous value. So in the uptrend indicator will be growing faster with every bar when price is above MA. When MA crosess price Value goes to zero so it shows when the market is ranging.
If Cross happens when number of bars is higher than Upper threshold or below Lower threshold indicator will go back to zero only if MA crosses with high in UPtrend and low in DNtrend. If cross happens inside THSs Value will be zero when MA crosses with any type of price source like for example (close,high,low,ohlc4,hl etc.....).This helps to get more crosess in side trend and less resets during a visible trend
HOW TO SET:
Just select what type of MA you want to use and Length. Then based on your preference set values of THSs'
OTHER INFORMATIONS:
-Script was created and tested on EURUSD 5M.
-For bigger trends choose slowerMAs and bigger periods and the other way around for short trends (FasterMAs/shorter periods)
-Below script code you can find not used formulas for calculating indicator value(thanks chat GPT), If you know some pinescript I encourage you to try try them or maybe bulid better ones. Script uses most basic one.
-Pls give me some feedback/ideas to improve and check out first version. Its way more complicated for no real reason but still worth to take a look'
-Also let me know if you find some logical errors in the code.
Enjoy and till we meet again.

Moving Average - TREND POWER v1.1- (AS)0)NOTE:
This is first version of this indicator. It's way more complicated than it should be. Check out Moving Average-TREND POWER v2.1-(AS), its waaaaay less complicated and might be better.Enjoy...
1)INTRODUCTION/MAIN IDEA:
In simpliest form this script is a trend indicator that rises if Moving average if below price or falling if above and going back to zero if there is a crossover with a price. To use this indicator you will have to adjust settings of MAs and choose conditions for calculation.
While using the indicator we might have to define CROSS types or which MAs to use. List of what cross types are defined in the script and Conditiones to choose from.The list will be below.
2) COMPOSITION:
-MA1 can be defined by user in settings, possible types: SMA, EMA, RMA, HMA, TEMA, DEMA, LSMA, WMA.
-MA2 is always ALMA
3) OVERLAY:
Default is false but if you want to see MA1/2 on chart you can change code to true and then turn on overlay in settings. Most plot settings are avalible only in OV=false.
if OV=true possible plots ->MA1/2, plotshape when choosen cross type
if OV=false -> main indicator,TSHs,Cross counter
4)PRESETS :
Indicator has three modes that can be selected in settings. First two are presets and do not require selecting conditions as they set be default.
-SIMPLE - most basic
-ABSOLUTE - shows only positive values when market is trending or zero when in range
-CUSTOM - main and the most advanced form that will require setting conditions to use in calculating trend
4.1)SIMPLE – this is the most basic form of conditions that uses only First MA. If MA1 is below selected source (High/Low(High for Uptrend and Low for DNtrend or OHLC4) on every bar value rises by 0.02. if it above Low or OHLC4 it falls by 0.02 with every bar. If there is a cross of MA with price value is zero. This preset uses CROSS_1_ULT(list of all cross types below)
4.2) ABSOLUTE – does not show direction of the trend unlike others and uses both MA1 and MA2. Uses CROSS type 123_ULT
4.3) CUSTOM – here we define conditions manually. This mode is defined in parts (5-8 of description)
5)SETTINGS:
SOURCE/OVERLAY(line1) – select source of calculation form MA1/MA2, select for overlay true (look point 3)
TRESHOLDS(line2). – set upper and lower THS, turn TSHs on/off
MA1(line3) – Length/type of MA/Offset(only if MA type is LSM)
MA2(line4) – length/offset/sigma -(remember to set ma in the way that in Uptrend MA2MA1 in DNtrend)
Use faster MA types for short term trends and slower types / bigger periods for longer term trends, defval MA1/2 settings
are pretty much random so using them is not recomended.
CROSSshape(line5) – choose which cross type you want to plot on chart(only in OV=true) or what type you want to use in counting via for loops,
CROSScount(line6) – set lookback for type of cross choosen above
BOOLs in lines 5 and 6 - plotshape if OV=true/plot CROSScount histogram (if OV=false)
Lines 7 and 8 – PRESET we want to use /SRC for calculation of indicator/are conditions described below/which MAs to use/Condition for
reducing value t 0 - (if PRESET is ABSOLUTE or SIMPLE only SRC should be set(Line 8 does not matter if not CUSTOM))
5)SOURCE for CONDS:
Here you can choose between H/L and OHLC. If H/L value grow when MAlow. If OHLC MAOHLC. H/L is set by default and recommended. This can be selected for all presets not only CUSTOM
6)CROSS types LIST:
“1 means MA1, 2 is MA2 and 3 I cross of MA1/MA2. L stands for low and H for high so for example 2H means cross of MA2 and high”
NAME -DEFINITION Number of possible crosses
1L - cross of MA1 and low 1
1H - cross of MA1 and high 1
1HL - cross of MA1 and low or MA1 and high 2 -1L/1H
2L - cross of MA2 and low 1
2H - cross of MA2 and high 1
2HL - cross of MA2 and low or MA1 and high 2 -2L/2H
12L - cross of MA1 and low or MA2 and low 2 -1L/2L
12H - cross of MA1 and high or MA2 and high 2 -1H/2H
12HL - MA1/2 and high/low 4 -1H/1L/2H/2L
3 -cross of MA1 and MA2 1
123HL -crosses from 12HL or 3 5 -12HL/3
1_ULT - cross of MA1 with any of price sources(close,low,high,ohlc4 etc…)
2_ULT - cross of MA2 with any of price sources(close,low,high,ohlc4 etc…)
123_ULT – all crosses possible of MA1/2 (all of the above so a lot)
7)CRS CONDS:
“conditions to reduce value back to zero”
>/< - 0 if indicator shows Uptrend and there’s a cross with high of selected MA or 0 if in DNtrend and cross with low. Better for UP/DN trend detection
ALL – 0 if cross of MA with high or low no matter the trend, better for detecting consolidation
ULT – if any cross of selected MA, most crosses so goes to 0 most often
8)MA selection and CONDS:
-MA1: only MA1 is used,if MA1 below price value grows and the other way around
MA1price =-0.02
-MA2 – only MA2 is used, same conditions as MA1 but using MA2
MA2price =-0.02
-BOTH – MA1 and MA2 used, grows when MA1 if below, grows faster if MA1 and MA2 are below and fastest when MA1 and MA2 are below and MA2price=-0.02
-MA1 and MA2 >price=-0.03
-MA1 and MA2 ?price and MA2>MA1=-0.04
9)CONDITIONS SELECTION SUMMARRY:
So when CUSTOM we choose :
1)SOURCE – H/L or OHLC
2)MAs – MA1/MA2/BOTH
3)CRS CONDS (>/<,ALL,ULT)
So for example...
if we take MA1 and ALL value will go to zero if 1HL
if MA1 and >/< - 0 if 1L or 1H (depending if value is positive or negative).(1L or 1H)
If ALL and BOTH zero when 12HL
If BOTH and ULT value goes back to zero if Theres any cross of MA1/MA2 with price or cross of MA1 and MA2.(123_ULT)
If >/< and BOTH – 0 if 12L in DNtrend or 12H if UPtrend
10) OTHERS
-script was created on EURUSD 5M and wasn't tested on different markets
-default values of MA1/MA2 aren't optimalized so do not
-There might be a logical error in the script so let me know if you find it (most probably in 'BOTH')
-thanks to @AlifeToMake for help
-if you have any ideas to improve let me know
-there are also tooltips to help

True Trend Oscillator [wbburgin]The True Trend oscillator identifies trending or ranging markets with a stochastic ATR and RSI. Here are some examples for how it can be used.
Uptrends
If the candlesticks are lime green, this signals an uptrend. On the oscillator, you can identify an uptrend if the bull strength (the green line) is above the bear strength (the red line). The strength of the uptrend and the downtrend can be found by looking at the slope of these lines.
Downtrends
If the candlesticks are red, this signals a downtrend. On the oscillator, notice how the bear strength line is above the bull strength line.
Ranging Markets and Pullbacks
The True Trend oscillator can also be used to identify ranging markets or pullbacks. Let's look at the previous example again:
If you notice that the bull and bear lines are bouncing above the red weak-trend zone (as in the example above), this signals an extended trend. On the contrary, when the bull and bear lines fall into the weak-trend zone, this may indicate a larger pullback or a range to look to enter a trade again, as in this example, where the ranging candles in gray demonstrate temporary pullbacks in a larger bullish trend:
Ranges can also occur before trend reversals, so a range may also indicate a smart time to secure profits.
You can customize the ranging threshold in the settings. It can be set from 0-100 because the indicator is a stochastic.
Hope you all find this indicator useful!

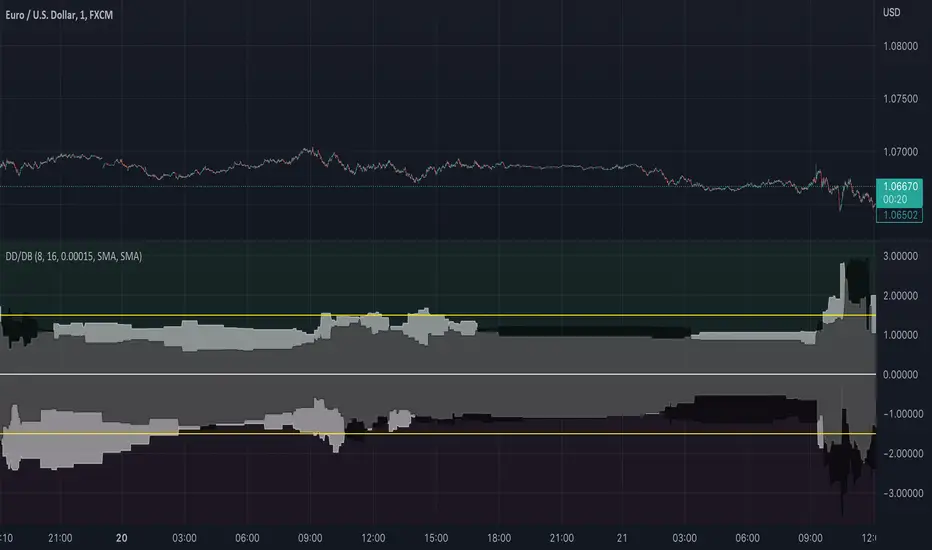
Drawdown and Drawback || Ranging Hey!
So this indicator tries to spot ranges;
Above the zero line is the data from green candles and below the zero line is the data from the red candles;
When the white area is > than the black area, it indicates that the DrawBack is higher than the DrawDown;
This might work counterintuitively for some people because, for a bullish candle, this means it has to go down for the indicator to recognize it as “good”/ see it as a DrawBack value;
The same is true for a bearish candle, the price has to move up after for it to be seen as a DrawBack value;
There are a few input values:
Length_: This is how many bars a candle gets for the price to move in, the default is 8 bars, so after a bar is formed, from the following 8 bars the DrawBack/DrawDown is saved;
EMA_Length: This is the EMA length, you can change the EMA length and also the MA variant, so you have full flexibility about what might work best for you;
RB_Size: This is how many points a Real Body of a candle has to have before it gets registered within the indicator, what I found it, is that if you put this too low your data gets ruined by candles that have 1-5 points if you use it on a low TimeFrame, but if you want to use it on higher timeframes you maybe have to make the default a bit higher.
Everything is plotted with an Offset of 1, I like it this way so you get a realistic view of the market as you will -most likely- place trades on the next candle either way not on the current candle. But that is just my opinion.
I also added 2 yellow Hlines for visual purposes to see if they were within a certain boundary, see if these add anything for yourself, because they can also make it look a bit messy;
If you have any questions about the code or the indicator itself, feel free to ask them!
I hope it helps at least one person ;)
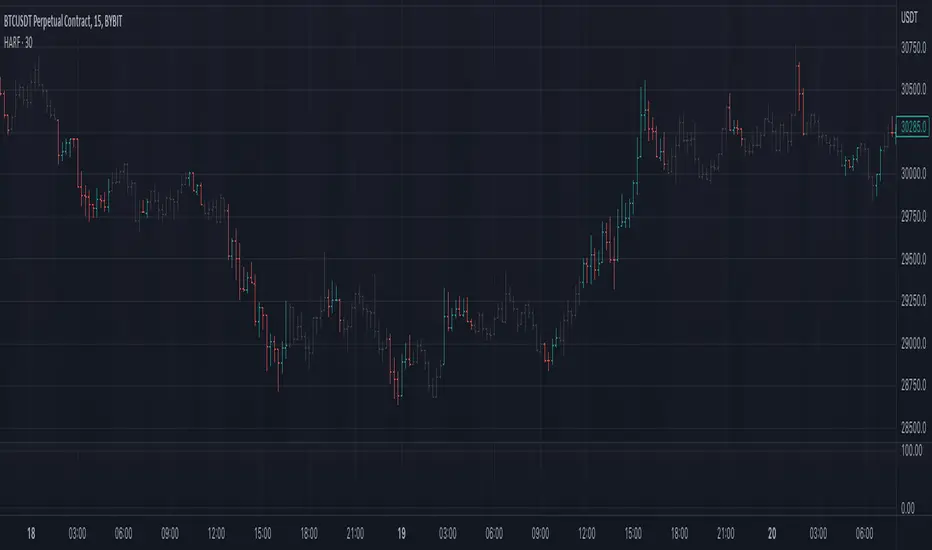
Cuban's Range PositioningCuban's Range Positioning is the primary backbone of Cuban's Asset Screener and a fantastic standalone market screening tool.
Range Positioning allows the trader to monitor the positioning of over 200+ Binance and Bybit Futures assets within a single window, with a standard measurement of performance, and also with custom watchlist support.
The range calculation itself uses the unique logic of Cuban's Donchian Suite, retaining highs and lows until the opposite side of the range is tagged.
When viewed historically, the Range Positioning screener allows traders to monitor any assets that are continually pushing range highs and lows, identify outliers, and track trending sectors relative to the rest of the market. This script makes this identification easier for the user by making assets that aren't approaching highs or lows, transparent.
Included within this indicator is the option to redenominate the quote asset of all assets on screen using the current chart ticker.
Within the user inputs, the user gains the ability to customize the following:
Range lookback
Asset redenomination
Location of the asset table
Percentage of assets highlighted or made transparent
Dynamic labelling offset
Over 200+ Binance and Bybit Futures assets
TO DO:
Customize number of assets on screen
Allow values beyond the initial range

Cuban's Asset ScreenerCuban's Asset Screener is a tool designed to view the health of the entire market in a single charting window, using a multi-timeframe, real-time heatmapped asset screener built natively within Tradingview.
You can use this tool to aggregate and display critical information required to identify your favorite trade ideas using other Cuban's Edge tools. Although the screener currently uses pre-built lists for over 200+ Binance and Bybit Futures pairs, the tool comes with custom watchlist support, allowing you to add as many additional assets as your screen and browser will support.
Currently tracking range positions and a custom cross asset delta function from Cuban's Pair Trading Index, the screener has an in-built sorting function which orders assets by similar market structure and colors them relative to their performance against the user's comparison asset -- their current chart ticker.
Cuban's Asset Screener is also valuable as a tool to monitor performance of your portfolio against any benchmark asset, by using the 'Asset Redenomination' option within the settings. This allows the user to redenominate the entire screener easily using their current chart ticker.
In order to setup the Asset Screener, the user will need to select an 'Asset List' and a 'Screen Location' value. This will load the screener into a set position on screen, from right to left. In order to add additional assets, multiple instances of the asset screener will need to be loaded on screen.
With this indicator, users get the option to adjust the following:
range positioning lookback
asset redenomination for range positioning
asset sorting order
screen location
multi-timeframe support
live pricing for PTI values
in-built asset lists for 200+ assets
TO DO:
add market filters to the coloring
add tradfi asset lists

Heiken Ashi Swing Range FilterIt uses heiken-ashi candles to find swing highs and lows, then check if candles are inside the range of them. This way you can filter out ranging market.
It may be better to use it in higher timeframe than current.
Range Detector Indicator [Misu]█ This indicator shows an upper and lower band based on Highs and Lows.
Depending on this, the indicator interprets a ranging market, an uptrend or a downtrend.
█ Usages:
The purpose of this indicator is to identify when the price is ranging.
It's also used to identify changes in trends, breaking points, and trend reversals.
But it can also be used to show resistance or support levels.
█ Features:
> Price Action Change Alerts
> Price Action Change Labels
> Color Bars
> Show Bands
█ Parameters:
Deviation: A parameter used to calculate pivots.
Depth: A parameter used to calculate pivots.
Activate Range Detection: Check the box to activate range detection.
Band% Offset: A factor that is used to vary the bands offset.

Donchian Channels+Standard Donchian Channels, this includes a Trend EMA which can be configured and the channels will use to give buy and sell signals. The channels are also colored in such a way to indicate a trend reversals. My favorite part that sets this apart from others is, if using the bClose option (which I recommend you do) the trend will not reverse until there is a close above/below the previous channel high/low. i.e. a reversal into an uptrend requires the current bar to close above the previous upper channel rather than just a new high.
The coloring of the current trend allows for a quick read of current market conditions and I use this on any timeframe across all forms of charts (forex stock, futures , crypto, etc). When taking one of the signals I use the opposite channel as the stop loss (when buying use bottom, and selling use top channel)
Update 1:
- Added my name to the code
- Updated the picture to show off the indicator better
- Raised the brightness of the fill color a bit, looks nicer I think
As a warning: I have obviously hand picked this picture to really show off this indicator's power to work in a trending market. Donchian Channels are a trending indicator and work best in trending markets with decent pull backs. If there are multiple signals going in each direction, it is a choppy market and you should stay out until it starts trending again. I generally use a 1:1.5 risk to reward ratio but sometimes will stretch it to 1:2 if it is a nice trade and I feel the market is in my favor as you can see from the trades placed in the picture (and I use that method for any commodity / chart and timeframe). I use the close of the white candle and then (since they are trades going short) I use the upper Donchian Channel as my stop loss.
I personally like to have the lines and labels turned off and enable all other options. Labels are just there to really stand out so you don't miss the white candle indication for a trade. OH! Also, I've had comments from friends that the white candles are hard to see, I turn off my candle borders in settings; makes it super easy to see them then. I turn lines off as the fill does the job well enough and it seems cleaner in my eyes.
If you'd like to see this picture on your chart, it is Micro E-Mini S&P 500 Futures from July 10, 2022 @ 18:00 on the 1-min chart.
just now
Update 2:
- Added day trading time highlights
- Added ranging market indicator (This I'm still working on so use at your own discretion, it's intended purpose is to tell when the Donchian Channels are not going to give great signals and to use a ranging indicator instead)
- Added multi-timeframe trend screener (handy if you want to quickly see the trend direction (based on the Trend EMA you set) of several time frames without having to change charts). It will draw in the bottom right of the chart.
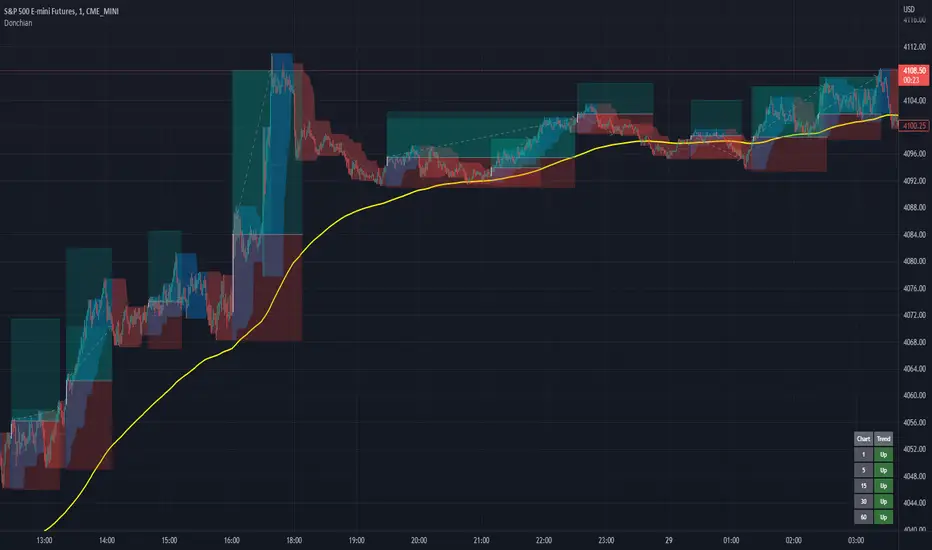
Donchian with Trend IndicatorStandard Donchian Channels, this includes a Trend EMA which can be configured and the channels will use to give buy and sell signals. The channels are also colored in such a way to indicate a trend reversal. My favorite part that sets this apart from others is, if using the bClose option (which I recommend you do) the trend will not reverse until there is a close above/below the previous channel high/low. i.e. a reversal into an uptrend requires the current bar to close above the previous upper channel rather than just a new high.
The coloring of the current trend allows for a quick read of current market conditions and I use this on any timeframe across all forms of charts (forex stock, futures, crypto, etc). When taking one of the signals I use the opposite channel as the stop loss (when buying use bottom, and selling use top channel)

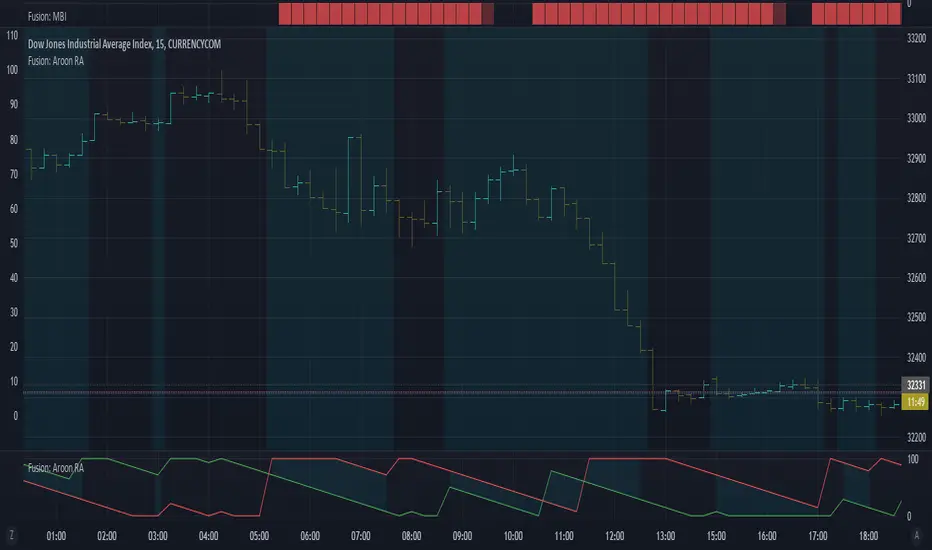
Fusion: Aroon range avoidanceThe main way to use this is that you set a threshold and a visual is given when the difference between the high and low is less than the threshold. This should be an indication that the market is ranging.
There is also an option to show the opposite (when the difference is greater than the threshold) which has no purpose other than to show the opposite state if you want to see it.
It is designed to be used both on and off the main chart - just put it where you want it and choose the appropriate "show" options.
People also use the Aroon to show ranging when both the high and low are going in the same direction. There is an option for this however keep in mind that it misses the first bar of that happening. This can't be gotten around without going to lower time frames which can't be (at the moment in TradingView) dynamically selected automatically, the lower time frame has to be set by the user so for now it's better to just fill the first bar the two are going in the same direction mentally when you see it.
Additionally it defaults to the normal colors we are familiar with for up and down (long/short) but you can choose Aroon colors if you wish with just a checkbox.
Finally, if you find value please do make a comment, give a thumbs up etc.
Enjoy and good luck!
Market Bias (CEREBR)Hello Everyone. I hope you are all doing great. It's been a long time since I posted my first script here, and I got a lot of response from that.
So, I thought I should share this script also to everyone, and anyone that may find it useful. Personally, I use it to tell the general market conditions.
Here's how I works : The script tries to determine the overall direction of the market, using smoothed Heiken Ashi candles. The coloring system (using bright and dark colors) is an attempt to detect strong market and weak market conditions. There's also an oscillator within the script, but for now it isn't plotted. Credits to @jackvmk, I used part of his open-script code in this indicator.\
I have considered using the slope of the indicator plot as a filter for ranging market conditions. The plot goes relatively flat in 'flat' markets. However, I have not done anything about that yet. Maybe some other time.
I hope you find this useful. If you find a way to use this, please share it with the community in the comment section.
NOTE: THIS IS BY NO MEANS FINANCIAL ADVICE. You'll have to make your studies and come up with a way to apply this indicator to your trading style and strategy.
By the way, I would be going with the name 'CEREBR' for any subsequent scripts I release from now on.
Happy Trading, guys.

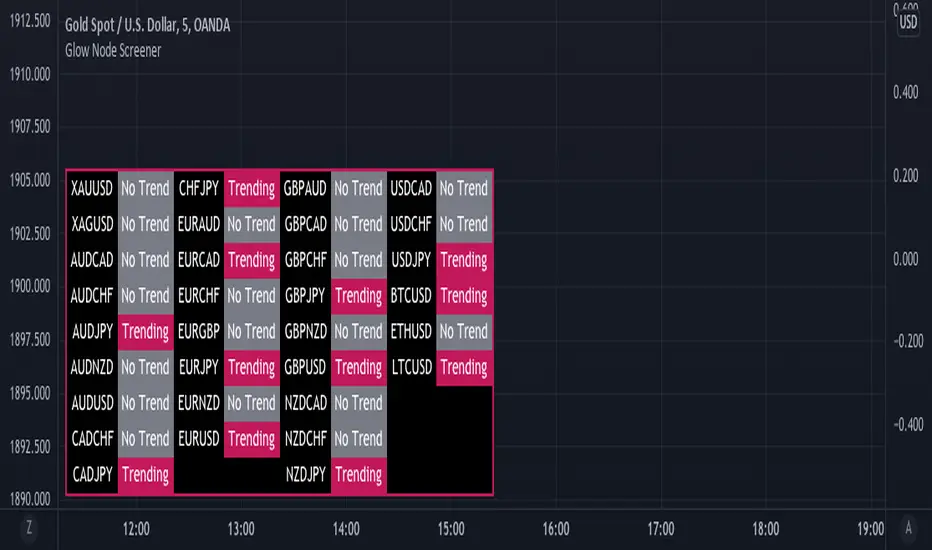
Glow Node ScreenerGlow Node Screener
Our Screener helps you identify whether a pair is in a strong trend for 32 different pairs including crypto.
Using our screener with a strategy will help you weed out bad markets that are ranging at a higher timeframe.
Which will in turn help reduce some of the bad trades you may take due to signals appearing in consolidation.
Very useful to choose which pairs you may like to trade for that day and what to avoid.
Higher Timeframe
The higher timeframe is automatically selected for you on the 15M - 30M - 1H - 4H time frames. You can override this by toggling the override button and selecting your timeframe manually
Pairs:
XAUUSD
XAGUSD
AUDCAD
AUDCHF
AUDJPY
AUDNZD
AUDUSD
CADCHF
CADJPY
CHFJPY
EURAUD
EURCAD
EURCHF
EURGBP
EURJPY
EURNZD
EURUSD
GBPAUD
GBPCAD
GBPCHF
GBPJPY
GBPNZD
GBPUSD
NZDCAD
NZDCHF
NZDJPY
USDCAD
USDCHF
USDJPY
BTCUSD
ETHUSD
LTCUSD
more will be added if requested
Fusion: ATR Ranging using PercentileA simple (but improved on my first attempt) way to determine a ranging market.
The defaults are for a specific use of my own so by no means feel a need to use them, adjust as needed.
By default this sits on the main chart however if you want to see the lines behind the result make a copy and put the copy on it's own chart and then just check the "Show ATR" and "Show PLI" (Percentile Linear Interpolation) flags.
There is no reason for using a Hull MA over any other except that it's a preference of mine, that is, it's not for some magical reason I figured out. That said, the Hull is perhaps my favorite because of what I learned about it after quite a bit of research so take that as you will.
Credit to: "Hull Suite by InSilico" from which I used the HMAs.
The code is structured to easily drop into bigger system so use as a lone indicator or add to some bigger project you are creating. If you do add this to a bigger system please drop me a note as it's nice to know your system is being used in something greater.
Finally, if you find value please do make a comment, give thumbs up etc.
Enjoy and good luck!

Fusion: Delta mixerBe warned, this indicator will unlikely be effective if you just load it and see what it has for you. It generally requires tuning, quite a bit of time, and a methodical approach but you might get lucky!
So why make something that's complicated and difficult like this? Simple, I've yet to find another indicator that can discern ranging like this one once tuned. I generally use to avoid trading when it's ranging.
The basic approach that has worked for me so far in tuning is as follows:
Set " Slope of Slope 2 " and " Slope of Slope 3 " to about 3.5.
Try to keep them mostly even and move them up and down for your environment while keeping an eye on how much ranging it's detecting.
When you have it about right try adding in the other threshold options (bring them up from 0) and see if they help detect more ranging.
Generally I found that any value other than zero doesn't make sense for " Slope 1 " however the others seem to be fair game although I generally have found that " Slope of Slope Avg 23 " doesn't add anything once the others are set.
You may find a completely different approach and better way! If you do please do leave a comment, drop me a note or something as I would appreciate learning better ways to use this indicator.
Because there's too many lines to be shown all at once, 10 in all, it's generally better to just leave the show settings as they are and see the collective effect as a single background color. However, if you want to experience some pain feel free to uncheck "As one color" and play around with the other settings as well.
The indenting of the "Show" settings (setting 2, 3 & 4 from the top) are to show that the one most indented will override the ones above it. Again, this is for the sanity of not showing 10 lines at once so what you see is grouped but mostly I just look at the background color and don't worry about the lines. If none of the three are checked then you will just see the HMA lines from which all the others are derived. The bottom-left corner will name which group of lines you are looking at so you don't have to check your settings to figure it out.
That said, maybe some clever person will find an alternative use for it, perhaps something useful in the lines crossing when setup a particular way or something which is why I left options to see the lines.
For clarification of the "Show" settings hover over the circled 'i' at the right of each setting.
If you find value please do make a comment, give thumbs up etc.
Enjoy and good luck!

Sideways detection bollinger bandsSideways detection indicator using Bollinger bands .
In this case we take the original ratio between lower and upper and we smooth it even harder in order to get a better idea about the accuracy of the trend.
If the initial ratio is not between 0 and 1 and the smooth ratio is higher than our selected value, we get an idea if we are a in trending market or not.
Of course using it as a standalone has no usage, and it has to be combined with other tools like moving average, oscillators and so on.
IF you have any questions let me know

Tradelivio's Ranging vs Trending Indicator ADXThis indicator is based on ADX and helps identify if a market is ranging/consolidating or trending.
Default setting are as follows:
0-15 Absent Trend
15-25 Weak Trend
25+ Strong Trend
FYI:
50-75 Very Strong Trend
75-100 Extremely Strong Trend
You can configure 3 levels of strength (Absent, Weak & Strong)
Please keep in mind that a falling ADX line only means that the trend strength is weakening, and it usually does not mean the trend is reversing, unless there has been a price climax.
