Advanced RSI — Mark 4 RSI was introduced by J. Welles Wilder Jr. in 1978 in New Concepts in Technical Trading Systems. It measures the velocity of gains vs. losses on a bounded 0–100 scale and popularized the 14-period lookback with 70/30 guide rails for overbought/oversold. Over time, traders added variations (different lengths, thresholds, smoothing, adaptive levels), but the core idea stayed the same: momentum turns often precede price turns.
and i initially started to make minor adjustments for personal use like changing the default to 17 , and using Tradingviews official RSI which comes with a MA embedded. but it was not enough. especially the visuals.
so, for this public release Mark 4 i enhanced RSI by incorporating :
1. Dual-Length Fusion
Two RSI periods (default 17 + 21) blended then lightly smoothed (TEMA by default) → steadier
line without dulling turns.
2. Adaptive OB/OS (ATR-aware) for fewer whipsaws.
3. OB/OS alt solution:
Brief yellow segments appear only at local extremes (default: >72 tops, <32 bottoms) to
emphasize exhaustion without repainting the whole line.
4. Signals you can actually see
Triangle markers for:
Bullish: RSI crossing up through adaptive OS (and still <40 at the cross).
Bearish: RSI crossing down through adaptive OB (and still >60 at the cross).
“Strong Bull/Bear” background nudges appear when momentum is pushing beyond the
bands.
Optional Divergence Tags
and
Tiny diamonds to flag potential bullish/bearish divergences (look-back based).
Info Table (can be hidden)
my Fav feature i included 5 colorways with modern themes.(pls check under INPUTS)
and i made all that to make the indicator visualization look awesome on high end displays.
Credits & acknowledgment
Inspired by the original RSI by J. Welles Wilder Jr. (1978).
Built to be modern, focused, and comfortable for long sessions—especially on dark/OLED displays.
THIS INDICATOR IS MORE THAN ENOUGH BUT I DO HAVE PRIVATE INDICATORS WITH DIFFERENT LOGIC FUNCTIONS.
I'm open for feedback/collaboration.
drsamc.
相対力指数 (RSI)

EMA21/SMA21 + ATR Bands SuiteThe EMA/SMA + ATR Bands Suite is a powerful technical overlay built around one of the most universally respected zones in trading: the 21-period moving average. By combining both the EMA21 and SMA21 into a unified framework, this tool defines the short-term mean with greater clarity and reliability, offering a more complete picture of trend structure, directional bias, and price equilibrium. These two moving averages serve as the central anchor — and from them, the script dynamically calculates adaptive ATR bands that expand and contract with market volatility. Whether you trade breakouts, pullbacks, or reversion setups, the 21 midline combined with ATR extensions offers a powerful lens for real-time market interpretation — adaptable to any timeframe or asset.
🔍 What's Inside?
✅ EMA21 + SMA21 Full Plots and Reduced-History Segments using arrays:
Enable full plots or segmented lines for the most recent candles only with automatic color coding. The reduced-history plots are perfect for reducing clutter on your chart.
✅ ATR Bands (2.5x & 5x):
Adaptive ATR-based volatility envelopes plotted around the midline (EMA21 + SMA21) to indicate:
🔸Potential reversion zones.
🔸Trend continuation breakouts.
🔸Dynamic support/resistance levels.
🔸 Expanding or contracting volatility states
🔸 Trend-aware color changes — yellow when both bands are rising, purple when falling, and gray when direction is mixed
✅ Dual MA Fills (EMA21/SMA21):
Visually track when short-term momentum shifts using a fill between EMA21 and SMA21
✅ EMA5 & EMA200 Labels:
Display anchored labels with rounded values + % difference from price, helping you track short-term + macro trends in real-time.
✅ Intelligent Bar Coloring
Bars are automatically colored based on both price direction and position relative to the EMA/SMA. This provides instant visual feedback on trend strength and structural alignment — no need to second-guess the market tone.
✅ Dynamic Close Line Tools:
Track recent price action with flexible close-following lines
✅ RSI Overlay on Candles:
Optional RSI + RSI SMA displayed above the current bar, with automatic color logic.
🎯 Use Cases
➖Trend Traders can identify when price is stacked bullishly across moving averages and breaking above ATR zones.
➖Mean Reversion Traders can fade extremes at 2.5x or 5x ATR zones.
➖Scalpers get immediate trend insight from colored bar overlays and close-following lines.
➖Swing Traders can combine multi-timeframe EMAs with volatility thresholds for higher confluence.
📌 Final Note:
As powerful as this script can be, no single indicator should be used in isolation. For best results, combine it with price action analysis, higher-timeframe context, and complementary tools like trendlines, moving averages, or support/resistance levels. Use it as part of a well-rounded trading approach to confirm setups — not to define them alone.

Xmoon – 3 Push Divergence – PremiumWhat the Xmoon Indicator Does and Why It’s Special
The Xmoon Indicator is an advanced and unique analytical tool, built on years of trading experience, research, and development. It is not merely a combination of a few simple indicators; it is a comprehensive, intelligent system that brings together the three main pillars of trading success—strategy, risk management, and trading psychology—into a single integrated tool.
Strategy
• Xmoon’s core algorithm is based on the 3 Push Divergence pattern in the RSI —a pattern not offered in other indicators. Most existing tools only detect divergence between two highs or two lows, whereas Xmoon can identify three consecutive highs or three consecutive lows with a momentum mismatch, which considerably increases the statistical likelihood of a trend reversal.
Risk Management
• Automatically calculates the size of each step entry based on per-step capital allocation, leverage, and entry/exit prices, using precise, weighted calculations.
• These multi-step calculations run in real time and are shown clearly in the Information Box for quick reading.
• A Liquidity Line (risk threshold) is computed for each setup and plotted on the chart so you can see at a glance where the position would be liquidated (futures) or where the analysis is invalidated (spot).
Psychology & Decision-Making
• From the moment a signal is generated, Xmoon plots all key levels— step entries, risk-free levels, targets, and the liquidity line —so the trader knows from the outset:
o where the profitable exit is if the market follows the analysis;
o where the break-even (risk-free) exit is if the market moves against the analysis.
• This approach significantly reduces stress and emotional decision-making, because both favorable and unfavorable scenarios are predefined.
Logic & Workflow of the Xmoon Indicator
1️⃣ Pivot Detection and Classification
Xmoon first detects price pivots on the chart and classifies them— based on the bar distance between consecutive pivot highs/lows—into four tiers: Super Minor, Minor, Mid-Major, and Major .
The greater the distance between pivots, the larger and more reliable the pivot becomes—though signals are generated less frequently.
2️⃣ Detecting the 3 Push Divergence Pattern
At this stage, Xmoon identifies 3 Push Divergence patterns. The pattern forms when price prints three consecutive pivots in the same direction, i.e.:
• Bullish: three successive higher highs
• Bearish: three successive lower lows
Meanwhile, at the corresponding points on the RSI , momentum moves the other way:
• Bullish case: RSI peaks step down each time — weakening buying pressure
• Bearish case: RSI troughs step up each time — weakening selling pressure
This repeated price–momentum disagreement three times in a row can significantly increase the likelihood of a trend reversal.
3️⃣ Plotting the Pattern and Key Levels
After the pattern is detected, Xmoon draws the divergence lines and plots the following levels on the chart:
• Step entry lines based on the user-defined number of steps and allocated capital.
• Risk-free (break-even) lines for exits without profit or loss.
• Target lines indicating minimum profit objectives.
• Liquidity level (risk threshold) marking where equity would be wiped out in futures.
These visuals let the trader see, at a glance, the full picture of the pattern, planned entries/exits, and the risk range.
4️⃣ Information Box
After the pattern is detected, Xmoon can display an on-chart Information Box alongside each detected pattern (when enabled in the settings). It includes:
• Pivot type: Super Minor, Minor, Mid-Major, or Major.
• Confirmation filters:
1. Higher-timeframe trend based on the 200-period moving average (MA200).
2. Higher-timeframe overbought/oversold status based on RSI.
• Suggested entry size: based on actual capital and leverage.
This box helps the trader quickly see the pattern quality, overall market context, and the suggested position size.
ℹ️ Explanation of Confirmation Filters
Using these filters can increase signal accuracy.
This information is built into the Xmoon indicator, so you don’t need to add any extra indicators or tools to the chart. Xmoon performs the comparisons in real time and displays the filter results in the Information Box .
• Higher-timeframe trend filter: If the higher-timeframe trend based on the 200-period moving average (MA200) is bullish, buy/long signals are stronger; if it’s bearish, sell/short signals are stronger.
• Higher-timeframe overbought/oversold filter: If RSI is in the overbought zone, the probability of success for sell/short signals is higher; in the oversold zone, the probability of success for buy/long signals is higher.
🧩 What are the components of the Xmoon indicator, and why are they combined?
• Core strategy: trend-reversal signals via a proprietary 3 Push Divergence algorithm.
• Multi-stage confirmation: higher-timeframe trend based on MA200 , plus higher-timeframe RSI overbought/oversold confirmation.
• Advanced position sizing: step-based sizing and weighted averaging .
• Structured exit management: risk-free levels, targets , and liquidity level.
• Supports fast decision-making: all vital information at a glance.
This combination turns Xmoon into a complete, practical system that has not been implemented in this integrated way in any similar tool on TradingView, and it is precisely the sum of these features in a single indicator that sets Xmoon apart from comparable tools.
How to Use the Xmoon Indicator
1️⃣ Add to chart: Add the indicator to the chart of your chosen symbol.
2️⃣ Configure parameters: In Settings , adjust the following to match your strategy:
• Number of Entry steps: 2 to 10 steps
• Pivot type: Super Minor / Minor / Mid-Major / Major
• Pattern direction: Bullish / Bearish
• Display options: show lines and the Information Box
• Capital per trade
• Higher-timeframe filters: timeframes for Trend and RSI
3️⃣ Enable alerts: Turn on alerts to receive immediate notifications when a 3 Push Divergence pattern is detected.
4️⃣ Review the Information Box: To assess pattern strength and alignment with the market after a signal appears, check:
• Pivot size: Super Minor / Minor / Mid-Major / Major (for gauging pattern strength)
• Confirmation filters:
1. Whether the detected pattern aligns with the higher-timeframe trend
2. Whether the detected pattern aligns with the higher-timeframe RSI overbought/oversold condition
These details help you decide whether to enter the trade.
5️⃣ Step Entries
After reviewing the conditions, open your first position at Step 1 . If price moves against you and reaches the Step 2 level, open a new position there, and continue opening additional positions at each subsequent step level.
Whenever price reverses from any of these levels and moves in the direction of your analysis, all open positions will move into profit .
In Xmoon, the number of entry steps is fully configurable ( 2 to 10 ). Set it according to your strategy—the system automatically calculates the size of each step based on the capital you allocate.
6️⃣ Exit Management
Depending on market conditions, you can choose one of the following:
• ⚖️ Exit at the risk-free level: when the market is uncertain and you prefer to close at break-even.
• 🎯 Exit at the target level: when price has followed your analysis and you want to realize profit.
⚠️ Liquidity Level
• Spot: analysis invalidation point.
• Futures: the price at which a leveraged position’s equity would be wiped out.
Why the Invite-Only Version of Xmoon Is Worth Getting
• Proprietary 3 Push Divergence detection and confirmation that isn’t available in the free version or generic indicators.
• Automatic, precise capital and step sizing, with visual plotting of key levels from the moment a signal is issued.
• Real-time market context and pattern quality shown in the Information Box—no need to switch timeframes or add extra indicators.
• Risk control and psychological support by outlining predefined scenarios from start to finish of the trade.
• Limited access to help prevent misuse and reduce users’ financial risk, with dedicated training before activation.
• Developed through extensive backtesting and live evaluation; outcomes depend on correct use and market conditions.
We sincerely hope you have successful and profitable trades.
📣 If you have any questions or need further guidance, we’ll be happy to hear from you.
It’s our pleasure to assist you anytime.
🔻🔻🔻 Persian Section – بخش فارسی 🔻🔻🔻
اندیکاتور ایکسمون چه کاری انجام میدهد و چرا خاص است
اندیکاتور ایکسمون یک ابزار تحلیلی پیشرفته و منحصربهفرد است که حاصل سالها تجربه ترید، تحقیق و توسعه است. این اندیکاتور صرفاً ترکیب چند اندیکاتور ساده نیست، بلکه یک سیستم جامع و هوشمند است که سه رکن اصلی موفقیت در معاملات یعنی استراتژی، مدیریت سرمایه و روانشناسی معاملهگری را در یک ابزار یکپارچه گردآورده است
در بخش استراتژی
* الگوریتم اصلی ایکسمون بر اساس الگوی سهپوش واگرایی (تری پوش دایورجنس) در آر-اِس-آی طراحی شده است؛ الگویی که در سایر اندیکاتور ها ارائه نشده است، بیشتر ابزارهای موجود تنها واگرایی بین دو قله یا دو کف را تشخیص میدهند، در حالی که ایکسمون توانایی شناسایی سه قله یا سه کف متوالی با تضاد مومنتوم را دارد که این موضوع از نظر آماری احتمال بازگشت روند را بهمراتب افزایش میدهد
در بخش مدیریت سرمایه
* محاسبه خودکار حجم هر پله، بر اساس سرمایه پله ای، لوریج و قیمتهای ورود/خروج بهصورت دقیق و وزنی انجام میشود
* این محاسبات پیچیده برای چندین پله به شکل لحظهای انجام شده و در باکس اطلاعات به سادهترین شکل نمایش داده میشود
* خط لیکوییدیتی (حد ریسک) برای هر الگو محاسبه و روی نمودار بصورت بصری رسم میشود تا کاربر در یک نگاه بداند سرمایهاش کجا صفر میشود (در فیوچرز) یا تحلیلش کجا باطل میشود (در اسپات)
در بخش روانشناسی و تصمیمگیری
* ایکسمون از همان لحظه صدور سیگنال، تمام خطوط کلیدی (ورودی پلهای، ریسکفری، تارگت، لیکوییدیتی) را رسم میکند تا معاملهگر از ابتدا بداند
* اگر بازار طبق تحلیل پیش برود، خروج سودآور کجاست
* اگر بازار بر خلاف تحلیل پیش برود، نقطه خروج بیضرر (ریسکفری) کجاست
* این رویکرد باعث کاهش شدید استرس و تصمیمگیری احساسی میشود، چون سناریوهای خوشبینانه و بدبینانه از پیش مشخص هستند
⚙️ منطق و روش کار اندیکاتور ایکسمون
1️⃣ شناسایی و طبقهبندی پیوتها
اندیکاتور ایکسمون ابتدا پیوتهای قیمتی را روی نمودار شناسایی کرده و بر اساس فاصلهی کندلی بین سقف یا کف ها، آنها را در چهار دسته طبقهبندی میکند : سوپر مینور، مینور، میدماژور و ماژور
هرچه فاصله بین پیوت ها بیشتر باشد، پیوت بزرگتر و معتبرتر است، اما سیگنالها کمتر تولید میشوند
2️⃣ تشخیص الگوی سهپوش واگرایی
اندیکاتور ایکسمون در این مرحله الگوهای سهپوش واگرایی را شناسایی میکند، این الگو زمانی شکل میگیرد که قیمت سه پیوت متوالی همجهت تشکیل دهد، یعنی
* حالت صعودی : سه سقف پیاپی بالاتر از قبلی
* حالت نزولی : سه کف پیاپی پایینتر از قبلی
و همزمان، در نقاط متناظر در آر-اِس-آی حرکت معکوس دیده شود، به این معنا که
* حالت صعودی، قلههای آر-اِس-آی هر بار پایینتر از قبلی قرار گیرند - کاهش قدرت خرید
* حالت نزولی، درههای آر-اِس-آی هر بار بالاتر از قبلی شکل گیرند - کاهش فشار فروش
این تضاد قیمت و مومنتوم، وقتی سه بار پیاپی رخ دهد، احتمال بازگشت روند را بهشدت افزایش میدهد
3️⃣ ترسیم الگو و نمایش سطوح کلیدی
پس از شناسایی الگو، ایکسمون خطوط واگرایی و همچنین خطوط و سطوح زیر را روی نمودار ترسیم میکند، این موارد شامل
* 📍 خطوط ورود پلهای بر اساس تعداد پله و سرمایه تنظیمشده توسط کاربر
* ⚖️ خطوط ریسکفری برای خروج بدون سود و زیان
* 🎯 خطوط تارگت به عنوان سطوح حداقل سود
* 🛡 سطح لیکوییدیتی (حد ریسک) برای مشخصکردن نقطه صفر شدن سرمایه در معاملات فیوچرز
این ترسیمات باعث میشود معاملهگر در یک نگاه تصویر کامل از الگو، سطوح ورود و خروج و محدوده ریسک داشته باشد
4️⃣ باکس اطلاعات
پس از شناسایی الگو، اندیکاتور ایکسمون یک باکس اطلاعات تکمیلی در کنار هر الگو نمایش میدهد، البته با فعالسازی گزینه مربوطه در تنظیمات، باکس اطلاعات در کنار الگو نمایش داده میشود و شامل موارد زیر میباشد
* 🏷 نوع پیوت : سوپر مینور، مینور، میدماژور یا ماژور
* 📋 فیلترهای تأییدی
یک - جهت روند در تایمفریم بالاتر بر اساس میانگین متحرک دویست
دو - وضعیت اشباع خرید/فروش در تایمفریم بالاتر بر اساس اندیکاتور آر-اِس-آی
* 📊 حجم پیشنهادی ورود : بر اساس سرمایه واقعی و لوریج
این باکس به معاملهگر کمک میکند در یک نگاه کیفیت الگو، شرایط کلی بازار و حجم پیشنهادی ورود را بداند
توضیح درباره فیلترهای تأییدی : استفاده از این فیلترها میتواند دقت سیگنالها را افزایش دهد. این اطلاعات در اندیکاتور ایکسمون موجود است و نیازی نیست اندیکاتور یا ابزار اضافه دیگری به چارت اضافه کنید. ایکسمون مقایسه ها را در لحظه انجام میدهد و نتیجه فیلترها را در باکس اطلاعات به شما نشان میدهد
* فیلتر جهت روند در تایمفریم بالاتر : اگر روند بالاتر بر اساس اِم-اِی-دویست صعودی باشد، سیگنالهای خرید/لانگ قویتر هستند و بالعکس
* فیلتر تشخیص نواحی اشباع خرید/فروش در تایمفریم بالاتر : اگر آر-اِس-آی در محدوده اُورباوت باشد، احتمال موفقیت فروش بیشتر است و در محدوده اُورسولد احتمال موفقیت خرید بالاتر میرود
🧩 اجزای اندیکاتور ایکسمون چه هستند و چرا این اجزا با هم ترکیب شدهاند
* استراتژی اصلی : سیگنال بازگشت روند با الگوریتم اختصاصی سهپوش واگرایی
* تأیید چندمرحلهای جهت روند در تایم فریم بالاتر بر اساس اِم-اِی-دویست و تایید وضعیت بیشینه خرید/فروش در تایم فریم بالاتر در اندیکاتور آر-اِس-آی
* مدیریت سرمایه پیشرفته : محاسبه حجم پلهای و میانگین وزنی
* مدیریت خروج ساختاریافته : سطوح ریسکفری، تارگت، لیکوییدیتی
* پشتیبانی از تصمیمگیری سریع : همه اطلاعات حیاتی در یک نگاه
این ترکیب، ایکسمون را به یک سیستم کامل و کاربردی تبدیل کرده که در هیچ ابزار مشابهی در تریدینگویو به این شکل یکپارچه پیادهسازی نشده است و دقیقاً مجموع این ویژگیها در یک اندیکاتور است که ایکسمون را از ابزارهای مشابه متمایز میکند
📖 نحوه استفاده از اندیکاتور ایکسمون
1️⃣ افزودن اندیکاتور به چارت : اندیکاتور را به نمودار نماد دلخواه اضافه کنید
2️⃣ تنظیم پارامترها : از بخش تنظیمات، موارد زیر را بر اساس استراتژی شخصی خودتان مشخص کنید
* تعداد پلههای ورود: از دو تا ده پله
* نوع پیوت ها: سوپر مینور/مینور/مید-ماژور/ماژور
* نوع الگوها: نزولی/صعودی
* نمایش خطوط و باکس اطلاعات
* تعیین سرمایه در هر معامله
* تایمفریمهای فیلتر اِم-اِی-دویست و آر-اِس-آی
3️⃣ فعالسازی هشدارها : برای اطلاع فوری از شناسایی الگوهای سهپوش واگرایی ، آلارمها را فعال کنید
4️⃣ بررسی باکس اطلاعات : برای سنجش قدرت الگو و همجهتی با بازار، پس از صدور سیگنال، اطلاعات زیر را در باکس مشکی اطلاعات بررسی کنید
* 🏷 نوع پیوت : بررسی میزان قدرت الگو - سوپر مینور، مینور، میدماژور یا ماژور
* 📋 فیلترهای تأییدی
یک - بررسی هم جهتی الگوی شناسایی شده با جهت روند در تایمفریم بالاتر
دو - بررسی هم جهتی الگوی شناسایی شده با وضعیت اشباع خرید یا فروش در اندیکاتور آر-اِس-آی در تایمفریم بالاتر
این اطلاعات به شما کمک میکند تصمیم بگیرید که آیا وارد معامله شوید یا خیر
5️⃣ ورود پلهای
اگر پس از بررسی شرایط تصمیم به ورود گرفتید، اولین پوزیشن را در پله اول باز کنید و در صورتی که بازار در خلاف جهت موردنظر شما حرکت کرد و به سطح پله دوم رسید، یک پوزیشن جدید در همان سطح باز کنید و با رسیدن به سطوح بعدی، پوزیشن های بعدی را باز می کنید
هر زمان که بازار از هر یک از این سطوح برگشت و در جهت تحلیل شما حرکت کرد، تمامی پوزیشنهای باز شده وارد سود میشوند
در اندیکاتور ایکسمون، تعداد پلههای ورودی کاملاً قابلتنظیم است (بین دو تا ده پله ) و شما میتوانید بر اساس استراتژی شخصی خود آن را تعیین کنید، سیستم بهطور خودکار حجم هر پله را بر اساس سرمایه واردشده محاسبه میکند
6️⃣ مدیریت خروج
بسته به شرایط بازار، میتوانید یکی از دو روش زیر را انتخاب کنید
* ⚖️ خروج در سطح ریسکفری : زمانی که بازار نامطمئن است و میخواهید بدون سود یا زیان از معامله خارج شوید
* 🎯 خروج در سطح تارگت : زمانی که قیمت طبق تحلیل شما حرکت کرده است و بدنبال کسب سود هستید
⚠️سطح لیکوییدیتی
* اسپات: نقطه ابطال تحلیل
* فیوچرز: نقطه صفر شدن سرمایه پوزیشن با لوریج
💎 چرا نسخه اینوایت اونلی ایکسمون ارزش تهیه دارد
* الگوریتم اختصاصی شناسایی و تأیید سهپوش واگرایی که در نسخه رایگان یا اندیکاتورهای عمومی وجود ندارد
* محاسبات سرمایه و حجم پلهای بهصورت خودکار و دقیق، همراه با رسم بصری سطوح کلیدی از لحظه صدور سیگنال
* نمایش آنی شرایط بازار و کیفیت الگو در باکس اطلاعات بدون نیاز به تغییر تایمفریم یا افزودن اندیکاتورهای اضافی
* کنترل ریسک و پشتیبانی روانی معاملهگر با ارائه سناریوهای مشخص از ابتدا تا انتهای معامله
* دسترسی محدود برای جلوگیری از استفاده نادرست و کاهش ریسک مالی کاربران، همراه با آموزش اختصاصی پیش از فعالسازی
* اثباتشده در تستها و معاملات واقعی با نتایج قابل اتکا، به شرط استفاده صحیح بر اساس آموزش
صمیمانه امیدواریم معاملات موفق و پرسودی داشته باشید
📣 اگر سوالی دارید یا نیاز به راهنمایی بیشتری دارید، خوشحال میشویم از ما بپرسید
با کمال میل در خدمتتان هستیم

MTF Oscillator Stack [BigBeluga]🔵 OVERVIEW
The MTF Oscillator Stack brings powerful multi-timeframe momentum analysis directly into your price chart. You can select one oscillator— RSI , MFI , or Stochastic RSI —and display it across up to 4 different timeframes. Each panel is neatly stacked horizontally above price , offering quick insight into cross-timeframe conditions like trend direction, exhaustion zones, and momentum shifts.
🔵 CONCEPTS
Single Oscillator Mode: Select one oscillator type (RSI, MFI, or Stoch RSI) to analyze across all selected timeframes.
Top-Chart Horizontal Panels: Oscillator plots are aligned horizontally at the top of the chart for seamless top-down reading.
Signal Comparison Arrows: Arrows (🢁 / 🢃) indicate oscillator position relative to its signal line.
Overbought/Oversold Zones: Transparent 30–70 fill zones highlight key reversal areas.
Dynamic Display Logic: Only enabled panels are shown; spacing adjusts based on active timeframes.
Timeframe Tagging: Each oscillator panel is labeled with its corresponding timeframe (e.g., 1H, 2H, 4H).
🔵 FEATURES
Choose one oscillator (RSI, MFI, or Stoch RSI) and apply it across up to 4 timeframes.
Each oscillator panel includes: price-synced plot, signal line, and zone shading.
Scale alignment allows users to place charts at the bottom or top.
Clear arrow signals show whether oscillator is bullish or bearish.
Individual length and signal settings per timeframe.
Toggle for alignment mode: evenly spaced or floating layout.
All panels use a consistent layout for faster decision-making.
🔵 HOW TO USE
Select your preferred oscillator and activate 2–4 key timeframes (e.g., 1H, 4H, D1, W1).
Use signal crossovers as a bullish (🢁) or bearish (🢃) trend cue.
Look for aligned extremes (e.g., all timeframes overbought) to spot momentum exhaustion.
Ideal for momentum confluence strategies and top-down confirmation.
Use horizontal layout to stay focused on price while assessing broader structure.
🔵 CONCLUSION
MTF Oscillator Stack simplifies complex multi-timeframe momentum analysis into one clean, actionable visual. Whether you're tracking RSI, MFI, or Stoch RSI, this tool helps you stay aligned with the broader trend—without ever leaving your main chart.

RSI Diode PanelA small and clean RSI panel that simultaneously shows the 15m, 30m, 1h, 2h, 4h, and 1d timeframes, which can help you with basic trend orientation.

FFI-Trend Rider ProFFI-Trend Rider Pro is a trend-following strategy designed to help traders make more structured and disciplined entries.
It uses a crossover between the 11 EMA and 21 SMA to detect potential trend shifts, while avoiding premature entries by checking how far the price is from the moving averages. If the price is extended, it waits for a pullback — just like professional traders do.
The indicator also includes:
Auto stoploss based on 21 SMA
Visual background colors based on RSI to help gauge trend strength
A built-in trade info table showing current trade type, entry price, stoploss, and trailing SL
Strategy-enabled functionality for easy backtesting
🔍 Ideal For:
Intraday & Swing Traders
Traders who want fewer, high-quality trades
Anyone looking to reduce emotional decision-making
⚠️ Disclaimer:
This script is for educational purposes only and does not constitute financial advice. Always do your own analysis before making any trading decisions. Past performance is not indicative of future results.

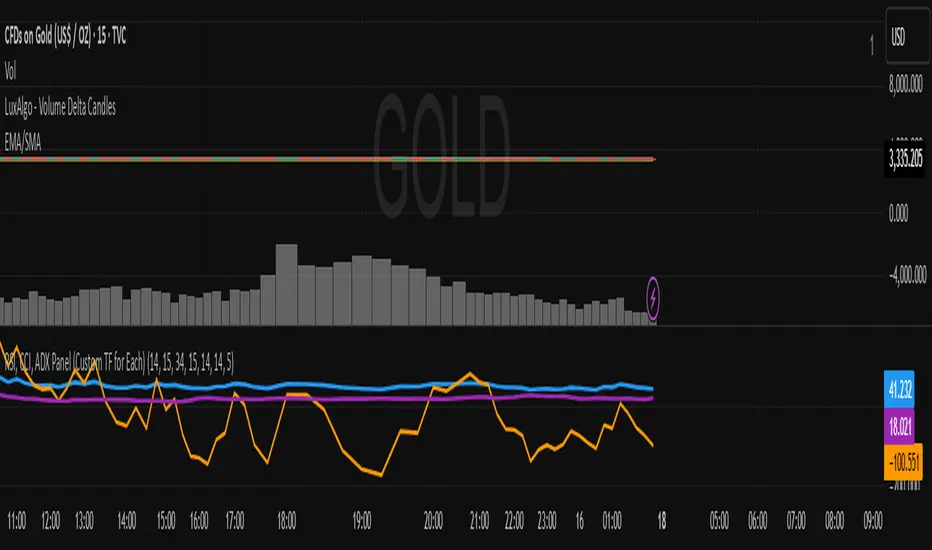
RSI, CCI, ADX Panel (Custom TF for Each)RSI, CCI, ADX Panel (Custom TF for Each)
This indicator combines RSI, CCI, and ADX into a single panel, allowing traders to view three key momentum/trend signals together. Each indicator can be calculated on its own custom timeframe, making it useful for multi-timeframe analysis.
Features:
RSI (Relative Strength Index): Measures momentum, useful for identifying overbought/oversold conditions.
CCI (Commodity Channel Index): Detects cyclical movements and potential reversals.
ADX (Average Directional Index): Evaluates trend strength without regard to direction.
Independent timeframe selection for RSI, CCI, and ADX.
Distinct colors for each indicator (RSI = Blue, CCI = Orange, ADX = Purple).
Single consolidated panel for compact analysis.
This tool is designed to give a multi-perspective view of market strength, momentum, and trend in one place.
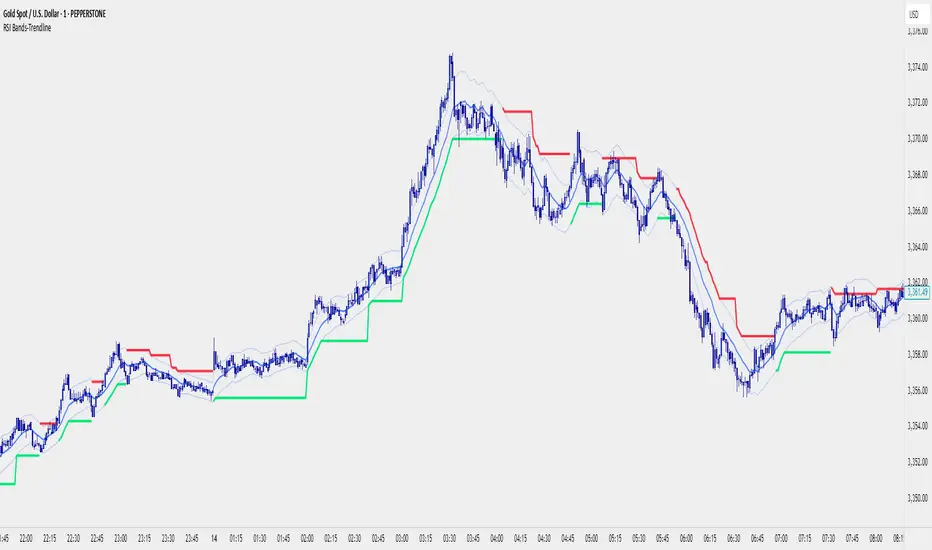
RSI Bands With RSI - ATR Trend LineRSI Bands With RSI - ATR Trend Line (Smoothed Baseline)
Overview
A trend-following tool that fuses RSI-based regime detection with a smoothed baseline and ATR bands. Trend line aims to stay with the RSI move, cut random noise, and flip cleanly. The line draws green in bulls and red in bears; signals fire only on candle close confirmed flips.
Key Features
✅ Dynamic Trend Detection
RSI (>50 / <50) sets bullish/bearish regime
Smoothed baseline adapts to price while damping whipsaw
ATR-based bands expand/contract with volatility
✅ Precise Signal Generation
Buy when trend flips to bullish (close confirms above the upper band)
Sell when trend flips to bearish (close confirms below the lower band)
Flips require a real band break → fewer false transitions
✅ Visual Clarity
Green line = bullish trend, Red line = bearish trend
✅ Customizable Settings
RSI Length (default 14)
Baseline Smoothing (default 26)
ATR Length (default 14)
ATR Multiplier (default 1.4)
Toggles for Signals and Labels
✅ TradingView Alerts
Built-in Buy & Sell alerts (recommend Once per bar close)
How It Works
Algorithm Logic
RSI Regime: RSI above/below 50 sets bull/bear. At exactly 50, the prior target is carried forward.
Target & Smoothing: A per-bar target is built from the bar’s range and RSI, then smoothed with an EMA-style filter (Baseline Smoothing) to form the baseline.
ATR Bands: Upper/Lower = baseline ± (ATR × Multiplier).
Flip Rule (Supertrend-like):
Close above upper band → bullish flip; trend line tracks the lower band (green).
Close below lower band → bearish flip; trend line tracks the upper band (red).
Between bands → prior trend line persists.
Signals/Alerts: A flip event generates a Buy/Sell signal and alert.
Best Use Cases
Trending Markets – Built to ride sustained moves in either direction.
Multiple Timeframes – Works from intraday to higher TFs; higher TFs usually produce cleaner flips.
Various Asset Classes – Forex, Indices, Stocks, Crypto, Commodities; ATR adapts to volatility.
Recommended Settings
Conservative (Lower Frequency)
RSI 14–20 • Baseline 34 • ATR 14–21 • Multiplier 1.8–2.2
Use for swing/position trading; calmer signal stream.
Balanced (Default)
RSI 14 • Baseline 26 • ATR 14 • Multiplier 1.4
Good general-purpose setup for swing or active intraday.
Aggressive (Higher Frequency)
RSI 10–14 • Baseline 13–21 • ATR 10–14 • Multiplier 1.1–1.3
For scalping/day trading; earlier but noisier flips.
🎨 Visual Elements
RSI Smooth baseline (soft blue)
Upper/Lower ATR Bands (faint blue)
Trend Line (Bull/Bear) drawn only in the active regime (green/red)
Optional Buy/Sell arrows and labels
⚠️ Important Notes
Signals on Close
Flips confirm on bar close. Intrabar crosses can revert; wait for confirmation.
Risk Management
Size positions appropriately; many traders trail beyond the opposite band/line.
Factor in spread, slippage, sessions, and news.
Confirmation & Testing
Combine with structure/volume/HTF bias if desired.
Backtest and forward-test per instrument and timeframe.
For research/education only; not financial advice.
Nifty Power -> Nifty 50 chart + EMA of RSI + avg volume strategyThis strategy works in 1 hour candle in Nifty 50 chart. In this strategy, upward trade takes place when there is a crossover of RSI 15 on EMA50 of RSI 15 and volume is greater than volume based EMA21. On the other hand, lower trade takes place when RSI 15 is less than EMA50 of RSI 15. Please note that there is no stop loss given and also that the trade will reverse as per the trend. Sometimes on somedays, there will be no trades. Also please note that this is an Intraday strategy. The trade if taken closes on 15:15 in Nifty 50. This strategy can be used for swing trading. Some pine script code such as supertrend and ema21 of close is redundant. Try not to get confused as only EMA50 of RSI 15 is used and EMA21 of volume is used. I am using built-in pinescript indicators and there is no special calculation done in the pine script code. I have taken numbars variable to count number of candles. For example, if you have 30 minuite chart then numbars variable will count the intraday candles accordingly and the same for 1 hour candles.

SatoshiMultiFrame RSI SatoshiMultiFrame 📈
SatoshiMultiFrame is an advanced, multi-timeframe version of the RSI indicator, designed to look and feel like the built-in TradingView RSI — but with more customization options and professional visual enhancements.
🎯 Features
Multi-Timeframe (MTF) Support – choose any timeframe for RSI calculation.
Customizable RSI Line – change color, thickness, and style (Solid / Dashed / Dotted).
Editable 30 / 50 / 70 Bands – fully customizable in the Style tab.
Smooth Gradient Fill for OB/OS Zones:
🟢 Green shading above Overbought (70)
🔴 Red shading below Oversold (30)
Customizable background for the entire panel.
No repainting – stable and reliable data.
⚙️ Inputs
RSI Length – default 14.
Source – select the price source (Close, Open, etc.).
RSI Timeframe – pick a higher or lower timeframe.
RSI Line Style – choose between Solid / Dashed / Dotted.
Dash Period & Dash Length – adjust the look of dashed lines.
🎨 Style Tab :
Change RSI line color, thickness, and optional MA line.
Edit colors and styles of 30 / 50 / 70 bands.
Enable/disable and recolor OB/OS gradient fills.
Adjust background color and transparency.
📌 How to Use :
Add the indicator to your chart.
In Inputs, set your preferred timeframe, RSI length, and line style.
In Style, adjust colors, thickness, and gradient effects to your preference.
Use the 50 line as a trend reference and monitor RSI behavior in OB/OS zones.
⚠️ Disclaimer: This tool is for educational purposes only and should not be considered financial advice. Always practice proper risk management.

Jitendra: MTF AIO Technical Indicators with Trend ▲▼Jitendra: MTF AIO Technical Indicators with Trend ▲▼
Why We Designed this Indicator
we build this indicator to Analysis Multi-timeframe Technical Data in dashboard to get Better and Quick Data in which Time Frame where it is in Momentum or in Swing,
By combining multiple technical indicators with trend direction arrows and displaying them in a customizable table.
It also optionally plots some indicators EMA, VWAP, Supertrend, Bollinger Bands on the chart.
Traders who want a compact technical summary across multiple timeframes without switching charts.
Quickly assess trend strength, momentum, divergence, volume pressure in one glance.
Combine with price action to make higher-confidence entries/exits.
How to Use This Indicator
In setting there are Two parts
First Part - for Plot Multi EMA, Bollinger Band, Supertrend 10,2 & 10, 3 factorial
Second Part- To get Data on Table for Quick Analysis
Chart Plots With Enable Disable Toggle in Setting
VWAP (optional)
4 EMAs (lengths configurable)
Bollinger Bands (optional)
Two separate Supertrend indicators with custom ATR period and multiplier
Indicators Data in Table
For each selected timeframe:
VWAP position (price above/below)
MACD value + trend arrow
MACD Histogram (optional)
RSI value + arrow (rising/falling)
ADX value + arrow (strength rising/falling)
+DI / -DI values + trend arrows
RSI Divergence detection (regular + hidden)
EMA levels (up/down relative to price)
EMA crossover (EMA1 vs EMA2 arrow)
Stochastic %K
Volume Matrix:
Raw volume
20 SMA volume
Volume % change from SMA
Multi-Timeframe Support
Current timeframe + up to 5 user-defined timeframes (e.g., 1H, 4H, Daily, Weekly, Monthly)
Customizable Toggles
Enable/disable any indicator
Choose which EMAs to show
Show/hide trend arrows
Choose which volume metrics to display
Choose table position (top_left, top_right, etc.)
Choose table text size
Trend Arrows & Colors
Green ▲ = bullish / rising trend
Red ▼ = bearish / falling trend
Gray – = neutral/no change
Background colors indicate overbought/oversold, trend strength, or volume surge.
Indicator Data Fetch PINE CODE Short Summary
request.security() → pulls data from the selected timeframe (tf).
Each indicator’s calculation can be wrapped inside request.security() so the values are computed on that timeframe.
//@version=5
// === 1. VWAP ===
vwap_htf = request.security(syminfo.tickerid, tf, ta.vwap)
// === 2. MACD ===
macd_src = request.security(syminfo.tickerid, tf, close)
macd_val = ta.ema(macd_src, 12) - ta.ema(macd_src, 26)
macd_sig = ta.ema(macd_val, 9)
macd_hist = macd_val - macd_sig
// === 3. RSI ===
rsi_htf = request.security(syminfo.tickerid, tf, ta.rsi(close, 14))
// === 4. ADX & DI ===
adx_htf = request.security(syminfo.tickerid, tf, ta.adx(14))
plusDI = request.security(syminfo.tickerid, tf, ta.plus_di(14))
minusDI = request.security(syminfo.tickerid, tf, ta.minus_di(14))
// === 5. Supertrend ===
= request.security(syminfo.tickerid, tf, ta.supertrend(3, 7))
// === 6. Bollinger Bands ===
basis = ta.sma(close, 20)
dev = ta.stdev(close, 20)
bb_up = request.security(syminfo.tickerid, tf, basis + dev * 2)
bb_low = request.security(syminfo.tickerid, tf, basis - dev * 2)
// === 7. Stochastic ===
k = ta.sma(ta.stoch(close, high, low, 14), 3)
d = ta.sma(k, 3)
stochK = request.security(syminfo.tickerid, tf, k)
stochD = request.security(syminfo.tickerid, tf, d)
// === 8. EMA ===
ema20 = request.security(syminfo.tickerid, tf, ta.ema(close, 20))
ema50 = request.security(syminfo.tickerid, tf, ta.ema(close, 50))
// === 9. Historical Volatility (HV) ===
logReturns = math.log(close / close )
hv = request.security(syminfo.tickerid, tf, ta.stdev(logReturns, 20) * math.sqrt(252))
plot(vwap_htf, "VWAP")
plot(macd_val, "MACD", color=color.blue)
plot(rsi_htf, "RSI", color=color.purple)

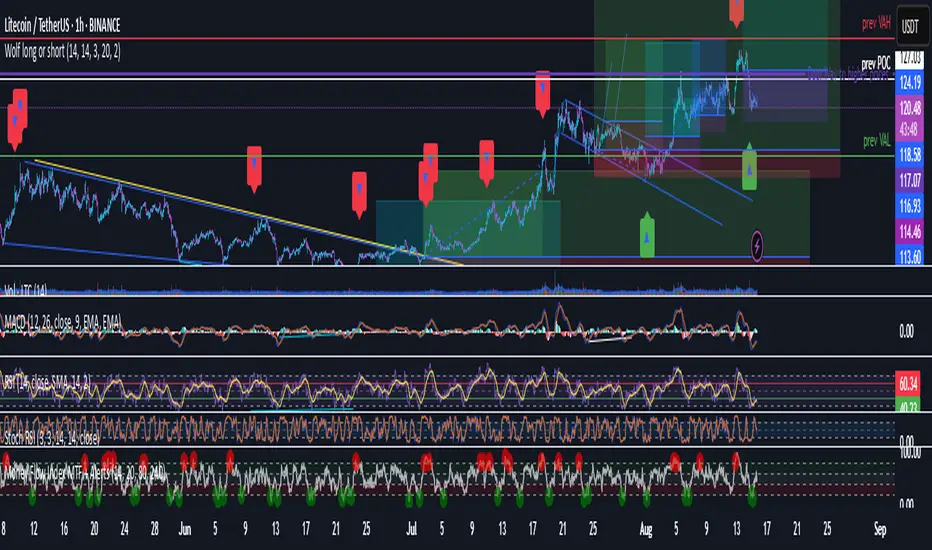
Wolf long or short this indicator is based on RSI, Stoch, BB , this indicator is giving a better understanding of short or long combined with 3 indicator
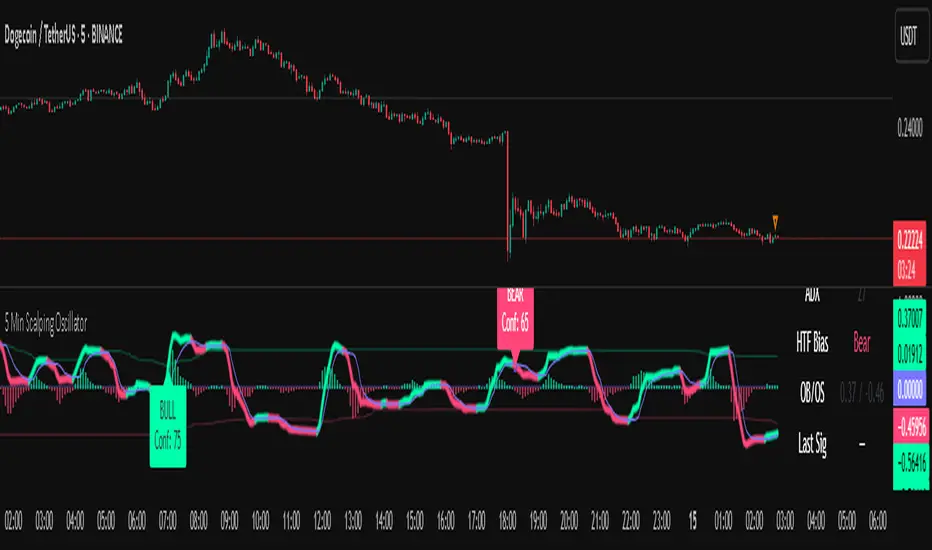
5 Min Scalping Oscillator### Overview
The 5 Min Scalping Oscillator is a custom oscillator designed to provide traders with a unified momentum signal by fusing normalized versions of the Relative Strength Index (RSI), Stochastic RSI, and Commodity Channel Index (CCI). This combination creates a more balanced view of market momentum, overbought/oversold conditions, and potential reversals, while incorporating adaptive smoothing, dynamic thresholds, and market condition filters to reduce noise and false signals. Unlike standalone oscillators, the 5 Min Scalping Oscillator adapts to trending or sideways regimes, volatility levels, and higher timeframe biases, making it particularly suited for short-term charts like 5-minute timeframes where quick, filtered signals are valuable.
### Purpose and Originality of the Fusion
Traditional oscillators like RSI measure momentum but can lag in volatile markets; Stochastic RSI adds sensitivity to RSI extremes but often generates excessive noise; and CCI identifies cyclical deviations but may overreact to minor price swings. The 5 Min Scalping Oscillator addresses these limitations by weighting and blending their normalized outputs (RSI at 45%, Stochastic RSI at 35%, and CCI at 20%) into a single raw oscillator value. This weighted fusion creates a hybrid signal that balances lag reduction with noise filtering, resulting in a more robust indicator for identifying reversal opportunities.
The originality lies in extending this fusion with:
- **Adaptive Smoothing via KAMA (Kaufman's Adaptive Moving Average):** Adjusts responsiveness based on market efficiency, speeding up in trends and slowing in ranges—unlike fixed EMAs, this helps preserve signal integrity without over-smoothing.
- **Dynamic Overbought/Oversold Thresholds:** Calculated using rolling percentiles over a user-defined lookback (default 200+ periods), these levels adapt to recent oscillator behavior rather than relying on static values like 70/30, making the indicator more responsive to asset-specific volatility.
- **Multi-Factor Filters:** Integrates ADX for trend detection, ATR percentiles for volatility confirmation, and optional higher timeframe RSI bias to ensure signals align with broader market context. This layered approach reduces false positives (e.g., ignoring low-volatility crossovers) and adds a confidence score based on filter alignment, which is not typically found in simple mashups.
This design justifies the combination: it's not a mere overlay of indicators but a purposeful integration that enhances usefulness by providing context-aware signals, helping traders avoid common pitfalls like trading against the trend or in low-volatility chop. The result is an original tool that performs better in diverse conditions, especially on 5-minute charts for intraday trading, where rapid adaptations are key.
### How It Works
The 5 Min Scalping Oscillator processes price data through these steps:
1. **Normalization and Fusion:**
- RSI (default length 10) is normalized to a -1 to +1 scale using a tanh transformation for bounded output.
- Stochastic RSI (default length 14) is derived from RSI highs/lows and scaled similarly.
- CCI (default length 14) is tanh-normalized to align with the others.
- These are weighted and summed into a raw value, emphasizing RSI for core momentum while using Stochastic RSI for edge sensitivity and CCI for cycle detection.
2. **Smoothing and Signal Line:**
- The raw value is smoothed (default KAMA with fast/slow periods 2/30 and efficiency length 10) to reduce whipsaws.
- A shorter signal line (half the smoothing length) is added for crossover detections.
3. **Filters and Enhancements:**
- **Trend Regime:** ADX (default length 14, threshold 20) classifies markets as trending (ADX > threshold) or sideways, allowing signals in both but prioritizing alignment.
- **Volatility Check:** ATR (default length 14) percentile (default 85%) ensures signals only trigger in above-average volatility, filtering out flat markets.
- **Higher Timeframe Bias:** Optional RSI (default length 14 on 60-minute timeframe) provides bull/neutral/bear bias (above 55, 45-55, below 45), requiring signal alignment (e.g., bullish signals only if bias is neutral or bull).
- **Dynamic Levels:** Percentiles (default OB 85%, OS 15%) over recent oscillator values set adaptive overbought/oversold lines.
4. **Signal Generation:**
- Bullish (B) signals on upward crossovers of the smoothed line over the signal line, filtered by conditions.
- Bearish (S) signals on downward crossunders.
- Each signal includes a confidence score (0-100) based on factors like trend alignment (25 points), volatility (15 points), and bias (20 points if strong, 10 if neutral).
The output includes a glowing oscillator line, histogram for divergence spotting, dynamic levels, shapes/labels for signals, and a dashboard table summarizing regime, ADX, bias, levels, and last signal.
### How to Use It
This indicator is easy to apply and interpret, even for beginners:
- **Adding to Chart:** Apply the 5 Min Scalping Oscillator to a clean chart (no other indicators unless explained). It's non-overlay, so it appears in a separate pane. For 5-minute timeframes, keep defaults or tweak lengths shorter for faster response (e.g., RSI 8-12).
- **Interpreting Signals:**
- Look for green upward triangles labeled "B" (bullish) at the bottom for potential entry opportunities in uptrends or reversals.
- Red downward triangles labeled "S" (bearish) at the top signal potential exits or shorts.
- Higher confidence scores (e.g., 70+) indicate stronger alignment—use these for priority trades.
- Watch the histogram for divergences (e.g., price higher highs but histogram lower highs suggest weakening momentum).
- Dynamic OB (green line) and OS (red line) help gauge extremes; signals near these are more reliable.
- **Dashboard:** At the bottom-right, it shows real-time info like "Trending" or "Sideways" regime, ADX value, HTF bias (Bull/Neutral/Bear), OB/OS levels, and last signal—use this for quick context.
- **Customization:** Adjust inputs via the settings panel:
- Toggle KAMA for adaptive vs. EMA smoothing.
- Set HTF to "60" for 1-hour bias on 5-min charts.
- Increase ADX threshold to 25 for stricter trend filtering.
- **Best Practices:** Combine with price action (e.g., support/resistance) or volume for confirmation. On 5-min charts, pair with a 1-hour HTF for intraday scalping. Always use stop-losses and risk no more than 1-2% per trade.
### Default Settings Explanation
Defaults are optimized for 5-minute charts on volatile assets like stocks or forex:
- RSI/Stoch/CCI lengths (10/14/14): Shorter for quick momentum capture.
- Signal smoothing (5): Responsive without excessive lag.
- ADX threshold (20): Balances trend detection.
- ATR percentile (0.85): Filters ~15% of low-vol signals.
- HTF RSI (14 on 60-min): Aligns with hourly trends.
- Percentiles (OB 85%, OS 15%): Adaptive to recent data.
If changing, test on historical data to ensure fit—e.g., longer lengths for less noisy assets.
### Disclaimer
The 5 Min Scalping Oscillator is an educational tool to visualize momentum and does not guarantee profits or predict future performance. All signals are based on historical calculations and should not be used as standalone trading advice. Past results are not indicative of future outcomes. Traders must conduct their own analysis, use proper risk management, and consider market conditions. No claims are made about accuracy, reliability, or performance.
New RSI📌 New RSI
The New RSI is a modern, enhanced version of the classic RSI created in 1978 — redesigned for today’s fast-moving markets, where algorithmic trading and AI dominate price action.
This indicator combines:
Adaptive RSI: Adjusts its calculation length in real time based on market volatility, making it more responsive during high volatility and smoother during calm periods.
Dynamic Bands: Upper and lower bands calculated from historical RSI volatility, helping you spot overbought/oversold conditions with greater accuracy.
Trend & Regime Filters: EMA and ADX-based detection to confirm signals only in favorable market conditions.
Volume Confirmation: Signals appear only when high trading volume supports the move — green volume for bullish setups and red volume for bearish setups — filtering out weak and unreliable trades.
💡 How it works:
A LONG signal appears when RSI crosses above the lower band and the volume is high with a bullish candle.
A SHORT signal appears when RSI crosses below the upper band and the volume is high with a bearish candle.
Trend and higher timeframe filters (optional) can help improve precision and adapt to different trading styles.
✅ Best Use Cases:
Identify high-probability reversals or pullbacks with strong momentum confirmation.
Avoid false signals by trading only when volume validates the move.
Combine with your own support/resistance or price action strategy for even higher accuracy.
⚙️ Fully Customizable:
Adjustable RSI settings (length, volatility adaptation, smoothing)
Dynamic band sensitivity
Volume threshold multiplier
Higher timeframe RSI filter
Color-coded background for market regime visualization
This is not just another RSI — it’s a complete, next-gen momentum tool designed for traders who want accuracy, adaptability, and confirmation in every signal.
Cnagda Trading ToolCnagda Trading Tools - complete set of intraday trading
1. Trendline breakout based On ATR.
2. Live RSI, volume/candle average 20 Periods, trend direction last 34 periods, and some useful dashboard features.
3. Ma Scalp Line provide trend support and resistance + Where Line More Flat Previous Time You Also Use That Range As Support And Resistance
4. RSI based POC ( Point Of Control) indicate high Volume Area like fixed Range Volume profile
5. London session breakout with buy/sell Signal and NewYork session opening half hour range breakout with Buy/sell signal
Ma Scalp Buy And Sell Signal For Short term Scalping ( 5 Min Timeframe) Based on Ema And Wma Crossover
I hope these tools will improve your trading, but you should trade only after proper research, this indicator is not responsible for any loss.

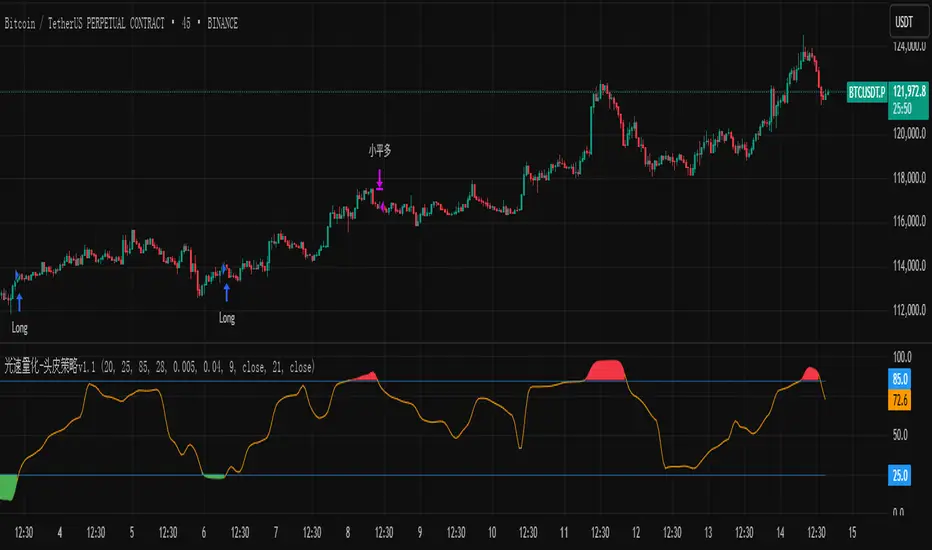
光速量化-头皮策略v1.1Version: Unlimited trial version.
Principle: RSI and moving average complement each other, taking a bite of both oscillation and trend.
Disadvantage: High drawdown.
Disclaimer: The scalp strategy v1.1 of Lightspeed Quantification is designed for trial users. Those who use this strategy are responsible for their own assets, and any losses incurred are not the responsibility of the author.
版本:无期限试用版。
原理:RSI与均线配合,震荡与趋势都吃一口。
缺点:回撤高。
声明:光速量化的头皮策略v1.1是面向试用者体验的,使用该策略的人请为自己的资产负责,产生任何损失与作者无关。
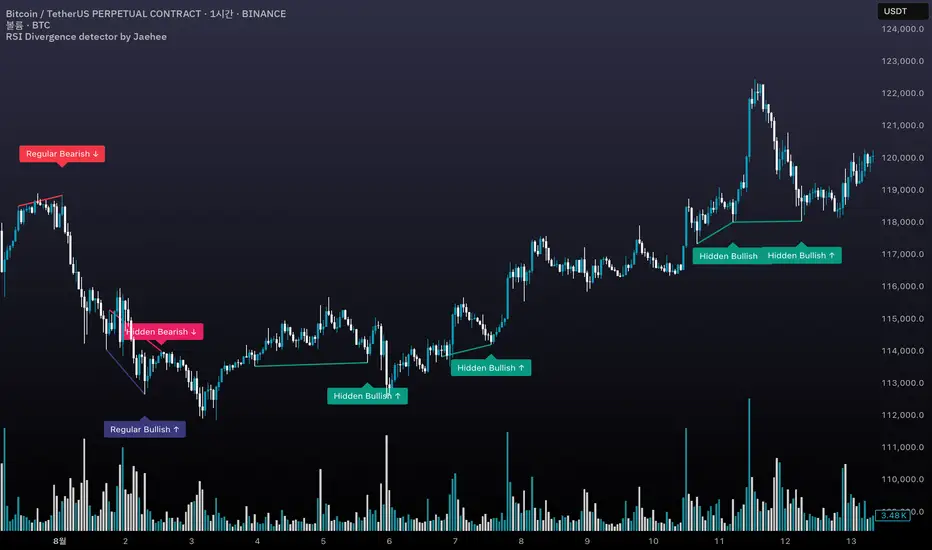
RSI Divergence detector by Jaehee📌 RSI DIVERGENCE DETECTOR — Instant Detection of Regular & Hidden Divergences with Color-Coded Labels
🔍 WHAT IT IS
• Detects regular and hidden divergences between price and RSI instantly, without the delay common in other divergence indicators
• Displays divergences directly on the chart with color-coded labels and connecting lines for instant visual recognition
• Uses different label colors for each divergence type so traders can identify setups at a glance
⚙️ HOW IT WORKS
• RSI Calculation — RSI is computed from a chosen price source with adjustable length
• Immediate Pivot Detection — Identifies pivots just one bar after formation for minimal delay
• RSI Delta Filter — Requires a minimum RSI difference to reduce noise and false signals
• Divergence Logic
Regular Bullish: Price lower low • RSI higher low
Regular Bearish: Price higher high • RSI lower high
Hidden Bullish: Price higher low • RSI lower low
Hidden Bearish: Price lower high • RSI higher high
• Visual Output — Connects pivot points with lines and adds labels above/below bars in colors you set
💡 WHY THIS COMBINATION
• Instant feedback — Acts faster than typical divergence tools that wait for multiple bar confirmations
• All-in-one detection — Regular and hidden divergences in the same tool
• Visual clarity — Distinct label colors make type recognition immediate
• Customizable — Adjust RSI length, pivot sensitivity, color scheme, and filtering to your style
🆚 HOW IT DIFFERS FROM COMMON DIVERGENCE INDICATORS
• Displays divergence the moment a pivot forms
• Detects both regular and hidden divergences in real time
• Applies RSI difference filtering for better quality
• Offers full color customization for each divergence type
📖 HOW TO READ IT (CONTEXT, NOT SIGNALS)
• Regular Bullish ↑ — Possible upward reversal or trend continuation after pullback
• Regular Bearish ↓ — Possible downward reversal or continuation after rally
• Hidden Bullish ↑ — Often a trend continuation signal in uptrends
• Hidden Bearish ↓ — Often a trend continuation signal in downtrends
• Always confirm with trend, momentum, or volume tools before trading
🛠 INPUTS
• RSI source and length
• Pivot lookback bars (left/right)
• Minimum RSI difference
• Custom colors for each divergence type
🎨 DESIGN NOTES
• Overlay on price chart for context
• Lines connect relevant pivots for clarity
• Labels placed near pivot highs/lows for easy spotting
• Customizable colors for personal visual preferences
⚠️ LIMITATIONS AND GOOD PRACTICE
• Divergence is not a guaranteed reversal signal
• Strong trends may override divergence setups
• False signals can occur in low volume or choppy markets
• Best used with a complete trading system and risk management
📂 DEFAULTS AND SCOPE
• Works on all OHLCV instruments and timeframes
• No repainting after pivot confirmation
💬 AUTHOR’S NOTE FOR REVIEW
This script is not a repackaging of existing tools. It integrates immediate divergence detection, hidden divergence analysis, and visual type separation into a single, customizable package. All features interact to deliver faster, clearer market context without generating trade signals or making performance claims.
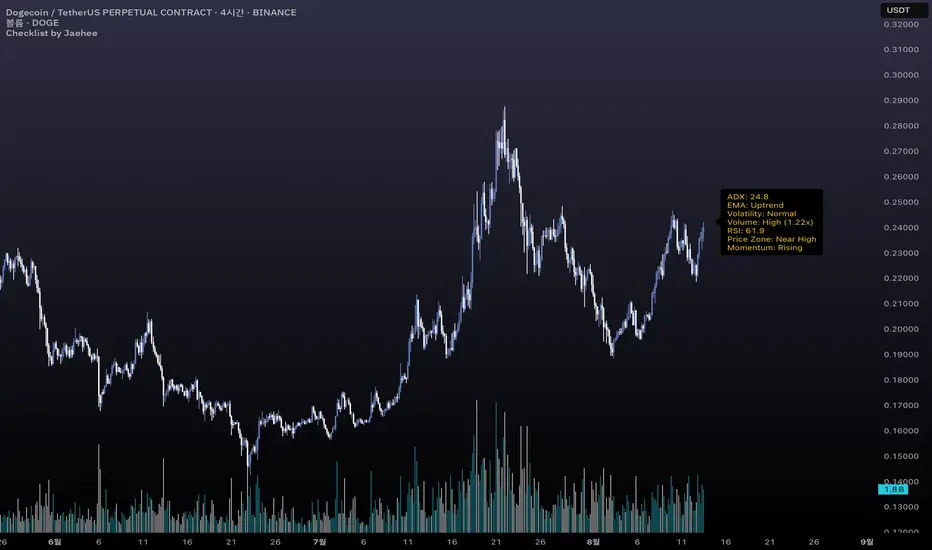
Checklist by JaeheeThe checklist is a market context tool that consolidates seven key metrics into a single on-chart panel, helping traders quickly gauge market conditions without switching between multiple indicators.
1. Display Panel (7 metrics):
ADX: Trend intensity (Above 20 often indicates a stronger, more reliable trend)
EMA Structure: 5/20/60/120/240 EMA alignment (Uptrend, Downtrend, or Mixed state)
Volatility: ATR regime classification (High volatility may require wider stops)
Volume State: Relative to 20-bar SMA with spike multiple (High volume often confirms price moves)
RSI: Current RSI(14) value (Above 70 = overbought zone, below 30 = oversold zone)
Price Zone: Location within the last 20-bar range (Near High, Mid, or Near Low)
Momentum Slope: MACD histogram slope (Rising suggests building momentum; Falling suggests fading momentum)
2. Purpose & Use:
Designed for traders—especially beginners—who want to speed up market scanning.
Keeps a concise, standardized “checklist” visible on the right side of the chart.
Use as a contextual reference, not as an entry/exit signal.
3. Features:
Compact label HUD anchored to the chart’s right margin.
Automatic refresh on each bar close with only one label to avoid clutter.
Works on any timeframe and symbol that supports OHLCV data.
RSI Z-score | Lemniscuss🧠 Introducing RSI Z-Score (RSI-Z) by Lemniscuss
🛠️ Overview
RSI Z-Score (RSI-Z) is a momentum-based market condition detector that transforms the classic Relative Strength Index (RSI) into a standardized volatility framework.
By applying Z-Score normalization to the RSI, this tool allows traders to identify statistically significant deviations in momentum — cutting through noise and highlighting high-probability turning points.
RSI-Z is optimized for trend inflection detection and overextension spotting, providing both visual clarity and actionable trade signals with dynamic labeling and optional bar coloring.
🔍 How It Works
1️⃣ RSI Foundation
The system starts with a standard RSI calculation on a user-defined source and length (default: 45).
2️⃣ Z-Score Normalization
The RSI values are standardized by subtracting their mean and dividing by the standard deviation over the same lookback.
This converts RSI into a statistical measure — revealing how many standard deviations current momentum is from its mean.
3️⃣ Threshold Logic
Two customizable thresholds define actionable zones:
• Long Threshold → Signals bullish momentum shifts when crossed upward
• Short Threshold → Signals bearish momentum shifts when crossed downward
4️⃣ Signal State Tracking
A state variable locks in a bias (Long / Short / Neutral) until an opposing trigger appears, ensuring clear and consistent market bias mapping.
✨ Key Features
🔹 Statistically Driven Momentum Detection — Moves beyond fixed RSI overbought/oversold levels by using standard deviations for adaptive accuracy.
🔹 Customizable Thresholds — Fine-tune long/short triggers for different volatility environments.
🔹 Clear Visual Feedback — Candle coloring and signal labels make trade setups instantly recognizable.
🔹 Overlay-Friendly — Works directly on your main chart or in a separate pane.
⚙️ Custom Settings
• Source: Price stream for RSI calculation (default: close)
• RSI Length: Lookback period for RSI & Z-Score (default: 45)
• Long Threshold: Z-score value for bullish signal (default: 1)
• Short Threshold: Z-score value for bearish signal (default: -1.9)
• Long/Cash Signal Labels: Toggle for "Long"/"Short" markers
• Bar Coloring: Toggle for trend-based candle coloring
📌 Trading Applications
✅ Trend Reversals → Spot statistically significant shifts in momentum before traditional RSI signals trigger
✅ Overextension Monitoring → Identify when momentum has deviated too far from the mean
✅ Mean Reversion Setups → Use extreme Z-score values as potential reversion points
✅ Bias Confirmation → Combine with trend tools for higher conviction entries/exits
📌 Conclusion
RSI-Z by Lemniscuss offers a clean, statistics-backed upgrade to the classic RSI.
By framing momentum in standard deviation terms, it empowers traders to separate normal fluctuations from truly significant market moves — making it a valuable tool for both trend traders and mean reversion specialists.
🔹 Summary Highlights
1️⃣ Statistical upgrade to RSI for higher-quality signals
2️⃣ Threshold-based, customizable long/short triggers
3️⃣ Visual candle coloring & signal labels for clarity
4️⃣ Adaptable to trend, swing, or intraday strategies
📌 Disclaimer: Past performance is not indicative of future results. No indicator guarantees profitability — always test and manage risk appropriately.

Minimalist RSI - Nasdaq (14) with Volume Filter and AlertsDescription:
This indicator shows the standard RSI (period 14) adapted for Nasdaq, with a clean and minimalist design. It adds visual levels for overbought (75) and oversold (25), plus an optional centerline 50 to better interpret momentum.
It incorporates a high volume visual filter to confirm signals and avoid false entries in low-interest conditions. Buy and sell signals are based on RSI crosses in extreme zones, optionally filtered by volume to improve reliability.
You can enable automatic alerts to receive notifications when important signals occur.
How to use:
Watch the RSI and its position relative to overbought/oversold zones and the 50 line.
Wait for high volume confirmation for greater reliability (you can disable this filter if preferred).
Use buy and sell signals alongside your price action and overall context analysis to make decisions.
Set alerts to not miss opportunities.
Important Notice:
This indicator is a support tool, not a complete strategy. Trading involves risks and no guarantees. Always use risk management and test the indicator on a demo before using it live.
Personal note:
This is my first script and I would love to receive constructive feedback to improve and offer better tools to the community. Thanks for trying it!
Motivational phrase:
“No risk, no reward.”
RSI Momentum Divergence Zones [ChartPrime]⯁ OVERVIEW
RSI Momentum Divergence Zones is a hybrid oscillator and chart overlay tool that detects RSI-based momentum divergences and projects them as key zones on the chart. By combining RSI divergence logic with horizontal level plotting, this indicator reveals high-probability support and resistance areas where price has historically reacted to hidden or classic divergences.
⯁ KEY FEATURES
Momentum-Based RSI Source:
Instead of the classic RSI input, this tool uses the momentum of price as the RSI source:
rsiSrc = ta.mom(close, 10)
This emphasizes acceleration and deceleration of price moves, sharpening divergence signals and making them more responsive to early shifts in momentum.
Automatic Divergence Detection (Optional):
When enabled, the indicator continuously scans for:
— Bullish Divergence : Price makes a Lower Low while RSI forms a Higher Low
— Bearish Divergence : Price makes a Higher High while RSI forms a Lower High
It ensures divergence is valid by checking the spacing between pivots (min 5, max 50 bars).
Divergence Labels & Markers (RSI Pane + Chart):
When a valid divergence is detected:
— On RSI pane:
Labels appear at HL/LH points (“Bull” / “Bear”)
Colored lines show pivot structures
— On price chart:
Labels (“▲ Bull” / “Bear ▼”) mark price pivot that triggered the divergence
Lines highlight the exact price level at the divergence origin
Divergence Zones / Levels (Toggleable):
The indicator projects horizontal zones across the chart based on confirmed divergence points.
These levels dynamically extend as long as price respects them, and auto-expire once broken.
They act as S/R levels created by market imbalance caused by divergence reactions.
Dynamic Zone Extension Logic:
Once plotted, divergence levels will extend to the right:
— If price respects the level, the zone keeps growing
— If broken in the opposite direction, the level stops extending and turns dashed (visually showing break)
Zone Layering and Limit Control:
You can limit the number of simultaneous zones shown on the chart (e.g., 10 most recent).
Old zones automatically expire and are removed to keep the chart clean and focused.
Color Customization and Intensity:
Different colors for bullish and bearish zones let you easily distinguish trend direction.
Background fill, line width, and transparency are all adjustable.
Clean Zone Management with Arrays:
Behind the scenes, the script uses custom divLevel type arrays to manage plotted levels, ensuring they stay up-to-date, extend correctly, and delete once invalidated.
⯁ USAGE
Use bullish divergence zones as potential demand areas and bearish ones as supply zones.
Combine RSI pane labels with price-level zones to confirm strength of reversal.
Watch for price approaching a divergence level to anticipate reactions or breakouts.
Use divergence levels as trade triggers, stop-loss guides, or take-profit markers.
Limit signal count using the “Qty Divergence Zones” setting to reduce chart clutter.
Enable divergence detection only when you want to focus on key structural zones — ideal for swing or positional setups.
⯁ CONCLUSION
RSI Momentum Divergence Zones blends oscillator divergence logic with price action structure to uncover hidden strength or weakness in the market. With flexible zone plotting and clean visual signals, this tool empowers traders to identify where momentum turns into structure — turning hidden signals into tradable edges.

Multi-Timeframe RSIRSI Divergence (Time-Based Engine)
This script is a powerful and highly customizable tool designed to automatically detect and display RSI divergences from up to three independent, user-defined timeframes directly on your chart. It eliminates the need to manually switch between timeframes to find these critical trading signals, allowing you to see long-term and short-term divergences all in one place.
The engine is built to be flexible, supporting both regular (reversal) divergences and hidden (trend-continuation) divergences. It's designed for traders who rely on divergence analysis as a core part of their strategy.
Key Features
Multi-Timeframe (MTF) Analysis: Configure and display divergences from up to three different timeframes simultaneously (e.g., show 4-Hour, Daily, and Weekly divergences on your 1-Hour chart). Each timeframe operates independently with its own settings.
Regular & Hidden Divergence: The script can detect both standard regular divergences that signal potential reversals and hidden divergences that suggest a trend may continue.
Configurable Pivot Strength: You have full control over the sensitivity of pivot detection. The 'Left Strength' and 'Right Strength' settings allow you to define what qualifies as a significant price pivot, filtering out market noise.
Bar Count Filter: Refine your signals by setting the minimum and maximum number of bars allowed between two pivots. This ensures you only see divergences that fit your specific strategic timeframe.
Dedicated Alerts: Each of the three timeframes has its own "Enable Alerts" toggle. When a new divergence line is drawn on the chart for a specific timeframe, a corresponding alert can be triggered, ensuring you never miss a potential setup.
Full Visual Customization: Tailor the look and feel of the indicator to your preference. Each timeframe has unique color settings for its bullish and bearish lines, allowing for easy visual identification. You can also toggle the visibility of various chart markers to keep your view clean.
How to Use
1. Add the indicator to your chart.
2. Open the Settings panel.
3. For each timeframe you wish to use (1, 2, or 3), check the "Enable Timeframe" box.
4. Select the desired Timeframe, RSI Length, and Pivot Strength for each active engine.
5. Adjust the Min/Max Bars filter to match your trading style.
6. If you want to receive notifications, check the "Enable Alerts" box for the desired timeframe(s). Then, create an alert using TradingView's alert manager, selecting the indicator and choosing the "Any alert() function call" option.

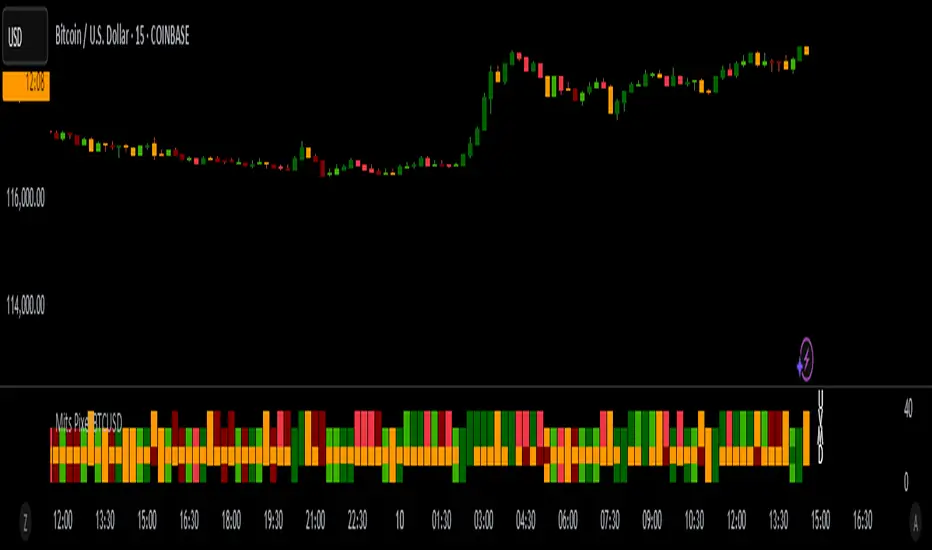
Mits Pixel BTCUSDStrategy
Using Rsi Stochastic, Hull Moving Average, Price Action and volume differences to get signals
HOW IT WORKS
Pixel parts :
- (U) The first pixel is a pixel that shows a trend during an uptrend, a trend when the market is considered bullish (above the MA line)
- (V) The second pixel is the volume pixel, showing the up and down movement of the buy / sell volume .
- (M) The third pixel is the momentum pixel, showing the market momentum whether it is overbought or oversold.
- (D) The fourth pixel is a pixel that shows a trend during a downtrend, a trend when the market is considered bearish (below the MA line)
When the price opens above the MA line, 3 pixels will appear, namely the first Pixel which is called the Trend up Pixel, Pixel Volume , and also the Momentum Pixel.
When the price opens below the MA line, 3 pixels will appear, namely Pixel Volume , Pixel Momentum, and the bottom one is the Pixel Down Trend.
* Pixel up trend (appears when the open is above the MA line)
- The pixel will show a solid green color when a gap up is opened or volume up, then the close price is greater than the open price.
- The pixel will show a light green color if there is normal strengthening (the close is bigger than the previous day's close without creating a gap up), then the close price is bigger than the open price.
- Pixel will show yellow color if it meets several criteria, for example, close is equal to open or close is bigger than the previous close but close is smaller than open.
- The pixel will show a dark red color when there is attenuation and a Gap down is created, then the close price is smaller than the open price.
- Pixel will show red color if there is normal weakening (close is smaller than the close of the previous day without creating a gap down), then the close price is smaller than the open price.
* Pixel down trend (appears when the open is below the Moving Average)
The pixel color indication is the same as the Trend up Pixel
* Volume Pixel
- The pixel is dark green when there is an increase and a gap up is created and the volume for that day is bigger than the volume of the previous day.
- The pixel will be green if there is a normal strengthening and also the volume for that day is greater than the volume of the previous day, or there is a gap up but the volume is smaller than the volume of the previous day.
- The pixel is yellow if it meets several conditions, for example, the volume of the day is the same as the volume of the previous day.
- The pixel is dark red when there is weakness and a Gap down is created and also the volume of the day's weakness is greater than the volume of the previous day.
- The pixel is red if there is normal weakening and also the volume of the day's weakness is bigger than the previous day's volume , or if there is a gap down but the volume is smaller than the previous day's volume .
* Momentum Pixel (basically StochRSI combined with other HMA , TopBox (Resistance), BottomBox(Support)).
- The pixel is dark green when it meets several conditions, for example the golden cross is below 50.
- The pixel is green if it meets several conditions, for example a golden cross below 50 without Gap up.
- Pixel will be yellow if it meets several conditions, for example k is greater than d and k has entered the overbought area (greater than 80).
- Pixel is dark red when it meets several conditions, for example k is smaller than d and k has entered the overbought area.
- Pixel is red when it meets several conditions, for example k is smaller than d and k is greater than 50 and k is less than 80.
Bar Color
Dark Green : Price Up + Volume Up
Green : Price Up + Volume Down
Dark Red : Price Down + Volume Up
Red : Price Down + Volume Down
Too many details that cannot be detailed one by one , but in broad outline as explained above.
HOW TO USE
* Signals Buy
- Strong Buy : All pixels are green, and Momentum Pixel is dark green.
- Normal Buy : All pixels are green or two dark green (one of them must momentum pixel) and one yellow.
- Spek Buy : * Two green pixels (one of them must momentum pixel) and one yellow or 1 green/dark green in momentum pixel, and other pixels yellow
* Signals Sell
- Strong Sell : All pixels are red, and Momentum Pixel is dark red.
- Normal Sell : All pixels are either red or two dark red (one of them must momentum pixel) and one yellow.
- Spek Sell : Two red pixels (one of them must momentum pixel) and one yellow or 1 dark red in momentum pixel, and other pixels yellow
- Warning Sell : Momentum pixels are dark red, regardless of the color of the other pixels.
* Best use for trading in BTCUSD markets
* Change from just an invitation script to a protected script for publication.
* Final Release
Thanks for Moderators