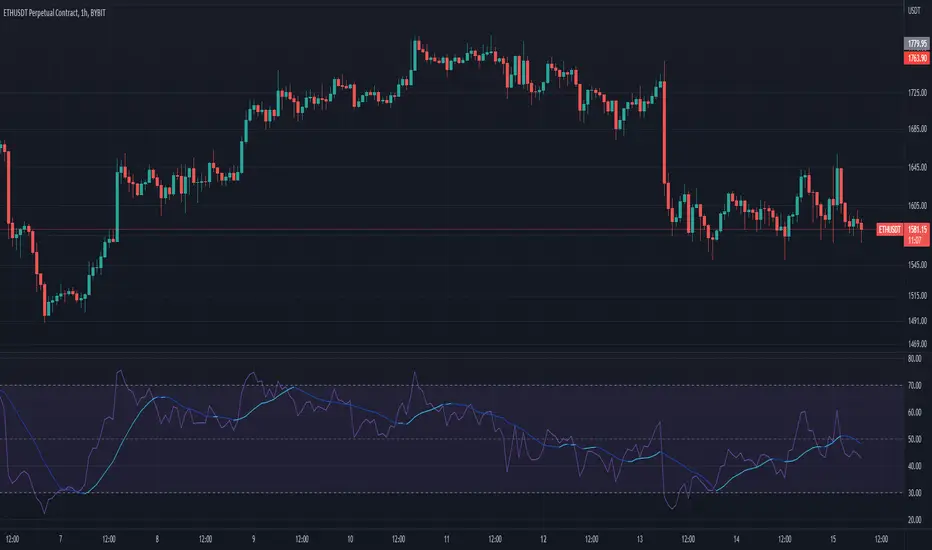
MAs on RSI Reddy2 RSI based EMAs fast and slow, fast ema should come out of oversold or overbought zones and cross slow ema
Divergences also works
相対力指数 (RSI)

Free Volume RSIdear fellows,
this indicator is a mod or tweak on the standard RSI here available.
the original RSI formula is, as you know,
100 - 100/(1+RS)
which equals to
100 * RS/(1+RS)
where
the 100 factor is merely a scale adjustment to 100's percent basis
the RS is the ratio between average gain and average loss within the last N candles.
thus, the absolute gain of the up candles within the last N candles window is averaged; same for absolute loss.
this averaging uses EMA.
the ratio between this averages is RS.
the RS ranges from 0 to infinity, thus the ratio RS/(1+RS) locks it between 0 and 1.
in regard of our changes
we use VWMA instead of EMA
we plot the resulting RS directly, instead of its smooth version RS/(1+RS)
we dismiss the 100 factor.
we specify logarithmic scale for the resulting plot
on the justifications of our changes
by using VWMA instead of EMA we get both a more dynamic averaging (WMA is faster) as well as a de facto strength of the price action, since now volume is considered alongside the price change. this way one can quantify accumulation and distribution intensities.
to anyone who ever was restricted against his will over a sufficiently large period of time on his freedom to move, would understand that an unrestricted indicator conveys better its info.
as we're dealing with ratios, the distance between 1 and 2 is the same between 1 and 0.5; thus, a log scale is specified for reading this indicator without distortions.
on how to use this indicators
this is still an early result, hence it lacks more testing.
so far, when it's oversold, buy; and vice versa.
best regards.

RSI-Adaptive, GKYZ-Filtered DEMA [Loxx]RSI-Adaptive, GKYZ-Filtered DEMA is a Garman-Klass-Yang-Zhang Historical Volatility Filtered, RSI-Adaptive Double Exponential Moving Average. This is an experimental indicator. The way this is calculated is by turning RSI into an alpha value that is then injected into a DEMA function to output price. Price is then filtered using GKYZ Historical volatility. This process of creating an alpha out of RSI is only relevant to EMA-based moving averages that use an alpha value for it's calculation.
What is Garman-Klass-Yang-Zhang Historical Volatility?
Yang and Zhang derived an extension to the Garman Klass historical volatility estimator that allows for opening jumps. It assumes Brownian motion with zero drift. This is currently the preferred version of open-high-low-close volatility estimator for zero drift and has an efficiency of 8 times the classic close-to-close estimator. Note that when the drift is nonzero, but instead relative large to the volatility , this estimator will tend to overestimate the volatility . The Garman-Klass-Yang-Zhang Historical Volatility calculation is as follows:
GKYZHV = sqrt((Z/n) * sum((log(open(k)/close( k-1 )))^2 + (0.5*(log(high(k)/low(k)))^2) - (2*log(2) - 1)*(log(close(k)/open(2:end)))^2))
Included
Alerts
Signals
Loxx's Expanded Source Types
Bar coloring

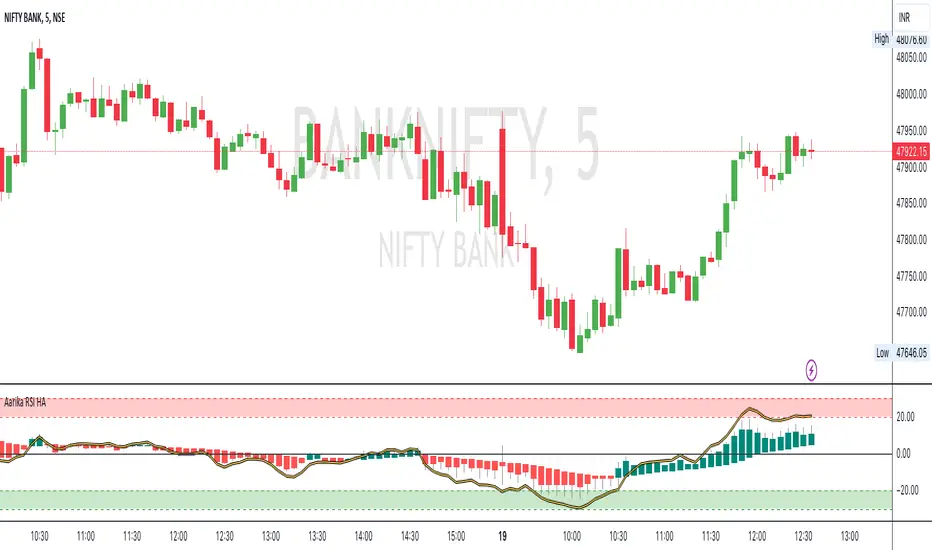
Aarika RSIHello traders, purpose of creating this indicator is simply trying to analyse the trend of any symbol.
This indicator can be used on any script like Indices, Stocks, Future, Currency & Crypto.
This RSI version is much simpler to identify the trend of the script than that of traditional RSI trendline. Rather than showing a line, this RSI indicates bars for better and clear visibility of RSI levels.
This is a modified version of © ParkF. I have modified it to simplest possible manner.
How to trade:
RSI level 80, I consider this as extreme-bought which means high chance if bear market from this point on any given timeframe. Whereas 20 is considered as extreme-sold and have a chance to go higher from the current level.
I recommend you to study this RSI before putting it into practice.
Always start with small target and then go for big one by trailing your profit. This is not a Holy Grail indicator which always gives profit but if you practice this indicator with consistency, your portfolio may give good returns.
Use proper money management for any trade. Go for paper trade and observe how this indicator behaves and once satisfied then only take real trade.
Disclaimer: Please make sure you study this indicator on different timeframes because inserted set of data may act differently on different scripts and may vary from timeframe to timeframe.
We advice you to use this indicator for trend-analysis and study purpose only. Author/publisher of this indicator is not responsible for your profit or loss if you use this indicator for trading purpose one way or another.
N.B.: We do not recommend using HeikinAshi charting for this particular indicator as the data inputs may behave differently than expected. If you have any query, you may comment below.
RSI Past Can Turn RSI Into a Directional ToolThe Relative Strength Index was created by J. Welles Wilder to measure overbought and oversold conditions. It’s also found popularity as an overall measure of direction because upward-trending stocks often hit overbought conditions. The opposite can be true with underperformers.
Today’s custom script, RSI Past, attempts to capture this secondary use of RSI as a directional indicator.
RSI Past achieves this by comparing how many bars have passed since RSI's most recent overbought and oversold readings. It then plots a simple difference between those two numbers.
Stocks with “bullish” signals will have positive readings that will increase each time RSI hits an overbought condition.
“Bearish” readings are just the opposite, growing more negative as oversold conditions occur.
An examination of some individual stocks may show the usefulness of this approach.
Meta Platforms , for example, hit an oversold condition almost exactly one year ago, and has remained under heavy selling pressure since:
Exxon Mobil , on the other hand, flipped to a bullish reading last October and has trended higher since:
This raises some interesting questions for Apple, shown on the main chart above. AAPL’s RSI Past has maintained a bullish reading for over a year -- unlike most other big technology stocks and the broader Nasdaq-100. Could this reflect bigger directional strength, especially with prices holding the $150 level that’s had relevance several times mid-2021?
TradeStation has, for decades, advanced the trading industry, providing access to stocks, options, futures and cryptocurrencies. See our Overview for more.
Important Information
TradeStation Securities, Inc., TradeStation Crypto, Inc., and TradeStation Technologies, Inc. are each wholly owned subsidiaries of TradeStation Group, Inc., all operating, and providing products and services, under the TradeStation brand and trademark. You Can Trade, Inc. is also a wholly owned subsidiary of TradeStation Group, Inc., operating under its own brand and trademarks. TradeStation Crypto, Inc. offers to self-directed investors and traders cryptocurrency brokerage services. It is neither licensed with the SEC or the CFTC nor is it a Member of NFA. When applying for, or purchasing, accounts, subscriptions, products, and services, it is important that you know which company you will be dealing with. Please click here for further important information explaining what this means.
This content is for informational and educational purposes only. This is not a recommendation regarding any investment or investment strategy. Any opinions expressed herein are those of the author and do not represent the views or opinions of TradeStation or any of its affiliates.
Investing involves risks. Past performance, whether actual or indicated by historical tests of strategies, is no guarantee of future performance or success. There is a possibility that you may sustain a loss equal to or greater than your entire investment regardless of which asset class you trade (equities, options, futures, or digital assets); therefore, you should not invest or risk money that you cannot afford to lose. Before trading any asset class, first read the relevant risk disclosure statements on the Important Documents page, found here: www.tradestation.com .

STOCASTIC RSI WITH ALARMS
I added alarms for buying and selling. I just did because ı wanted to see the alarm on the chart. I hope ıt will work it for you.

Possible RSI [Loxx]Possible RSI is a normalized, variety second-pass normalized, Variety RSI with Dynamic Zones and optionl High-Pass IIR digital filtering of source price input. This indicator includes 7 types of RSI.
High-Pass Fitler (optional)
The Ehlers Highpass Filter is a technical analysis tool developed by John F. Ehlers. Based on aerospace analog filters, this filter aims at reducing noise from price data. Ehlers Highpass Filter eliminates wave components with periods longer than a certain value. This reduces lag and makes the oscialltor zero mean. This turns the RSI output into something more similar to Stochasitc RSI where it repsonds to price very quickly.
First Normalization Pass
RSI (Relative Strength Index) is already normalized. Hence, making a normalized RSI seems like a nonsense... if it was not for the "flattening" property of RSI. RSI tends to be flatter and flatter as we increase the calculating period--to the extent that it becomes unusable for levels trading if we increase calculating periods anywhere over the broadly recommended period 8 for RSI. In order to make that (calculating period) have less impact to significant levels usage of RSI trading style in this version a sort of a "raw stochastic" (min/max) normalization is applied.
Second-Pass Variety Normalization Pass
There are three options to choose from:
1. Gaussian (Fisher Transform), this is the default: The Fisher Transform is a function created by John F. Ehlers that converts prices into a Gaussian normal distribution. The normaliztion helps highlights when prices have moved to an extreme, based on recent prices. This may help in spotting turning points in the price of an asset. It also helps show the trend and isolate the price waves within a trend.
2. Softmax: The softmax function, also known as softargmax: or normalized exponential function, converts a vector of K real numbers into a probability distribution of K possible outcomes. It is a generalization of the logistic function to multiple dimensions, and used in multinomial logistic regression. The softmax function is often used as the last activation function of a neural network to normalize the output of a network to a probability distribution over predicted output classes, based on Luce's choice axiom.
3. Regular Normalization (devaitions about the mean): Converts a vector of K real numbers into a probability distribution of K possible outcomes without using log sigmoidal transformation as is done with Softmax. This is basically Softmax without the last step.
Dynamic Zones
As explained in "Stocks & Commodities V15:7 (306-310): Dynamic Zones by Leo Zamansky, Ph .D., and David Stendahl"
Most indicators use a fixed zone for buy and sell signals. Here’ s a concept based on zones that are responsive to past levels of the indicator.
One approach to active investing employs the use of oscillators to exploit tradable market trends. This investing style follows a very simple form of logic: Enter the market only when an oscillator has moved far above or below traditional trading lev- els. However, these oscillator- driven systems lack the ability to evolve with the market because they use fixed buy and sell zones. Traders typically use one set of buy and sell zones for a bull market and substantially different zones for a bear market. And therein lies the problem.
Once traders begin introducing their market opinions into trading equations, by changing the zones, they negate the system’s mechanical nature. The objective is to have a system automatically define its own buy and sell zones and thereby profitably trade in any market — bull or bear. Dynamic zones offer a solution to the problem of fixed buy and sell zones for any oscillator-driven system.
An indicator’s extreme levels can be quantified using statistical methods. These extreme levels are calculated for a certain period and serve as the buy and sell zones for a trading system. The repetition of this statistical process for every value of the indicator creates values that become the dynamic zones. The zones are calculated in such a way that the probability of the indicator value rising above, or falling below, the dynamic zones is equal to a given probability input set by the trader.
To better understand dynamic zones, let's first describe them mathematically and then explain their use. The dynamic zones definition:
Find V such that:
For dynamic zone buy: P{X <= V}=P1
For dynamic zone sell: P{X >= V}=P2
where P1 and P2 are the probabilities set by the trader, X is the value of the indicator for the selected period and V represents the value of the dynamic zone.
The probability input P1 and P2 can be adjusted by the trader to encompass as much or as little data as the trader would like. The smaller the probability, the fewer data values above and below the dynamic zones. This translates into a wider range between the buy and sell zones. If a 10% probability is used for P1 and P2, only those data values that make up the top 10% and bottom 10% for an indicator are used in the construction of the zones. Of the values, 80% will fall between the two extreme levels. Because dynamic zone levels are penetrated so infrequently, when this happens, traders know that the market has truly moved into overbought or oversold territory.
Calculating the Dynamic Zones
The algorithm for the dynamic zones is a series of steps. First, decide the value of the lookback period t. Next, decide the value of the probability Pbuy for buy zone and value of the probability Psell for the sell zone.
For i=1, to the last lookback period, build the distribution f(x) of the price during the lookback period i. Then find the value Vi1 such that the probability of the price less than or equal to Vi1 during the lookback period i is equal to Pbuy. Find the value Vi2 such that the probability of the price greater or equal to Vi2 during the lookback period i is equal to Psell. The sequence of Vi1 for all periods gives the buy zone. The sequence of Vi2 for all periods gives the sell zone.
In the algorithm description, we have: Build the distribution f(x) of the price during the lookback period i. The distribution here is empirical namely, how many times a given value of x appeared during the lookback period. The problem is to find such x that the probability of a price being greater or equal to x will be equal to a probability selected by the user. Probability is the area under the distribution curve. The task is to find such value of x that the area under the distribution curve to the right of x will be equal to the probability selected by the user. That x is the dynamic zone.
7 Types of RSI
See here to understand which RSI types are included:
Included:
Bar coloring
4 signal types
Alerts
Loxx's Expanded Source Types
Loxx's Variety RSI
Loxx's Dynamic Zones


Relative Strength Index modifierJ'ai rajouter quelque ligne pour les ventes et achat pour notre stratégie


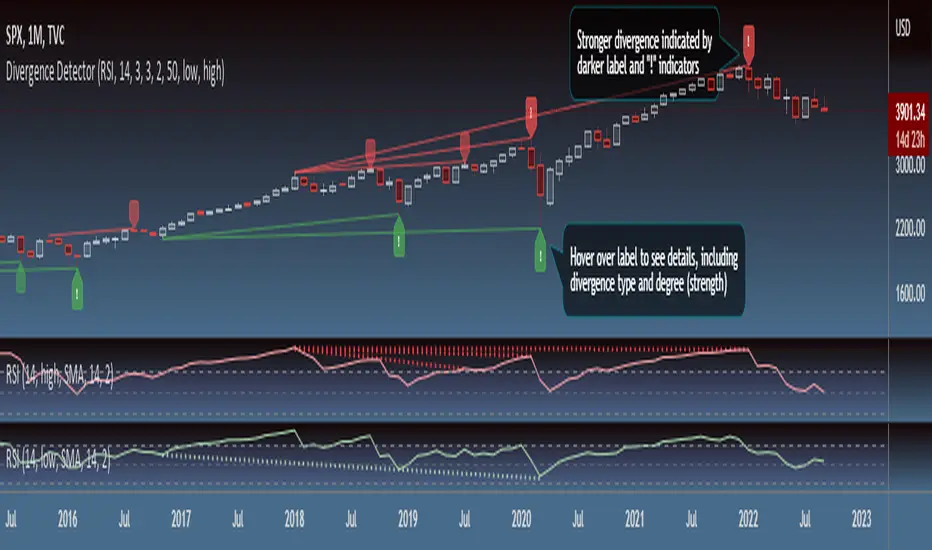
Divergence DetectorOverview:
- Identifies divergence on the specified indicator. Support for additional indicators in development.
- Divergence labels indicate strength of divergence, making it easy to spot stronger divergence.
- Fully customizable (including inputs for indicator type and length, pivot lengths, divergence type, lookback range, price source, and more), allowing you to see exactly what you want based on your chart type and timeframe.
Inputs:
See tooltips on Inputs page in settings.
Please report any issues/bugs, enhancement suggestions, or requests for additional indicator support.
Relative Strength Index ColoredThis is a slight nuanced version of the RSI that adds color to the RSI MA based on the slope. This makes it easier to see a potential direction.
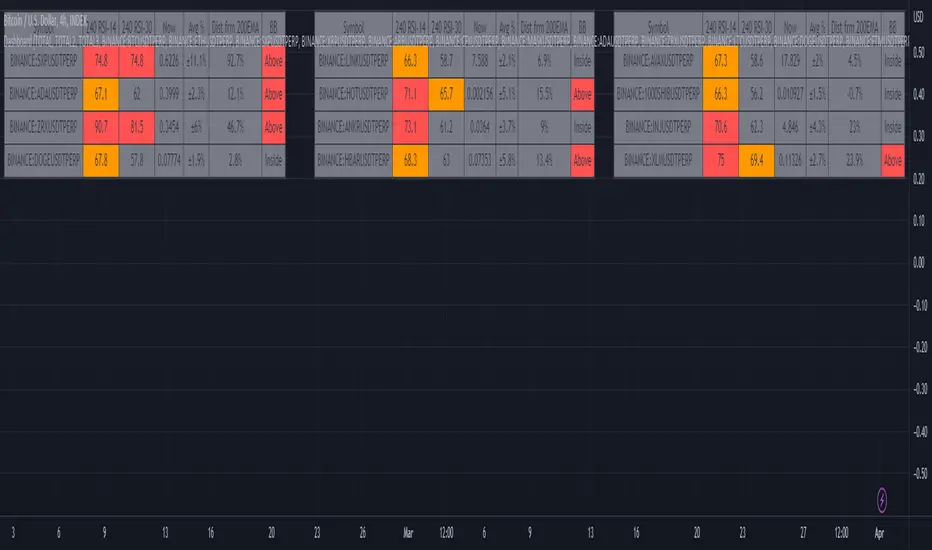
[ChasinAlts] RSI (Time-Spent) Count[MO]// Hello fellow traduers, hope all is well in your neck of the woods. Anywho, I'll attempt to be short and sweet.
// I've been doing a LOT of work recently with RSI to figure out what its all about and to learn the ins and outs.
// Some great ideas (I think at least) have come to fruition from the deep-dive into RSI, thus, I've got 2 of these ideas
// to share. One notable feature for the RSI is when there is a BULLISH trend, it is VERY likely to stay within the upper
// 2/3rds of the RSI extremes (0-100) and vise-versa for BEARISH trends and the lower 2/3rds of the RSI extremes.
// That is where this script's idea was derived. Now PLEASE, do tell, if you disagree with me (preferably via a cool,
// calm, and collected comment...but hey, that's up to you). Ok, now the script.
//
// What this does is gives you a Bullish and Bearish count for the bars. Bullish Cnt counts up by +1 per every PRINTED bar
// that is above OverSold and vise-versa for the Bearish Cnt and being below OverBought. That does VERY MUCH make it
// possible for both counts to have a high value if RSI is staying between OverBought and OverSold for extended periods
// of time. Though, the ONLY count that will be shown is the one with the highest value.
//
// There are tooltips describing each of the settings but I will quickly talk about 3 more things. First of all, I prefer
// to have as few settings in the settings menu as possible thus the "Boundaries to OB/OS" setting can be viewed as the
// OverSold input and the OverBought setting is configured from this by subtracting "Boundaries to OB/OS" from 100
// (ie. 100-Oversold = OverBought). There Lastly, there is the option to show ONLY the coin with the MAX Count from each
// 'set' of coins. When that count resets to 0 then the next highest count coin will take its place. To use this instead
// of how the script is currently constructed you only need to comment out (add '//' at the beginning of each line of) the current
// plot functions and uncomment the lines at the very bottom under the 'MAX' section. Doing so also reveals the possibility of
// setting an alert for when the coin with the max count changes between different coins. This is very helpful because since it
// only gives the top count of ALL the coins in the selected set, this count is most likely going to continue forward with its
// count for a while thus when the alert goes off I prefer to look at the potential trades in the opposite direction of which
// the max coin was just in (ie. if its count plot/label is red and it stops then look for a potential long trade on the coin
// who's count just reset. Only ONE more piece of the script I have yet to talk about. There is a filter in the code and you
// can select to use or not use within the settings. What this filter does is it counts all the printed bars within the last
// ___bars(user selectable). This is due to the fact that if there is no trade that occurs on a bar then TradingView does not
// print the bar. The coins that have fewer updates also tend to stay within a tighter range for it's RSI thus many times
// giving the illusion that the coin is a good trade bc its trending count is very high (tending to be higher than the others)
// thus hogging the precious chart space if using the script in its current form, or hogging up the MAX slot so that no other
// (and most likely BETTER-TO-TRADE) coins will be shown. It is a great volatility indicator (that of which I have published
// a script using the idea in the recent past). If selected in the settings menu and if the % of printed bars count goes below
// the user set minimum % then both Bullish and Bearish counts will be reset. This is indicated within the counts plots by looking
// at the plots whose counts reset and rather than the plots just stopping printing in mid-air, they will continue to plot while the
// counts reset and fall down to 0. These types of coins will keep you in a trade longer that you'd probably want gaining less than
// you'd probably expect.
//
// Peace Folks & Happy Trading,
//
// ChasinAlts

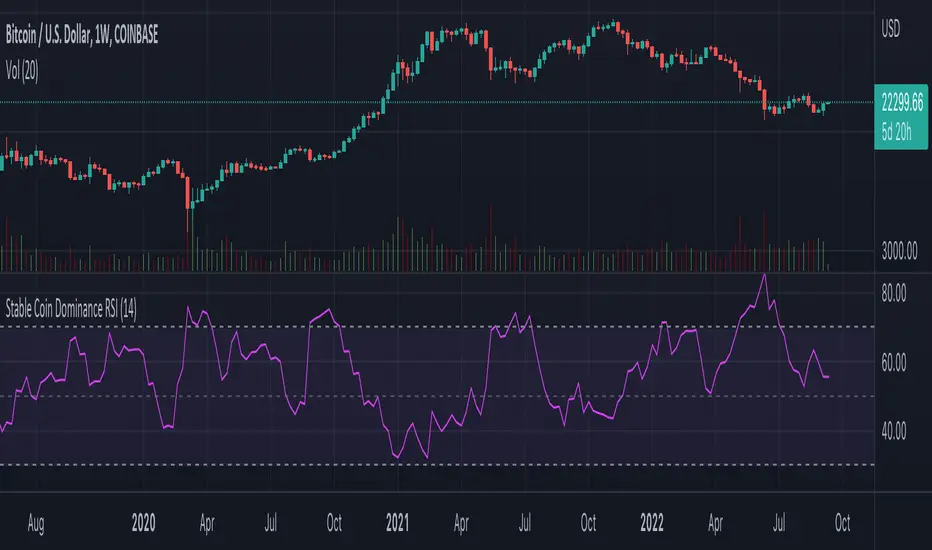
Stable Coin Dominance RSIThe Stable Coin Dominance RSI evaluates the relative dominance of stable coins within the crypto ecosystem as compared to the total market cap. As stable coin dominance rises, it suggests that market participants are exiting out of crypto assets and into dollar pegged stable coins. The opposite is true inversely; as stable coin dominance diminishes, it suggests that market participants are divesting out of stable coins and into crypto assets.
Stable coin dominance can be expressed as a percentage of the total market cap as follows: Stable Coins / Total Crypto. The Stable Coin Dominance RSI indicator uses this percentage and converts it into an oscillator using the formula for the relative strength index.
The calculation for the indicator is: RSI
The users can select from USDT and USDC, two most dominant stable tokens by market cap, and compare their relative dominance against Bitcoin and the alt market.
The Stable Coin Dominance RSI may be useful on larger timeframes when attempting to identify the market’s appetite for risk along with oversold and undersold readings which may indicate pivots or turn arounds along market extremes.
The limitation of the indicator lies in the fact that stable coins continue to make up a growing percentage of the total market cap over time and thus comparisons to earlier cycles will not be a perfect apples-to-apples evaluation. This being said, the smoothing function of the RSI’s look back helps to moderate these comparative differences.
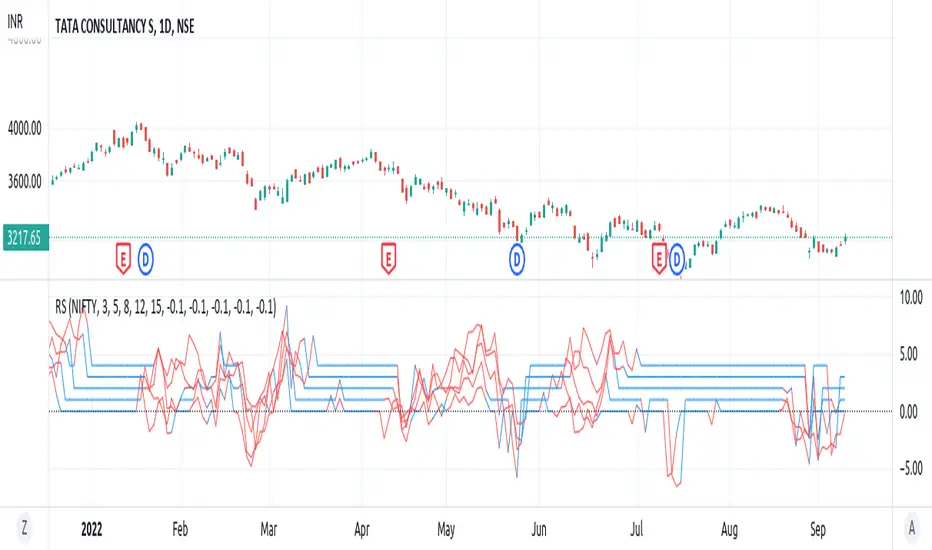
Relative Index StrengthThis script shows relative strength of custom stock compared to Index. It is helpful in detecting how strongly a stock is performing when compared to an Index.
When the index is falling but the custom stock is rising, indicator shows this in red with its relative strength compared to index, indicating the stock is moving strongly against market trend.
When the index and the custom stock are moving in same direction, indicator remains neutral, indicating the stock is aligned with the market trend.
Relative Strength Index 2 buy a sellThis is my tool, I wanted to publish it so that my friend can easily find my tool
RSI + MA, LinReg, ZZ (HH HL LH LL), Div, Ichi, MACD and TSI HistRelative Strength Index with Moving Average, Linear Regression, Zig Zag (Highs and Lows), Divergence, Ichimoku Cloud, Moving Average Convergence Divergence and True Strength Index Histogram
This script is based on zdmre's RSI script, I revamped a lot of things and added a few indicators from ParkF's RSI script.
Disable Labels in the Style tab and the histogram if you don't enlarge the indicator and it seems too small.
Look to buy in the oversold area and bounce of the support of the linear regression.
Look to sell in the overbought area and bounce of the resistance of the linear regression.
Look for retracement to the moving average or horizontal lines, and divergences for potential reversal.
RSI
The Relative Strength Index (RSI) is a well versed momentum based oscillator which is used to measure the speed (velocity) as well as the change (magnitude) of directional price movements.
Moving Average
Moving Average (MA) is a good way to gauge momentum as well as to confirm trends, and define areas of support and resistance.
Linear Regression
The Linear Regression indicator visualizes the general price trend of a specific part of the chart based on the Linear Regression calculation.
Zig Zag (Highs and Lows)
The Zig Zag indicator is used to identify price trends, and in doing so plots points on the chart to mark whenever prices reverse by a larger percentage point than a predetermined variable or marker.
Divergence
The divergence indicator warns traders and technical analysts of changes in a price trend, oftentimes that it is weakening or changing direction.
Ichimoku Cloud
The Ichimoku Cloud is a package of multiple technical indicators that signal support, resistance, market trend, and market momentum.
MACD and TSI Histogram
MACD can be used to identify aspects of a security's overall trend.
The True Strength Index indicator is a momentum oscillator designed to detect, confirm or visualize the strength of a trend.

SUPER RSI [Gabbo]RSI revolutionizes the classic RSI by allowing you to modify its behavior based on different chart types and dynamic multi-source calculations.
It’s designed for traders who want greater precision and adaptability in momentum analysis across various market conditions.
Whether you want to apply the RSI on alternative candles like Heikin Ashi, Renko, or even combine multiple data sources, this tool provides maximum flexibility.
🔷 Key Features
🟩Customizable Chart Inputs
Apply RSI calculations not only on traditional candles but also on alternative bar types like Heikin Ashi, Kagi, Line Break, Point & Figure, and Renko for a deeper understanding of trend strength.
🟩Multi-Source Aggregation
Blend multiple sources together to create a more stable and refined RSI signal. Combine 2, 3, 4, or even 5 different sources into a single input.
🟩Dynamic RSI and Bands
Unlock advanced options to dynamically adjust the RSI itself and its surrounding bands based on real-time price action.
🔷 Technical Details and Customizable Inputs
1️⃣ Bar Type Selection:
Choose the type of chart structure used for RSI calculation:
Candles (classic)
Heikin Ashi
Kagi
Line Break
Point & Figure
Renko
2️⃣ Use Different Source???
Activate multi-source RSI by combining multiple elements:
2 sources : (Source 1 + Source 2) ÷ 2
3 sources : (Source 1 + Source 2 + Source 3) ÷ 3
4 sources : (Source 1 + Source 2 + Source 3 + Source 4) ÷ 4
5 sources : (Source 1 + Source 2 + Source 3 + Source 4 + Source 5) ÷ 5
3️⃣ Use Dynamic RSI???
Enable a dynamic RSI calculation that adjusts in real-time to market behavior for greater responsiveness.
4️⃣ Use Dynamic Band???
Enable dynamic bands that adapt to price action rather than relying on fixed static thresholds.
🔍 How to Use Dynamic RSI Source Pro
📈 Choose Your Candle Type
Select the bar format that best matches your strategy needs—classic candles, Heikin Ashi, Renko, and more.
🧩 Customize Your Data Source
Activate multi-source input to create smoother, more reliable RSI signals.
⚡ Unlock Dynamic Adaptation
Enable dynamic RSI and bands to adjust automatically to live price movements and enhance signal accuracy.
☄️ With Dynamic RSI Source Pro, you can elevate your RSI analysis by applying it dynamically across multiple candle types and sources, giving you a new level of control and precision.

Koncorde PlusKONCORDE IS ONLY INTENDED TO BE APPLIED TO ASSETS WHERE VOLUME DATA IS PROVIDED.
This indicator is made up of 6 indicators: 4 trend (RSI, MFI, BB, Stochastic) and 2 volume. The 2's for volume are the PVI (positive volume index) and the NVI (negative volume index). These two indicators are the interesting ones as they are programmed to proportionally attribute the volume traded between the strong hands (sharks) and the weak hands (minnows).
As for what time period to use, the bigger the better, since after all what we are doing is data analysis and therefore the more data, the better.
When strong hands (blue histogram) are below zero, they are said to be selling while when they are above zero, they are said to be buying. The same goes for weak hands (green histogram).
Meaning of each zone:
Blue histogram: strong hand (sharks). If it is positive it indicates accumulation and if it is negative distribution.
Green histogram: weak hand (minnows). If it is positive it indicates buy and if it is negative it indicates sale.
Brown histogram: Indicates the trend and depends on previous values of weak hands and trend indicators (RSI, MFI, BB, Stochastic).
Red line: It is an average that smoothes the trend indicated by the brown histogram (default is the EMA).
Crossing Pattern
The pattern gives us a bullish entry signal when the trend (brown histogram) crosses above the average (red line) and is positioned bearish when the trend crosses below the average.
Zero Pattern
When the price trend (brown histogram) tends to zero, it means that there will be a change in its trend. This pattern is for trading in a bullish position.
Spring Pattern
When a cross between the average (red line) and the trend (brown histogram) has already occurred, and in addition the weak hands are above the price trend, that "spring on the mountain" is formed that gives us to understand that the upward trend will be more than evident.
Mirror Pattern
This pattern occurs when there is panic in the market and weak hands are selling (below zero). If at that moment the strong hands are buyers, the price tends to level off to begin the rise later.
This pattern is compatible with the Crossover Pattern, having more guarantees of success. If just after finishing the mirror pattern, the Crossover Pattern plus the Spring Pattern appears, then we have a good chance of winning.
Bear Hug Pattern
This pattern is for bearish positions only. It is the opposite figure to the mirror pattern. That is, we have strong hands clearly selling and weak hands clearly buying and above the price trend (brown histogram). It is the figure where you can see that the strong hands are distributing the assets to the weak hands.
Harpoon Pattern
If when the mirror pattern occurs, the red line crosses the blue histogram, a very strong bullish entry signal is produced.
Add an exit signal which occurs when we are in a spring pattern but the big hands start selling, mostly coinciding with the start of the bear hug pattern.
General rules for operating the Mirror Pattern:
a) Wait for the green histogram to start recovery, rise to positive values; if possible, until it crosses from bottom to top the brown line (brown histogram) and/or red average .
b) The blue histogram should be consistently positive. If it turns and goes towards negative values it can indicate a failed pattern at that same point.
c) Locate the low of the lower candle within the pattern and place the Stop Loss just below it for reference.
d) If we are not sure (we almost never will be) that there will be a turn or if it could finally be a bearish continuation we can use the SL to go short .
Additional:
A panel with performance statistics of the analyzed asset was added.
Added an indicator that shows the cumulative delta volume in the form of triangles at the top of the chart.
Added of user @DonovanWall
PS: Unofficial version, I was guided by the description of the BLAI5 author's website www.blai5.net
DISCLAIMER: For educational and entertainment purposes only. Nothing in this content should be interpreted as financial advice or a recommendation to buy or sell any sort of security or investment including all types of cryptos. DYOR, TYOB.

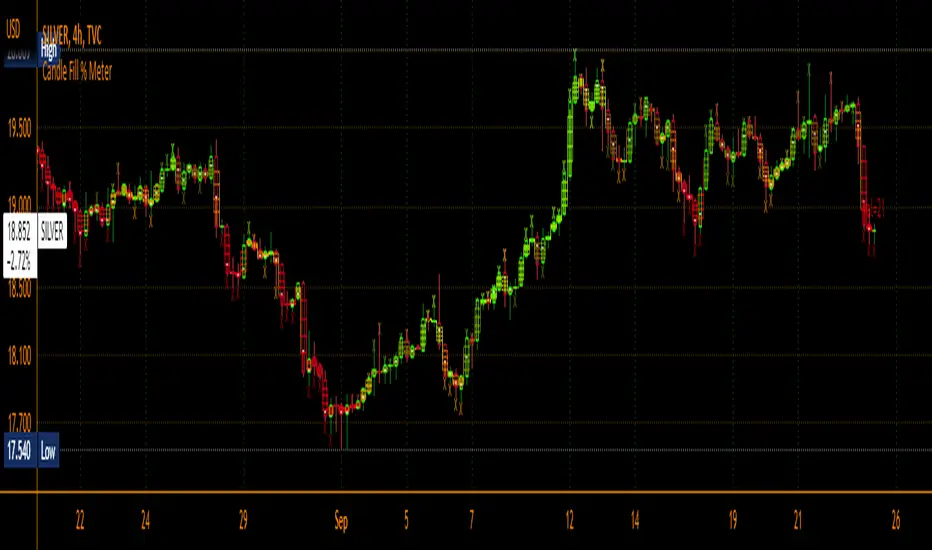
Candle Fill % MeterFor use with Hollow Candles
Fills Candles based on either the value of the RSI or coppock scaled to fit properly between the open and close. Makes for a compact visual with lot's of information given. Toggle bells and whistles in settings such as arrows to indicate the direction of the value being measured, dividing levels, fill from candle open all the time instead of the bottom up and more.
Tutporial Pedia (Signal buy & Sell)Untuk mempermudah kita dalam bermain dan memahami Signal Trade View Rate 98 %
RSI+ by Wilson (alt)Extension of the excellent RSI+ script by Wilsonlibero. I tweaked the parameters to better fit crypto markets, and I added a few more visuals, such as midline, overbought/oversold threshold lines and areas, background coloration depending on RSI trend above or below midline, and a few other tweaks especially colors (fixed the transp parameter deprecation for example). The color theme is by default more optimized for dark mode charts, but all colors can be configured, and all drawings can be enabled/disabled/tweaked in the parameters.
I'm just giving back to the community since I could modify this script only because it was open-source. If you like this script, please don't give me any credit, but please show some love to the original author Wilsonlibero:
