Smart Money Renko Matrix [MarkitTick]💡 The Smart Money Renko Matrix is a comprehensive, multi-dimensional analytical tool designed to bridge the gap between noise-free price action and complex market microstructure. By stripping away time-based market noise using an Average True Range (ATR) based price framework, this script isolates pure directional movement and volume distribution. It synthesizes Multiple Time Frame (MTF) trend convergence, order flow dynamics, and quantitative statistical exhaustion models into a single, cohesive interface. This indicator constructs a dynamic environment where traders can objectively measure trend strength, identify structural shifts, and manage risk systematically.
✨ Originality and Utility
Traditional indicators often rely on time-based charts, which can introduce significant noise during periods of high volatility or sideways consolidation. This script departs from the norm by utilizing a volatility-adjusted mathematical matrix to construct its baseline. What makes this tool exceptionally useful is its ability to merge quantitative statistical models—such as Z-Score based trend exhaustion and rolling Volume Profile Point of Control (POC)—with modern structural market concepts. Instead of viewing trend, volume, and structure as isolated elements, this script computes a unified algorithmic score, presenting actionable setups without the clutter of traditional multi-indicator chart layouts.
🔬 Methodology and Concepts
● Volatility-Adjusted Baseline
The core of the script calculates synthetic open, close, and volume values using an underlying ATR resolution. This ensures that a new computational block is only formed when price moves beyond a dynamically adjusting volatility threshold, completely disregarding the passage of time.
● Multiple Time Frame (MTF) Convergence
The script evaluates trend momentum across three independent higher timeframes (e.g., 1H, 4H, Daily) by measuring price relative to a 50-period Exponential Moving Average (EMA). It assigns a logical integer score. A trend is only considered fully converged (Bullish or Bearish) if it achieves a score of 2 or higher across the matrix, filtering out lower-timeframe false breaks.
● Quantitative Z-Score Trend Exhaustion
To identify overextended movements, the script maintains a dynamic array of historical directional streaks. It calculates the rolling mean and standard deviation of these streaks. When a current directional run exceeds a Z-Score of 2.0 (meaning it is two standard deviations beyond the historical average), the trend is mathematically flagged as exhausted, warning of a high-probability mean reversion event.
● Rolling Volume Profile and Point of Control (POC)
A continuous volume profile is constructed by indexing the traded volume at specific price levels over a rolling 100-block window. The algorithmic engine identifies the price node with the maximum aggregated volume, establishing the dynamic Point of Control (POC), which serves as a highly reactive structural support or resistance level.
● Structural Sweeps and Order Blocks
The logic continuously scans for structural liquidity sweeps. A sweep occurs when price pierces a predefined historical high or low (based on user lookback) but fails to close beyond it, indicating trapped volume. Following a confirmed sweep and a change in directional momentum, the system algorithmically generates boundary boxes that represent significant structural order blocks.
🎨 Visual Guide
● Heatmap Candles
Bullish Streaks: Represented by a color gradient starting from Dark Green and transitioning to Bright Green as the directional streak matures.
Bearish Streaks: Represented by a color gradient starting from Dark Red and transitioning to Bright Orange.
Exhaustion State: If the Z-Score exhaustion threshold is breached, the candles become highly transparent or gray, visually warning of a fading trend.
● Core Matrix Lines
Renko Upper/Lower Bounds: Solid lines plotting the mathematical extremes of the current volatility block.
Renko Midline: A dotted line tracking the exact median of the active block structure.
Reversal Close: Prominent circular markers highlighting the exact pivot point where the directional streak changes state.
● Risk Management Visuals
Trailing Stop: A dashed line appearing below bullish price action or above bearish price action, dictating the dynamic trailing invalidation level.
Entry and Target Lines: When a setup triggers, a distinct set of dashed lines appear: Gold for the Entry price, Pink for the Stop Loss (SL), Cyan for Take Profit 1 (TP1), Blue for Take Profit 2 (TP2), and Orange for Take Profit 3 (TP3). Small textual labels accompany each line displaying the exact price.
● Order Flow and Structural Shapes
Sweep Labels: Small text labels reading "Liq" appear above or below the wicks when a structural sweep is confirmed.
Wick Rejections: Displayed as small cross shapes (`xcross`). Pink crosses above price denote clustered bearish rejections; Cyan crosses below denote clustered bullish rejections.
Volume Divergence: Small circular shapes appear above or below the bar when a directional push occurs without the support of a moving average volume breakout, signaling potential weakness.
● Heads-Up Dashboard
A specialized table located in the top right corner. It displays the current ticker, active timeframe, the MTF Convergence Tier score (color-coded green or orange), the dynamic block size in absolute price terms, the current Volume Profile POC level, and the calculated numerical values for the active Entry, SL, and TP targets.
📖 How to Use
● Identifying Trend Direction
Observe the primary color gradient of the main chart layout. Trade strictly in the direction of the bright, saturated colors. Ensure that the dashboard confirms the trend with a "Tier 2" or "Tier 3" MTF Convergence score before looking for entries.
● Spotting Reversals
Wait for the emergence of a Liquidity Sweep label ("Liq"). Once this prints, monitor the chart for a color transition (e.g., green shifting to red). A reversal is further validated if a structural Order Block box is painted immediately following the sweep, or if exhaustion logic visually grays out the prior trend.
● Executing and Managing Risk
When a directional change occurs that aligns with the higher timeframe score, utilize the auto-generated dashed risk lines. Place your entry at the Gold dashed line. Set your structural invalidation at the Pink dashed line. As price progresses, manually scale out of the position by targeting the Cyan, Blue, and Orange dashed lines. Utilize the dynamic trailing stop line to protect open profits as the trend matures.
⚙️ Inputs and Settings
• Volatility Settings
Adjust the base lookback period for the Average True Range calculation. Increasing the multiplier directly increases the price distance required to generate a new block, effectively filtering out more noise but delaying signal generation.
• Visual Gradients
Users can customize the starting and ending colors for both bullish and bearish streaks, as well as define the specific streak depth required to reach maximum color saturation.
• Risk Management Configurations
Allows traders to toggle between dynamic standard risk or structure-based stop losses. Users can input specific multiplier values to independently adjust the distance of the Stop Loss and all three Take Profit levels.
• MTF Tier Scoring
Select the three specific higher timeframes the algorithmic engine will use to calculate the baseline trend momentum. By default, these are structured as Intraday, Medium, and Macro.
• Structural Lookbacks
Define the historical bar count used to identify major swing points. A higher lookback period will result in fewer, but mathematically more significant, sweep identifications and order block generation.
🔍 Deconstruction of the Underlying Scientific and Academic Framework
● Absolute Mean Deviation and ATR Computation
The foundational framework of this matrix relies on the Average True Range, a volatility metric introduced by J. Welles Wilder. The script calculates the greatest of the current high minus the current low, the absolute value of the current high minus the previous close, and the absolute value of the current low minus the previous close. By applying a smoothing function to this true range over a defined period, the script normalizes the non-stationary nature of financial time series into a standardized unit of volatility.
● Standard Score (Z-Score) Application on Serial Dependence
To model trend exhaustion quantitatively, the script measures the serial dependence of consecutive directional outcomes (streaks). By storing the historical lengths of these streaks in a dynamically updating array, the engine computes the population mean (μ) and standard deviation (σ). The current streak length (x) is evaluated using the standard Z-Score formula: z = (x - μ) / σ. A result greater than 2.0 indicates that the current movement lies beyond the 95th percentile of the normal distribution curve, mathematically classifying the trend as statistically anomalous and prone to immediate mean reversion.
● Volume Distribution Theory
The Point of Control (POC) logic is rooted in volume distribution profiling. It assumes that market participants execute trades at equilibrium prices. By segmenting the Y-axis into distinct price nodes and accumulating the corresponding traded volume over a rolling lookback window, the script identifies the mode of the distribution curve. This maximum volume node represents the price level with the highest historical consensus of value, naturally acting as a dense algorithmic barrier for future price action.
⚠️ Disclaimer
All provided scripts and indicators are strictly for educational exploration and must not be interpreted as financial advice or a recommendation to execute trades. We expressly disclaim all liability for any financial losses or damages that may result, directly or indirectly, from the reliance on or application of these tools. Market participation carries inherent risk where past performance never guarantees future returns, leaving all investment decisions and due diligence solely at your own discretion. インジケーター

Renko Heatmap Pro [MarkitTick]💡 Multi-faceted trend analysis and price action visualization system engineered to filter out time-based market noise and strictly highlight price momentum. By computing synthetic Renko bricks directly on your traditional time-based chart, this tool overlays a completely volatility-adjusted perspective of the market. It seamlessly integrates a streak-based momentum heatmap, dynamic support and resistance tracking, and a comprehensive risk-management dashboard into a single, cohesive interface. This allows analysts to visualize trend maturity, identify precise structural shifts, and monitor key risk metrics without relying on lagging, time-dependent oscillators.
✨ Originality and Utility
Standard charting relies on fixed time intervals, which often introduces "noise"—price fluctuations that occur simply because time is passing, not because structural momentum is shifting. The utility of this indicator lies in its ability to reconstruct the market using Average True Range (ATR) based Renko methodology natively over standard candlesticks.
What sets this script apart is its Streak Engine and Gradient Color framework. Instead of merely showing bullish or bearish states, the indicator quantifies trend depth. It tracks consecutive directional blocks and dynamically adjusts the visual weighting (heatmap) based on the longevity of the trend. This is further hybridized with an automated risk-management engine that calculates dynamic Stop Loss (SL) and Take Profit (TP) levels, alongside trailing stops and historical support/resistance levels that visually "fade" as they age. This creates an all-in-one suite for trend-following and structural analysis.
🔬 Methodology and Concepts
● Renko Ticker Construction
The script bypasses standard open, high, low, close (OHLC) bar data for its core signals, instead utilizing a secondary data request to construct ATR-based Renko blocks. A Renko brick is only formed when price moves a specified distance, completely disregarding the time it takes to make that move. In this system, the brick size is defined by the ATR, ensuring the threshold adapts to current market volatility.
● The Streak Engine
Every time a new Renko brick is formed in the same direction as the previous one, the internal streak counter increases. If a bullish brick follows a bullish brick, the count iterates upward. If a bearish brick prints, the bullish streak breaks, resetting the count and initiating a bearish streak. This creates a quantitative measure of trend duration and exhaustion.
● Dynamic Risk Management Engine
Using the confirmed close of the previous Renko block, the system calculates algorithmic risk parameters. Stop Loss and Take Profit levels are calculated as distinct ATR multiples extending outward from the confirmed entry price. A trailing stop is also maintained, dynamically tightening behind the trend (higher in a bull trend, lower in a bear trend) and only resetting when the Renko structure reverses.
● Historical S/R Decay Logic
When a reversal occurs, the open price of that reversal block is recorded as a structural pivot. The indicator logs this price point and tracks its age (in bars). As time progresses, the visual representation of this level fades out, acknowledging the market theory that older, untested levels gradually lose their structural relevance compared to fresh pivots.
🎨 Visual Guide
● Heatmap Candles
Trend Maturation (Gradients): The candlestick bodies are overridden with a heatmap gradient. A new bullish trend starts with a deep blue color and transitions toward a bright cyan as the streak extends. A bearish trend starts deep red and transitions to a bright orange/yellow as it matures.
Stagnation: If a bar does not generate a new Renko block, it is colored a muted gray, signaling a period of consolidation where the volatility threshold hasn't been met.
● Structural Plot Lines
OC Core Zone: A semi-transparent filled channel on the chart representing the upper and lower boundaries of the current active Renko block.
Renko Midline: A dotted line tracking the exact mathematical center of the active block.
Reversal Close Circles: Prominent circular plots that appear exclusively when a structural trend reversal is confirmed, marking a potential entry or exit node.
Trailing Stop: A dashed line trailing behind the current price action, colored dynamically based on the active trend (cyan for bullish support, orange for bearish resistance).
Support/Resistance (S/R) Lines: Dotted horizontal lines extending from past reversal points. Their opacity visually fades the longer they remain on the chart.
● On-Chart Shapes and Labels
Signal Triangles: Distinct ▲ BUY (below bar) and ▼ SELL (above bar) shapes accompanied by text, printed precisely when the Renko direction shifts.
Box Count Label: A small, dynamic text label appearing at reversals to indicate exactly how many consecutive boxes the previous structural leg lasted.
● The Dashboard Panel
Located in the top right corner, this heads-up display provides real-time quantitative metrics:
Trend Bias: Text readout of the current structural direction (Bull/Bear).
Streak Depth: A 10-block visual bar (e.g., ████░░░░░░) showing how far along the current trend is relative to the user-defined maximum gradient depth.
R:R Quality: A visual score rating the current Reward-to-Risk ratio based on the dynamic SL/TP levels.
Actionable Prices: Exact price readouts for Entry, Stop Loss, Take Profit, and the Trailing Stop.
📌 Important note : the best way to resolve visual overlap is to navigate to the Object Tree and drag the indicator above the main chart layer, or simply hide the native candles in your chart settings.
📖 How to Use
● Trend Identification and Exhaustion
Traders can monitor the Heatmap Candles to gauge both direction and maturity. When the candles transition from their starting colors (dark blue / deep red) to their terminal colors (bright cyan / bright orange), it indicates that the trend streak is becoming highly extended. An extended streak does not automatically imply a reversal, but it suggests momentum has been sustained for an extended period, which may precede a consolidation or pullback.
● Entry and Execution
A primary use case is waiting for a confirmed trend shift. When a reversal is validated, the indicator plots the Reversal Close Circle and the ▲ BUY / ▼ SELL shape. Traders can use the Dashboard Panel to immediately read the calculated Entry, SL, and TP prices.
● Managing Risk In-Trade
Once a position is active, the Trailing Stop dashed line provides a dynamic, structural level to trail a stop-loss. Additionally, traders can monitor price action as it approaches the historical dotted S/R lines. If price approaches a sharply colored (recent) S/R line, higher friction is expected. If it approaches a heavily faded (old) line, the level may carry less structural weight.
Note on Data Resolution: Because this tool queries secondary Renko data using the current chart's resolution and employs lookahead functionality on historical data, real-time current-bar fluctuations may briefly cross thresholds before closing. Decisions should strictly be made on confirmed bar closes, as indicated by the script's internal logic.
⚙️ Inputs and Settings
● ◈ Renko
ATR Length: The lookback period used to calculate the Average True Range, determining the size of the underlying Renko bricks.
ATR Resolution ×: A multiplier to scale the resolution up for higher-timeframe smoothing.
● ◈ Visuals
Bull/Bear Colors (Start & End): Customization for the heatmap gradients. You can define the exact color of a fresh trend and an exhausted trend.
Gradient Streak Depth: The number of consecutive bricks required to reach the "End" color. A higher number stretches the gradient over a longer trend.
● ◈ Risk Management
Dynamic SL/TP in Alerts: Toggles whether the SL and TP values are dynamically injected into the outgoing Webhook alert JSON.
SL / TP ATR Multiplier: Defines the distance (in ATR units) from the entry point to calculate the Stop Loss and Take Profit levels.
Show Trailing Stop Line: Toggles the visibility of the dynamic trailing stop boundary.
● ◈ Structure Analysis
Show S/R Levels & Max Levels: Toggles the historical reversal lines and sets a hard limit on how many previous levels are maintained on the chart to prevent clutter.
S/R Fade Age (bars): Determines how quickly the S/R lines lose their opacity as time passes.
● ◈ Webhook Actions
Configurable string inputs to match your specific execution bot commands (e.g., "long", "short", "closelong"). These are embedded into the JSON payload triggered by the indicator's alerts.
🔍 Deconstruction of the Underlying Scientific and Academic Framework
● Market Noise and the Random Walk
In quantitative finance, high-frequency price data is often modeled with components of a Brownian motion or a Random Walk, where short-term movements contain significant "noise" (stochastic variation) independent of the underlying drift (trend). Standard time-based sampling captures all of this variance. By utilizing a Renko construction, this indicator applies a discrete filtration mechanism. It mathematically suppresses localized stochastic volatility by requiring price to traverse a minimum Euclidean distance (the ATR block size) before registering a state change.
● Volatility Clustering and Adaptive Thresholds
Mandelbrot and subsequent econometricians noted that market volatility clusters—periods of high variance are followed by high variance. Using a static brick size in Renko fails to account for leptokurtic market distributions. By anchoring the block size to the Average True Range, the indicator's filtration threshold becomes adaptive. During periods of volatility expansion, the required threshold widens, preventing the streak engine from being whipsawed by natural variance expansion.
● Momentum Decay and Mean Reversion Probability
The Gradient Streak Depth concept relies on the statistical premise of mean reversion following extended standard deviations from a mean. While trends can persist, the probability of a structural pullback increases as the streak count grows. The heatmap visually represents this probability density—translating a quantitative sequential count into a qualitative visual exhaustion metric, aiding in the assessment of asymmetric risk distribution.
⚠️ Disclaimer
All provided scripts and indicators are strictly for educational exploration and must not be interpreted as financial advice or a recommendation to execute trades. I expressly disclaim all liability for any financial losses or damages that may result, directly or indirectly, from the reliance on or application of these tools. Market participation carries inherent risk where past performance never guarantees future returns, leaving all investment decisions and due diligence solely at your own discretion. インジケーター

Universal Renko Bars by SiddWolfUniversal Renko Bars or UniRenko Bars is an overlay indicator that applies the logic of Renko charting directly onto a standard candlestick chart. It generates a sequence of price-driven bricks, where each new brick is formed only when the price moves a specific amount, regardless of time. This provides a clean, price-action-focused visualization of the market's trend.
WHAT IS UNIVERSAL RENKO BARS?
For years, traders have faced a stark choice: the clean, noise-free world of Renko charts, or the rich, time-based context of Candlesticks. Choosing Renko meant giving up your favorite moving averages, volume profiles, and the fundamental sense of time. Choosing Candlesticks meant enduring the market noise that often clouds true price action.
But what if you didn't have to choose?
Universal Renko Bars is a revolutionary indicator that ends this dilemma. It's not just another charting tool; it's a powerful synthesis that overlays the pure, price-driven logic of Renko bricks directly onto your standard candlestick chart. This hybrid approach gives you the best of both worlds:
❖ The Clarity of Renko: By filtering out the insignificant noise of time, Universal Renko reveals the underlying trend with unparalleled clarity. Up trends are clean successions of green bricks; down trends are clear red bricks. No more guesswork.
❖ The Context of Candlesticks: Because the Renko logic is an overlay, you retain your time axis, your volume data, and full compatibility with every other time-based indicator in your arsenal (RSI, MACD, Moving Averages, etc.).
The true magic, however, lies in its live, Unconfirmed Renko brick. This semi-transparent box is your window into the current bar's real-time struggle. It grows, shrinks, and changes color with every tick, showing you exactly how close the price is to confirming the trend or forcing a reversal. It’s no longer a lagging indicator; it’s a live look at the current battle between buyers and sellers.
Universal Renko Bars unifies these two powerful charting methods, transforming your chart into a more intelligent, noise-free, and predictive analytical canvas.
HOW TO USE
To get the most out of Universal Renko Bars, here are a few tips and a full breakdown of the settings.
Initial Setup for the Best Experience
For the cleanest possible view, it's highly recommended that you hide the body of your standard candlesticks, that shows only the skelton of the candle. This allows the Renko bricks to become the primary focus of your chart.
→ Double click on the candles and uncheck the body checkbox.
Settings Breakdown
The indicator is designed to be powerful yet intuitive. The settings are grouped to make customization easy.
First, What is a "Tick"?
Before we dive in, it's important to understand the concept of a "Tick." In Universal Renko, a Tick is not the same as a market tick. It's a fundamental unit of price movement that you define. For example, if you set the Tick Size to $0.50, then a price move of $1.00 is equal to 2 Ticks. This is the core building block for all Renko bricks. Tick size here is dynamically determined by the settings provided in the indicator.
❖ Calculation Method (The "Tick Size" Engine)
This section determines the monetary value of a single "Tick."
`Calculation Method` : Choose your preferred engine for defining the Tick Size.
`ATR Based` (Default): The Tick Size becomes dynamic, based on market volatility (Average True Range). Bricks will get larger in volatile markets and smaller in quiet ones. Use the `ATR 14 Multiplier` to control the sensitivity.
`Percentage` : The Tick Size is a simple percentage of the current asset price, controlled by the `Percent Size (%)` input.
`Auto` : The "set it and forget it" mode. The script intelligently calculates a Tick Size based on the asset's price. Use the `Auto Sensitivity` slider to make these automatically calculated bricks thicker (value > 1.0) or thinner (value < 1.0).
❖ Parameters (The Core Renko Engine)
This group controls how the bricks are constructed based on the Tick Size.
`Tick Trend` : The number of "Ticks" the price must move in the same direction to print a new continuation brick. A smaller value means bricks form more easily.
`Tick Reversal` : The number of "Ticks" the price must move in the opposite direction to print a new reversal brick. This is typically set higher than `Tick Trend` (e.g., double) to filter out minor pullbacks and market noise.
`Open Offset` : Controls the visual overlap of the bricks. A value of `0` creates gapless bricks that start where the last one ended. A value of `2` (with a `Tick Reversal` of 4) creates the classic 50% overlap look.
❖ Visuals (Controlling What You See)
This is where you tailor the chart to your visual preference.
`Show Confirmed Renko` : Toggles the solid-colored, historical bricks. These are finalized and will never change. They represent the confirmed past trend.
`Show Unconfirmed Renko` : This is the most powerful visual feature. It toggles the live, semi-transparent box that represents the developing brick. It shows you exactly where the price is right now in relation to the levels needed to form the next brick.
`Show Max/Min Levels` : Toggles the horizontal "finish lines" on your chart. The green line is the price target for a bullish brick, and the red line is the target for a bearish brick. These are excellent for spotting breakouts.
`Show Info Label` : Toggles the on-chart label that provides key real-time stats:
🧱 Bricks: The total count of confirmed bricks.
⏳ Live: How many chart bars the current live brick has been forming. These bars forms the Renko bricks that aren't confirmed yet. Live = 0 means the latest renko brick is confirmed.
🌲 Tick Size: The current calculated value of a single Tick.
Hover over the label for a tooltip with live RSI(14), MFI(14), and CCI(20) data for additional confirmation.
TRADING STRATEGIES & IDEAS
Universal Renko Bars isn't just a visual tool; it's a foundation for building robust trading strategies.
Trend Confirmation: The primary use is to instantly identify the trend. A series of green bricks indicates a strong uptrend; a series of red bricks indicates a strong downtrend. Use this to filter out trades that go against the primary momentum.
Reversal Spotting: Pay close attention to the Unconfirmed Brick . When a strong trend is in place and the live brick starts to fight against it—changing color and growing larger—it can be an early warning that a reversal is imminent. Wait for the brick to be confirmed for a higher probability entry.
Breakout Trading: The `Max/Min Levels` are your dynamic breakout zones. A long entry can be considered when the price breaks and closes above the green Max Level, confirming a new bullish brick. A short entry can be taken when price breaks below the red Min Level.
Confluence & Indicator Synergy: This is where Universal Renko truly shines. Overlay a moving average (e.g., 20 EMA). Only take long trades when the green bricks are forming above the EMA. Combine it with RSI or MACD; a bearish reversal brick forming while the RSI shows bearish divergence is a very powerful signal.
A FINAL WORD
Universal Renko Bars was designed to solve a fundamental problem in technical analysis. It brings together the best elements of two powerful methodologies to give you a clearer, more actionable view of the market. By filtering noise while retaining context, it empowers you to make decisions with greater confidence.
Add Universal Renko Bars to your chart today and elevate your analysis. We welcome your feedback and suggestions for future updates!
Follow me to get notified when I publish New Indicator.
~ SiddWolf
インジケーター

Non-Repainting Renko Emulation Strategy [PineIndicators]Introduction: The Repainting Problem in Renko Strategies
Renko charts are widely used in technical analysis for their ability to filter out market noise and emphasize price trends. Unlike traditional candlestick charts, which are based on fixed time intervals, Renko charts construct bricks only when price moves by a predefined amount. This makes them useful for trend identification while reducing small fluctuations.
However, Renko-based trading strategies often fail in live trading due to a fundamental issue: repainting .
Why Do Renko Strategies Repaint?
Most trading platforms, including TradingView, generate Renko charts retrospectively based on historical price data. This leads to the following issues:
Renko bricks can change or disappear when new data arrives.
Backtesting results do not reflect real market conditions. Strategies may appear highly profitable in backtests because historical data is recalculated with hindsight.
Live trading produces different results than backtesting. Traders cannot know in advance whether a new Renko brick will form until price moves far enough.
Objective of the Renko Emulator
This script simulates Renko behavior on a standard time-based chart without repainting. Instead of using TradingView’s built-in Renko charting, which recalculates past bricks, this approach ensures that once a Renko brick is formed, it remains unchanged .
Key benefits:
No past bricks are recalculated or removed.
Trading strategies can execute reliably without false signals.
Renko-based logic can be applied on a time-based chart.
How the Renko Emulator Works
1. Parameter Configuration & Initialization
The script defines key user inputs and variables:
brickSize : Defines the Renko brick size in price points, adjustable by the user.
renkoPrice : Stores the closing price of the last completed Renko brick.
prevRenkoPrice : Stores the price level of the previous Renko brick.
brickDir : Tracks the direction of Renko bricks (1 = up, -1 = down).
newBrick : A boolean flag that indicates whether a new Renko brick has been formed.
brickStart : Stores the bar index at which the current Renko brick started.
2. Identifying Renko Brick Formation Without Repainting
To ensure that the strategy does not repaint, Renko calculations are performed only on confirmed bars.
The script calculates the difference between the current price and the last Renko brick level.
If the absolute price difference meets or exceeds the brick size, a new Renko brick is formed.
The new Renko price level is updated based on the number of bricks that would fit within the price movement.
The direction (brickDir) is updated , and a flag ( newBrick ) is set to indicate that a new brick has been formed.
3. Visualizing Renko Bricks on a Time-Based Chart
Since TradingView does not support live Renko charts without repainting, the script uses graphical elements to draw Renko-style bricks on a standard chart.
Each time a new Renko brick forms, a colored rectangle (box) is drawn:
Green boxes → Represent bullish Renko bricks.
Red boxes → Represent bearish Renko bricks.
This allows traders to see Renko-like formations on a time-based chart, while ensuring that past bricks do not change.
Trading Strategy Implementation
Since the Renko emulator provides a stable price structure, it is possible to apply a consistent trading strategy that would otherwise fail on a traditional Renko chart.
1. Entry Conditions
A long trade is entered when:
The previous Renko brick was bearish .
The new Renko brick confirms an upward trend .
There is no existing long position .
A short trade is entered when:
The previous Renko brick was bullish .
The new Renko brick confirms a downward trend .
There is no existing short position .
2. Exit Conditions
Trades are closed when a trend reversal is detected:
Long trades are closed when a new bearish brick forms.
Short trades are closed when a new bullish brick forms.
Key Characteristics of This Approach
1. No Historical Recalculation
Once a Renko brick forms, it remains fixed and does not change.
Past price action does not shift based on future data.
2. Trading Strategies Operate Consistently
Since the Renko structure is stable, strategies can execute without unexpected changes in signals.
Live trading results align more closely with backtesting performance.
3. Allows Renko Analysis Without Switching Chart Types
Traders can apply Renko logic without leaving a standard time-based chart.
This enables integration with indicators that normally cannot be used on traditional Renko charts.
Considerations When Using This Strategy
Trade execution may be delayed compared to standard Renko charts. Since new bricks are only confirmed on closed bars, entries may occur slightly later.
Brick size selection is important. A smaller brickSize results in more frequent trades, while a larger brickSize reduces signals.
Conclusion
This Renko Emulation Strategy provides a method for using Renko-based trading strategies on a time-based chart without repainting. By ensuring that bricks do not change once formed, it allows traders to use stable Renko logic while avoiding the issues associated with traditional Renko charts.
This approach enables accurate backtesting and reliable live execution, making it suitable for trend-following and swing trading strategies that rely on Renko price action. ストラテジー

インジケーター

Renko Candles OverlayHello All,
For long time I got many request for Renko Candles and now here it's, Renko Candles Overlay . I tried to make almost everything optional, so you can play with the options as you want.
Let see the options:
Method: the option for brick scaling method: ATR, ATR/2, ATR/4, Percent, Traditional
- ATR Period: period for Average True Range and it's valid if the method is ATR
- ATR/2 Period: period for Average True Range and it's valid if the method is ATR/2
- ATR/4 Period: period for Average True Range and it's valid if the method is ATR/4
- Traditional: User-defined brick size, it's valid if the method is Traditional
- Percent: Percent of Close price, it's valid if the method is Percent
if the method is not Traditional (fixed brick size) then Brick size is calculated/updated when new bricks added. so The box sizes may be different because of the calculation is dynamic.
Levels & Lines for new Bricks: if you enable this option then the script shows the levels for new brick
Change Bar Color: optionally the script changes the bar color by using direction of the bricks
and some other options for coloring.
The script shows the bricks for visible area, which is approximately 280 candles. so if you change the width and number of the bricks then number of bricks that is shown is adjusted automatically to fit the screen. you can see the examples below:
The script shows the levels to new brick as a line and label:
Because of real-time bar is not confirmed until the candle close, the script shows the bricks as Unconfirmed , and unconfirmed bricks shown in different color:
You can change the width of the bricks (width is 10 in following example):
Optionally candle colors are changde by the direction of the bricks:
If you have any recommendation then please drop a comment under the script ;)
Enjoy! インジケーター

インジケーター

インジケーター

インジケーター

インジケーター

インジケーター

インジケーター

インジケーター

ストラテジー

インジケーター

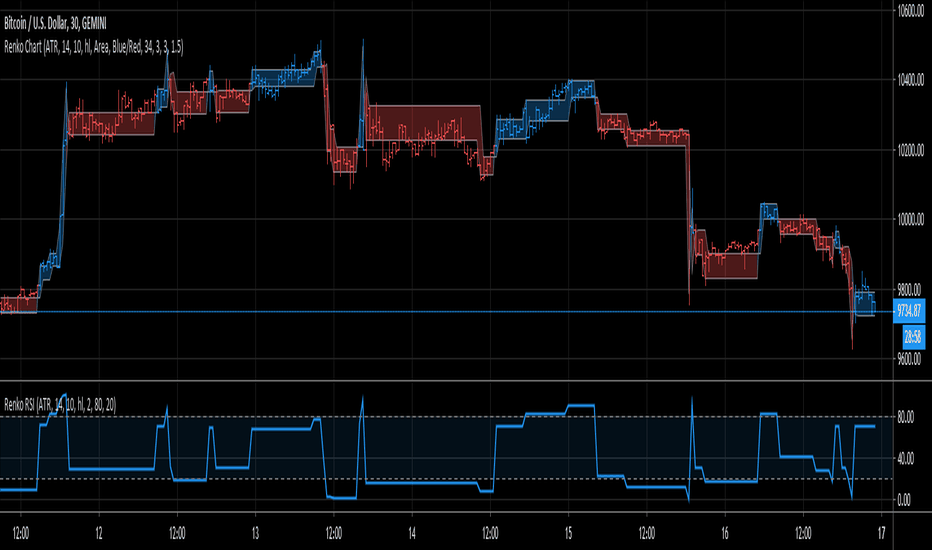
RenkoNow you can plot a "Renko" chart on any timeframe for free! As with my previous algorithm, you can plot the "Linear Break" chart on any timeframe for free!
I again decided to help TradingView programmers and wrote code that converts a standard candles / bars to a "Renko" chart. The built-in renko() and security() functions for constructing a "Renko" chart are working wrong. Do not try to write strategies based on the built-in renko() function! The developers write in the manual: "Please note that you cannot plot Renko bricks from Pine script exactly as they look. You can only get a series of numbers similar to OHLC values for Renko bars and use them in your algorithms". However, it is possible to build a "Renko" chart exactly like the "Renko" chart built into TradingView. Personally, I had enough Pine Script functionality.
For a complete understanding of how such a chart is built, you can read to Steve Nison's book "BEYOND JAPANESE CANDLES" and see the instructions for creating a "Renko" chart:
Rule 1: one white brick (or series) is built when the price rises above the base price by a fixed threshold value or more.
Rule 2: one black brick (or series) is built when the price falls below the base price by a fixed threshold or more.
Rule 3: if the rise or fall of the price is less than the minimum fixed value, then new bricks are not drawn.
Rule 4: if today's closing price is higher than the maximum of the last brick (white or black) by a threshold or more, move to the column to the right and build one or more white bricks of equal height. A new brick begins with the maximum of the previous brick.
Rule 5: if today's closing price is below the minimum of the last brick (white or black) by a threshold or more, move to the column to the right and build one or more black bricks of equal height. A new brick begins with the minimum of the previous brick.
Rule 6: if the price is below the maximum or above the minimum, then new bricks are not drawn on the chart.
So my algorithm can to plot Traditional Renko with a fixed box size. I want to note that such a "Renko" chart is slightly different from the "Renko" chart built into TradingView, because as a base price I use (by default) close of first candle. How the developers of TradingView calculate the base price I don’t know. Personally, I do as written in the book of Steve Neeson.
The algorithm is very complicated and I do not want to explain it in detail. I will explain very briefly. The first part of the get_renko () function — // creating lists — creates two lists that record how many green bricks should be and how many red bricks. The second part of the get_renko () function — // creating open and close series — creates open and close series to plot bricks. So, this is a white box - study it!
As you understand, one green candle can create a condition under which it will be necessary to plot, for example, 10 green bricks. So the smaller the box size you make, the smaller the portion of the chart you will see.
I stuffed all the logic into a wrapper in the form of the get_renko() function, which returns a tuple of OHLC values. And these series with the help of the plotcandle() annotation can be converted to the "Renko" chart. I also want to note that with a large number of candles on the chart, outrages about the buffer size uncertainty are heard from the TradingView blackbox. Because of it, in the annotation study() set the value of the max_bars_back parameter.
In general, use this script (for example, to write strategies)!
インジケーター

インジケーター

インジケーター

インジケーター

インジケーター

インジケーター

インジケーター

インジケーター