SCOTTGO - RVOL Bull/Bear Painter (Real-Time) SCOTTGO - RVOL Bull/Bear Painter (Real-Time Momentum Detection)
📌Overview
The RVOL Bull/Bear Painter is a Pine Script indicator designed to instantly highlight high-momentum candles driven by significant Relative Volume (RVOL).
It provides a clear visual signal (bar color, shape, and label) when a candle's volume exceeds its average by a user-defined threshold, confirming strong bullish or bearish interest in real-time. This helps traders quickly identify potential institutional accumulation/distribution or breakout/breakdown attempts.
✨ Key Features
Relative Volume (RVOL) Calculation: Automatically calculates the ratio of the current bar's volume to its moving average (SMA or EMA) over a customizable lookback period.
Momentum Confirmation: Paints the candle green (bullish) or red (bearish) only when both price direction and high RVOL criteria are met.
Real-Time Detection: Uses a plotshape method to display the signal triangle as soon as the RVOL and direction conditions are met on the currently forming candle, aiming for faster alerts than bar-close coloring.
Customizable Threshold: Easily adjust the RVOL multiplier (e.g., 1.5x, 2.0x, 3.0x) to filter out noise and only focus on truly significant volume events.
Labels and Alerts: Displays a volume multiplier label (e.g., BULL 2.55x) and includes pre-configured alert conditions for automated notifications.
🛠️ How to Use It
1. Identify High-Conviction Moves
Look for the painted candles and the corresponding labels. A candle painted green with a BULL label (e.g., BULL 2.5x) indicates that buyers stepped in with 2.5 times the typical volume to drive the price higher.
2. Configure Your Sensitivity
The power of the script lies in customizing the inputs:
RVOL Lookback Period: Determines the length of the volume moving average.
Shorter periods (e.g., 9-20) make the indicator more reactive to recent volume changes.
Longer periods (e.g., 50-200) require a much larger volume spike to trigger a signal.
RVOL Threshold: This is the multiplier.
Lower values (e.g., 1.5) will generate more signals.
Higher values (e.g., 3.0) will generate fewer, but generally higher-conviction, signals.
3. Set Up Alerts
Use the pre-configured alert conditions (Bullish RVOL Signal and Bearish RVOL Signal) in TradingView's alert menu. Crucially, set the alert frequency to "Once per bar" or "Once per minute" to receive notifications as soon as the high RVOL event occurs, without waiting for the bar to close.
Rvol

SCOTTGO - Day Trade Stock Quote V4This Pine Script indicator, titled "SCOTTGO - Day Trade Stock Quote V4," is a comprehensive, customizable dashboard designed for active traders. It acts as a single, centralized reference point, displaying essential financial and technical data directly on your chart in a compact table overlay.
📊 Key Information Provided
The indicator is split into sections, aggregating various critical data points to provide a holistic picture of the stock's current state and momentum:
1. Ownership & Short Flow
This section provides fundamental context and short-interest data:
Market Cap, Shares Float, and Shares Outstanding: Key figures on the company's size and publicly tradable shares.
Short Volume %: Indicates the percentage of trading activity driven by short sellers.
Daily Change %: Shows the day's price movement relative to the previous close.
2. Price & Volatility
This tracks historical and immediate price levels:
Previous Close, Day High/Low: Key daily reference prices.
52-Week High/Low: Important long-term boundaries.
Earnings Date: A crucial fundamental date (currently displayed as a placeholder).
3. Momentum & Volume
These metrics are essential for understanding intraday buying and selling pressure:
Volume & Average Volume: The current trade volume compared to its historical average.
Relative Volume (RVOL): Measures how much volume is currently trading compared to the average rate for that time period (shown for both Daily and 5-Minute rates).
Volume Buzz (%): A percentage representation of how much current volume exceeds or falls below the average.
ADR % & ATR %: Measures of volatility.
RSI, U/D Ratio, and P/E Ratio: Momentum and valuation indicators.
4. Context
This provides background information on the security:
Includes the Symbol, Exchange, Industry, and Sector (note: some fields use placeholder data as this information is not always available via Pine Script).
⚙️ Customization
The dashboard is highly customizable via the indicator settings:
You can control the visibility of every single metric using the Section toggles.
You can change the position (Top Left, Top Right, etc.), size, and colors of the entire table.
In summary, this script is a powerful tool for day traders who need to monitor a large number of fundamental, technical, and volatility metrics simultaneously without cluttering the main chart area.

Relative Volume EMA (RVOL)Relative Volume EMA (RVOL) measures the current bar’s volume relative to its typical volume over a selected lookback period.
It helps traders identify whether a price move is supported by real participation or if it’s occurring on weak, low-quality volume.
This version uses:
RVOL = Current Volume ÷ Volume EMA
Volume EMA Length: adjustable
Signal Threshold: a customizable horizontal line (default = 1.2)
How to Use
1. RVOL > 1.2 → High-Quality Momentum
A value above 1.2 indicates that the current bar has at least 20% more volume than normal, suggesting:
Strong conviction
Algorithmic activity
Momentum-backed breakout or breakdown
Higher probability trend continuation
These bars are ideal for confirming entries after a technical setup (e.g., pullback, engulfing pattern, Ichimoku trend confirmation, etc.).
2. RVOL < 1.0 → Weak or Low-Quality Move
When RVOL is below 1.0:
Volume is below average
Moves are more likely to fail or reverse
Breakouts are unreliable
Triggers lack institutional participation
These bars are best avoided for trade entries.
Why This Indicator Is Useful
In many strategies, price alone is not enough.
RVOL acts as a filter to ensure that your signals occur during times when the market is actually active and committed.
Typical use cases:
Confirm trend-following entries
Validate pullbacks and breakout candles
Filter out low-volume chop
Identify session-based volume surges
Improve risk-to-reward quality by entering only during true momentum
Recommended Settings
EMA Length: 20
Threshold Line: 1.2
Works well on Forex, Crypto, and Indices
Best used on 15m, 30m, 1H, and 4H charts

Long Elite Squeeze (LES) — H.H 22 Lindsay (AI)LES (Long Elite Squeeze)
LES (Long Elite Squeeze) is a trading framework designed to capture the highest-probability long setups. It’s not just another signal script — it’s a structured system built to filter noise, manage risk, and keep you aligned with real momentum.
🔹 Core Logic
Breakout Confirmation – Ensures moves have structure, not just random spikes.
Relative Volume (RVOL) – Confirms participation and fuel behind the move.
RSI Alignment – Avoids overextended traps and fakeouts.
Squeeze Momentum – The backbone of LES. Signals fire only after a defined squeeze pattern shift (6+ dark green bars followed by a light green bar).
🔹 Trade Management Built In
Automated Sell Signals – Trigger on either:
2 consecutive dark green bars on Squeeze Momentum
WaveTrend cross down
(only valid after a Buy signal — no random shorts)
HUD Entry Checklist – Live conditions shown on chart.
Status Tracker HUD – Flips between “Waiting for Entry” and “In Trade” for clear context.
🔹 Flexibility
3 switchable squeeze versions (V1, V2, V3) for different market conditions.
Customizable EMA & ATR settings (with color options).
Session-aware logic — filter signals to prime trading hours.
🔹 Blueprint & Credits
LES is a fusion of proven concepts, standing on the shoulders of respected creators:
-Squeeze Momentum – LazyBear
-WaveTrend Oscillator – LazyBear
-Relative Volume – LonesomeTheBlue
Breakout/structural logic – refined from classic frameworks
Their work laid the foundation — LES expands and integrates them into a complete trading system.
⚡ Why LES Stands Out
LES wasn’t coded overnight. It’s the result of countless hours of live testing, rebuilding, and refining. Every feature earned its place by proving value in real trading, not theory.
LES is more than an indicator. It’s a disciplined framework — crafted to turn chaos into structure, randomness into probability, and noise into clarity.
⚠️ Disclaimer: This is a trading framework, not financial advice. Performance depends on trader discipline, risk management, and market conditions.

Rogue ORB PRORogue ORB Pro is a precision-engineered Opening Range Breakout (ORB) indicator built for active intraday traders who need real signals, not noise.
This tool identifies high-probability breakout entries from the opening range, enhanced with optional ATR-based stop loss levels, deviation targets, cooldown filters, and a relative volume gate to filter weak setups.
🔍 Key Features:
Opening Range High/Low: Drawn from a user-defined time window and locked for the day
Deviations: Automatically plots target zones above and below the OR range (e.g. 1, 2 deviations)
Pre-Market Levels: Automatically draws pre market high and low lines at the end of pre market session
Buy/Sell Signals: Triggered on breakout of the OR High/Low with configurable breakout logic (touch or close)
ATR Stop Loss Line: Dynamically drawn at a fixed ATR distance from breakout candle, with optional SL label
Cooldown Period: Prevents back-to-back signals by enforcing a user-defined bar delay between entries, can help with overtrading
Volume Filter: Optional relative volume filter that requires breakout candles to exceed a custom volume threshold
VWAP Overlay: Visual VWAP for directional bias and confluence

Zanger Volume Ratio (ZVR)Zanger Volume Ratio (ZVR)
Credits:
Most of the underlying code and logic in this script have been adapted from the work originally published by The_Peaceful_Lizard
Overview
The Zanger Volume Ratio (ZVR) is a powerful indicator designed to reveal market dynamics by comparing current cumulative volume to an average determined over a historical look-back period. It uses the concept of relative volume to not only highlight unusual volume spikes, but also uses color to illustrate how today's trading compares to typical levels. This unique method of volume analysis was popularized by Dan Zanger - a trader known for turning $10,775 into $18,000,000 in less than two years - by identifying key shifts in market interest and volume behavior.
Key Features
Volume Pacing Analysis:
The script calculates a volume delta by comparing the cumulative volume at any given moment to an average derived over a user-defined lookback period (Default 20-day). The resulting percentage difference offers a clear visualization and insight into unusual volume activity.
Dynamic Visual Representation:
Choose between either “Columns” or “Area” plot styles to display the percent difference. Additionally, you have the option to switch between a standard plot or a background color display, with customizable transparency, ensuring the indicator fits seamlessly with your chart’s aesthetics.
Dashboard Integration:
A simple dashboard table is displayed on the chart, showcasing the current ZVR value in real-time. With user-configurable position, text size, alignment, and color options, this feature ensures that the key metric is always visible and easy to interpret.
Why Use the Zanger Volume Ratio?
The ZVR is more than just a volume indicator. It acts as a window into market sentiment by highlighting days when trading interest intensifies. Many traders believe that an unusually high volume ratio may confirm trend strength or signal a reversal, making the indicator a valuable tool when used in conjunction with other technical analysis methods.
Whether you’re monitoring stocks, commodities, or forex markets, the Zanger Volume Ratio offers an accessible yet sophisticated method to decode volume dynamics. Its practical design and real-time visual feedback provide traders of all experience levels with critical data to spot high-potential setups.
Chart Description
First Pane: normal Volume Indicator on the foreground, ZVR as Background colors
Second Pane: ZVR Indicator with Column Style (default)
First panel: normal volume indicator in foreground, ZVR as background colors
Second panel: ZVR indicator with column style (default)
Note: This indicator is intended for use on intraday charts only!

Comprehensive Volume and Metrics with Pre-Market Volume Data
This script is designed for traders who want a detailed view of market activity, including regular market and pre-market volume, dollar volume, relative volume (RVOL), average daily range (ADR), average true range (ATR), relative strength index (RSI), and the QQQ’s percentage change.
The script includes customizable metrics displayed in tables on the chart for easy analysis, with the option to toggle the visibility of each metric.
Key Features:
Volume and Dollar Volume:
Displays the volume of shares traded during the current day (or pre-market, if enabled).
Includes a calculation of dollar volume, representing the total dollar amount of trades (Volume × Close Price).
Relative Volume (RVOL):
Displays RVOL Day, which is the relative volume of the current day compared to the 2-day moving average.
Shows RVOL 90D, indicating relative volume over the past 90 days.
Both RVOL metrics are calculated as percentages and display the percentage change compared to the standard (100%).
Pre-Market Data:
Includes pre-market volume (PVOL) and pre-market dollar volume (P$ VOL) which are displayed only if pre-market data is enabled.
Tracks volume and dollar volume during pre-market hours (4:00 AM to 9:30 AM Eastern Time) for more in-depth analysis.
Optionally, shows pre-market RSI based on volume-weighted close prices.
Average Daily Range (ADR):
Displays the percentage change between the highest and lowest prices over the defined ADR period (default is 20 days).
Average True Range (ATR):
Shows the ATR, a popular volatility indicator, for a given period (default is 14 bars).
RSI (Relative Strength Index):
Displays RSI for the given period (default is 14).
RSI is calculated using pre-market data when available.
QQQ:
Shows the percentage change of the QQQ ETF from the previous day’s close.
The QQQ percentage change is color-coded: green for positive, red for negative, and gray for no change.
Customizable Inputs:
Visibility Options: Toggle the visibility of each metric, such as volume, dollar volume, RVOL, ADR, ATR, RSI, and QQQ.
Pre-Market Data: Enable or disable the display of pre-market data for volume and dollar volume.
Table Positioning: Adjust the position of tables displaying the metrics either at the bottom-left or bottom-right of the chart.
Text Color and Table Background: Choose between white or black text for the tables and customize the background color.
Tables:
The script utilizes tables to display multiple metrics in an organized and easy-to-read format.
The values are updated dynamically, reflecting real-time data as the market moves.
Pre-Market Data:
The script calculates pre-market volume and dollar volume, along with other key metrics like RSI and RVOL, to help assess market sentiment before the market officially opens.
The pre-market data is accumulated from 4:00 AM to 9:30 AM ET, allowing for pre-market analysis and comparison to regular market hours.
User-Friendly and Flexible:
This script is designed to be highly customizable, giving you the ability to toggle which metrics to display and where they appear on the chart. You can easily focus on the data that matters most to your trading strategy.

Advanced Volume-Driven Breakout SignalsThe "Advanced Volume-Driven Breakout Signals" indicator is a cutting-edge tool designed to help traders identify high-potential trading opportunities through sophisticated volume analysis techniques. This indicator integrates volume flow analysis, moving averages, and Relative Volume (RVOL) to provide a comprehensive view of market conditions, going beyond traditional Volume Spread Analysis (VSA) methods.
Key Features:
Volume Flow Analysis: Distinguishes bullish and bearish volume flows with distinct colors, making it easier to visualize market sentiment and potential breakout points.
Volume Flow Moving Averages: Calculates moving averages for volume using various methods (SMA, EMA, WMA, HMA, VWMA), accommodating different trading strategies. This includes settings for adjusting the type of moving average and its period, as well as thresholds for high, medium, and low volume levels.
Volume Spikes Detection: Identifies significant volume spikes based on user-defined multipliers and moving averages, highlighting unusual trading activity.
Volume MA Cloud Settings: Computes general moving averages of volume to track trends and detect deviations. This feature includes options to select different moving average types and adjust thresholds for detecting high volume activity.
Relative Volume (RVOL): Measures current volume relative to historical averages, triggering signals when RVOL exceeds predefined thresholds, indicating notable changes in trading activity.
Entry Conditions: Provides clear long and short entry signals based on combined volume flow conditions and RVOL, offering actionable trading opportunities.
Volume Visualization:
— Bullish Volume Flow: Light and dark green bars indicate bullish volume flow.
— Bearish Volume Flow: Light and dark red bars denote bearish volume flow.
— High Volume Bars: Highlighted in yellow, and extreme volume bars in orange for additional context. These bars are plotted for visual aid and do not directly influence trade signals, focusing instead on the quality and strength of the volume flow.
Alerts: Allows users to create alert notifications for long and short entry signals when the criteria are met, enabling traders to respond promptly to trading opportunities.
Usage:
Overlay: Apply the indicator directly to your price chart to visualise real-time signals and volume conditions.
Customisable: Adjust settings for moving averages, RVOL, and other parameters to match your trading strategy and preferences.
Comparison to VSA Scripts: The "Advanced Volume-Driven Breakout Signals" indicator extends beyond traditional VSA scripts by incorporating a wider range of analytical features. While VSA primarily focuses on volume spread patterns and price action, this indicator offers enhanced functionality with advanced RVOL metrics, customizable moving averages, and detailed volume spike detection, making it a more versatile tool for identifying breakout opportunities and managing trades. It is particularly effective when used alongside key levels and order blocks.
Acknowledgements: Special thanks to @oh92 and @goofoffgoose for their invaluable scripts, which served as inspiration in the development of this advanced trading indicator.
Notes: The script is continually evolving, with ongoing refinements aimed at enhancing accuracy and performance.

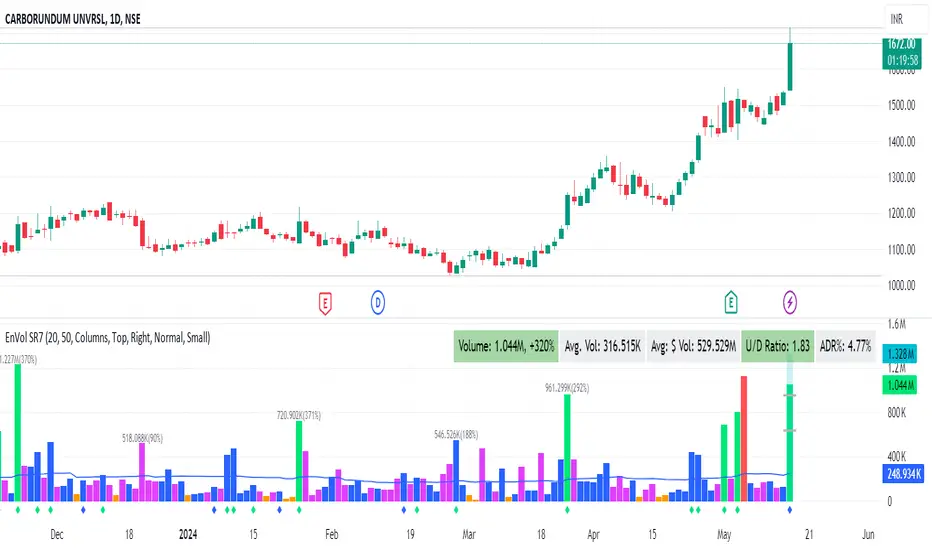
Enhanced Volume by SR7SiddharthaRay007's Enhanced Volume Indicator works on any Timeframe
⦿ Volume Labels:
1. Current Volume, Volume Change%, Average Volume, Average Doller Volume, Up/Down Ratio, ADR%.
=>Average value can be changed using 'Lookback Length' (Default: 20)
⦿ Simple Moving Average: MA (Default: 50). Color of MA changes based on the up down volume ratio.
1. Up/Down Ratio > 1: Blue
2. Up/Down Ratio < 1: Orange
⦿ Volume Bar Colors:
1. High Relative Volume Positive Candle: Lime Green .
2. High Relative Volume Negative Candle: Red .
3. Normal Volume Positive Candle: Blue .
4. Normal Volume Negative Candle: Fuchsia .
5. Low Relative Volume Positive/Negative Candle: Orange .
=>High Relative Volume > 300% of Average Volume; Low Relative Volume < 30% of Average Volume
⦿ Pocket Pivot (A pocket pivot is an up day with volume greater than any of the down days volume in the past 10 days)
1. 10 day Pocket Pivots: Lime Green Diamond below volume bar
2. 5 day Pocket Pivots: Blue Diamond below volume bar
⦿ 'Highest Volume (HV) ' on top of the Volume Bar:
1. Highest Volume Ever (HVE)
2. Highest Volume in Over a Year (HVY)
⦿ Projected Volume Bar: Aqua
⦿ Plot a line at 2x and 3x Average Volume and set Alerts
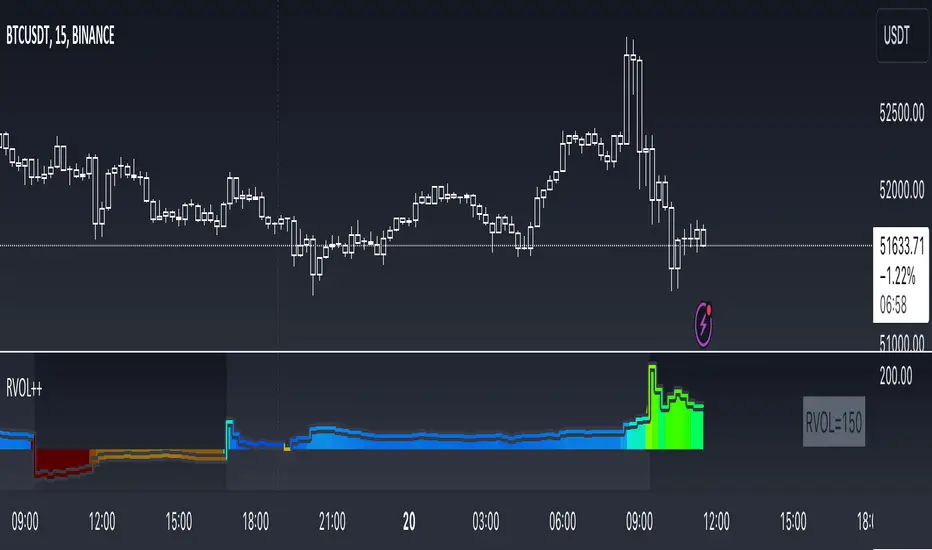
RVOL++Overview
RVOL++ is a valuable tool for intraday traders to gauge market participation and anticipate the pace of the market. By understanding the RVOL levels, traders can adjust their strategies and expectations to align with the current market conditions. RVOL is a simple mathematical formula that compares the current volume to a prior lookback period, such as the previous 5 days or previous 10 days. This indicator helps traders understand the level of interest or participation in the market, which in turn can indicate the speed or pace of the market.
How to calculate RVOL at Time
Check if the current time is within the specified time period (e.g., 9:30 AM to 5:00 PM EST).
If it is, calculate the current cumulative volume for that period.
Find the average cumulative volume for the same period over the past X days (where X is the lookback period).
Calculate the RVOL at Time as:
RVOL at Time =(Current Cumulative Volume/Average Cumulative Volume)×100
For more info about calculating RVOL at time please refer to the Tradingview article.
www.tradingview.com
Key Features of RVOL++
Two Session and Daily Modes: In Two Session mode, it calculates RVOL for two distinct trading sessions, while in Daily mode, it calculates RVOL for the entire trading day. Two Session mode helps for instruments like futures, forex, crypto that trade 23+ hours. If you are using an instrument such as a stock like AAPL, if you don't have pre-market/extended hours enabled you will want to use "Daily Mode".
Session Time Settings: The indicator allows users to define the trading session times in Eastern Standard Time (EST) for more accurate RVOL calculations.
Customizable Lookback Period: Users can set the number of days for the lookback period, allowing for flexibility in calculating the average volume at time (RVOL).
Color-Coded RVOL Histogram: The indicator displays a color-coded histogram to visualize RVOL levels. Different colors represent different RVOL ranges, making it easy to identify low, neutral, and high RVOL periods.
RVOL Ranges**: The indicator defines RVOL ranges as follows:
40 - 80: Low RVOL (Red/Yellow)
80 - 120: Neutral RVOL (Blue/Cyan)
120+: High RVOL (Green-Lime)
Low RVOL Environment
Expect slow market movement with limited opportunities.
Focus on A+ setups and be selective.
Use tighter stops, size down, and adjust trading goals.
Neutral RVOL Environment
Expect a more normalized trading pace with frequent rotations.
Lean on structure and incorporate other trading tools.
Use normal sizing and stop management.
High RVOL Environment
Expect the best opportunities for range expansion and rotations.
Be more relaxed about overtrading but stay focused on structure.
Start with smaller initial size and build up to a full position.
Relative Volume at Time (RVolAT) ChartShared for friends, but others are welcome to use.
RVolAT chart, designed for US equity markets, displayed as chart of current bar volume relative to the average volume for that period over a specified number of days. This can be calculated in two ways - see Calculation Mode below.
The chart uses a heatmap to identify RVol, with anything greater than 3 as the highest level. The increments are in 0.5 units.
The chart includes a current indicator using the heatmap colours at the last bar. The label colour will change according to RVol.
Previously I generated a x day, 1440 period array as the basis of calculations, but now that TradingView has released a rvol technical analysis (ta.relativeVolume) I have adopted this. This results in faster processing times, and the results are in line with my previous model.
According to the TV documentation:
Anchor Point
Specifies the size of the period used in the Relative Volume calculation, as described in the Calculation section above. If the "Anchor Timeframe" value is less than or equal to the chart's timeframe, the period will reset on every chart bar, which means the indicator will only use the last N bars in its calculation (where N is the "Length" value).
Lookback period
Specifies the number of historical periods used in the average volume calculation at the current time point. TV uses 5 but I have used 20 as a default setting
Calculation Mode
Specifies the type of volume used in the calculation.
If Cumulative, the indicator uses accumulated volume from the beginning of each period.
If Regular, it uses non-cumulative bar volume
I continually improve my models to add more functionality or styling so watch for updates.

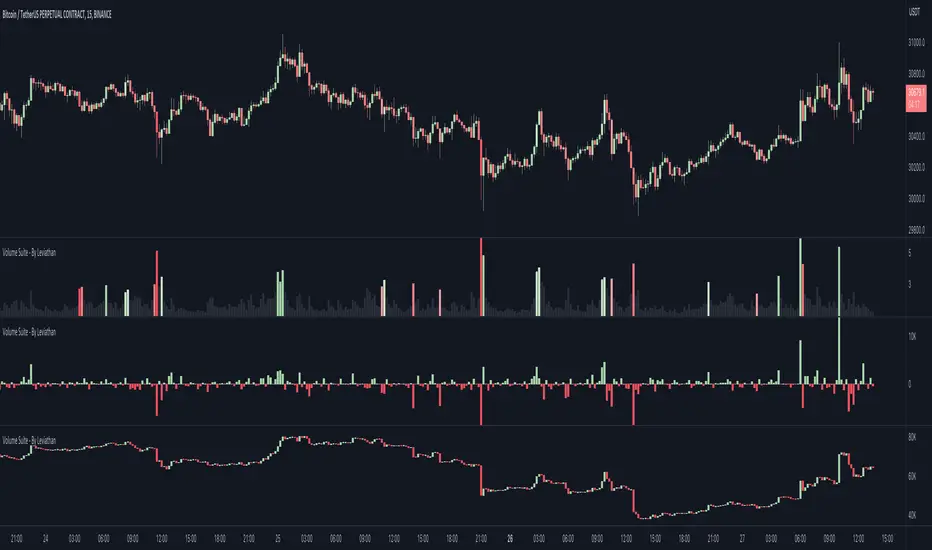
Volume Suite - By Leviathan (CVD, Volume Delta, Relative Volume)Volume Suite is an all-in-one script that includes several volume-based indicators such as CVD, Volume Delta, Relative Volume, Buy/Sell Volume, Cumulative Relative Volume and more. Additionally, it offers fully customisable appearance and features for improved data visualization, such as highlights for high volume activity, small price changes with high volume, or large price changes with low volume and more.
Data available in version 1:
- Volume Delta
Volume Delta is the net difference between Buy Volume and Sell Volume at a given bar. Positive Delta indicates that Buy Volume > Sell Volume, while Negative Delta means that Sell Volume > Buy Volume. As there is not way to get tick data on Tradingview, calculating Volume Delta is improvised by using the direction of lower timeframe candles and their volume.
- Cumulative Volume Delta (CVD)
CVD is a running total/cumulation of Volume Delta values, where positive VD gets added to the sum and negative VD gets subtracted from the sum. It can be used for trend strength analysis, divergence strategies, sentiment, etc.
- Buy/Sell Volume
Buy and Sell Volume provides an insight into volume activity in a given bar by estimating the buying/selling volume based on the direction of lower timeframe candles and their volume.
- Relative Volume
Relative Volume is used to compare current trading volume to past trading volume over a given period. For instance, a relative volume of 1.0 indicates that volume is at an average level, while a relative volume of 2.0 suggests that the volume is twice as high as the average.
- Cumulative Relative Volume (CRVOL)
CRVOL is a running total/cumulation of Relative Volume values, where RVOL at close>open gets added to the sum and RVOL at close
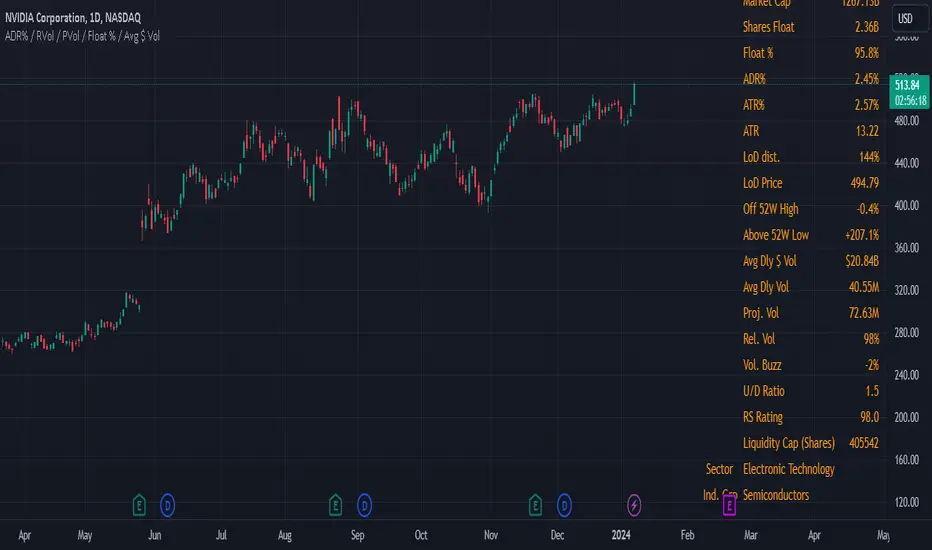
Swing Data - ADR% / RVol / PVol / Float % / Avg $ VolThis table presents consolidated data that swing traders can refer to quickly for their benefit. I am of the firm belief that the information provided in this uncomplicated table is precisely what you require to optimize your trading efficiency, and ultimately, profitability.
The data includes;
1. Market Capitalization - a measure of the total value of a publicly traded company's outstanding shares.
2. Float % - the percentage of a company's outstanding shares that are available for trading on the open market. It is calculated by dividing the number of a company's outstanding shares that are available for trading on the open market by the total number of outstanding shares. A lower float percentage generally means that there are fewer shares available for trading, which can lead to increased volatility in the stock price. On the other hand, a higher float percentage generally means that there are more shares available for trading, which can lead to greater stability in the stock price.
3. ADR% - a technical analysis indicator that measures the average daily price movement as a percentage of its current price. It is calculated by taking the difference between the average high and low prices for a time period, and then dividing it by the current price. The resulting value is then multiplied by 100 to give the ADR% for that day. The ADR% can be useful for traders to assess the potential volatility of a stock. A higher ADR% indicates a greater potential for price movement.
4. ATR - measures the range of price movements of an asset over a specified period of time, taking into account any gaps in price. It is calculated by taking the highest value of the following three values:
The difference between the current high and the current low
The absolute value of the difference between the current high and the previous close
The absolute value of the difference between the current low and the previous close
The resulting value is then averaged over the specified period of time to create the ATR value. This indicator is reflects the average volatility of the asset over the specified period of time.
5. LoD dist. - also refer to Low Of Day distance, a range level gauge of current price based on historical volatility of the price movement, in this case I use ATR. for the historical volatility. Please find below as example for the calculation.
eg. LoD dist. = 104%
Current price (A) = $24.49
Low Price (B) = $22.16
Difference (A) - (B) = $2.33
ATR = $2.25
LoD dist = $2.33 / $2.25 = 103.55% (round up to nearest whole number = 104%)
6. Average Daily $ Volume - used to measure the average amount of money that is traded in a stock or a security over a particular period of time, typically a day. It is calculated by multiplying the average daily trading volume of a security by its average price.
7. Average Daily Volume - used to measure the average no. of share that is traded in a stock or a security over a particular period of time, typically a day.
8. Projected Volume - an estimate of the total volume of trading activity that is expected to occur for the day (from the specific time data), based on an average volume over a specific period of time. Projected volume can be used by traders and investors to help make informed decisions about buying or selling securities, and can also be used as an indicator of market sentiment and volatility. However, it's important to note that projected volume is an estimate and actual trading activity may vary.
9. Relative Volume - a measure of the volume of a stock that is trading at the specific time, relative to its average trading volume over a longer period. It is expressed as a percentage and is often used by traders and investors to identify stocks that are trading with higher or lower than usual volume.
[TTI] Zanger Volume Ratio - Intraday––––HISTORY & CREDITS 🏦
The Zanger Volume Ratio - Intraday indicator is inspired by the work of Dan Zanger, a renowned trader and creator of the Zanger Volume Ratio tool. This specific adaptation of the ratio is designed for the TradingView platform and focuses on intraday trading. Dan Zanger used this same method of reading the chart to establish a world record in turning HKEX:10 ,775 into HKEX:18 ,000,000 in under 2 years.
––––WHAT IT DOES 💡
The Zanger Volume Ratio - Intraday indicator measures the estimated end-of-day volume percentage based on intraday (depending on the timeframe of your chart) comparisons for the last X days (input in the settings). It provides insights into the stock's trading volume in real-time throughout the trading day, giving traders an idea of the stock's relative volume compared to its recent trading history. For instance if you add it to a 5min chart the ratio represents the estimated end of day volume percent based on the last 3 days, the indicator will compare the cumulative volume of the current day to the X days back cumulative average up to that same point in time and tell you how it is around the thresholds.
The indicator categorizes the volume into five levels: Extreme, High, Average, Light, and Dry Up, each represented by different colors on the chart. It also displays a pace indicator, which shows whether the volume is increasing or decreasing during the trading session.
There is also a label that shows the current reading and its pace. The pace is the indication wether the volume ratio pace is increasing and picking up or it is slowing down.
Thesholds
👉EXTREME (red): >200, means "Volume is 200% of average daily volume
👉HIGH (magenta): 110
👉AVERAGE (peach): 85
👉LIGHT (orange): 60
👉DRY (gray): <60
––––HOW TO USE IT 🔧
To use the Zanger Volume Ratio - Intraday indicator effectively, follow these steps:
1️⃣ Apply the indicator to your TradingView chart with an intraday timeframe (>=1min and less than 1 day).
2️⃣Observe the real-time volume levels and their corresponding categories (Extreme, High, Average, Light, and Dry Up) to understand the current volume dynamics.
3️⃣Keep an eye on the pace indicator (arrows) to see if the volume is increasing or decreasing during the session.
4️⃣Use the information provided by the indicator to confirm trade setups, identify potential breakouts, or detect possible reversals. For example, a stock breaking out of a key area with high or extreme volume and an increasing pace arrow may indicate a strong upward move. Conversely, a stock pulling back on light or dry up volume could signal a continuation of the trend once the volume picks up again.
Remember to combine the Zanger Volume Ratio - Intraday indicator with other technical analysis tools and your own trading strategy to make informed decisions.

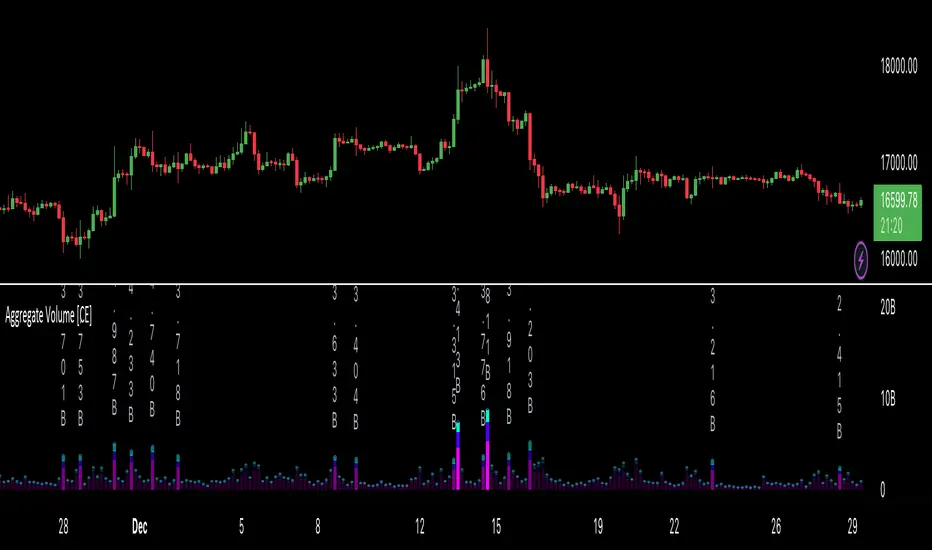
Aggregate Volume [CE]Aggregate Volume automatically fetches and aggregates futures volume data from multiple exchanges such as Binance, OKX, and Bybit -- for any crypto asset, and highlights the volume bars that exceed a user-defined threshold.
This provides a fresh take on the classic Relative Volume in the form of Aggregate Relative Volume.
This indicator displays where the most significant volume has occurred and allows them to easily identify buying and selling climaxes within a high signal and low noise format.
Within the inputs are options that allow you to opt out of certain exchanges or change the color of the bars.
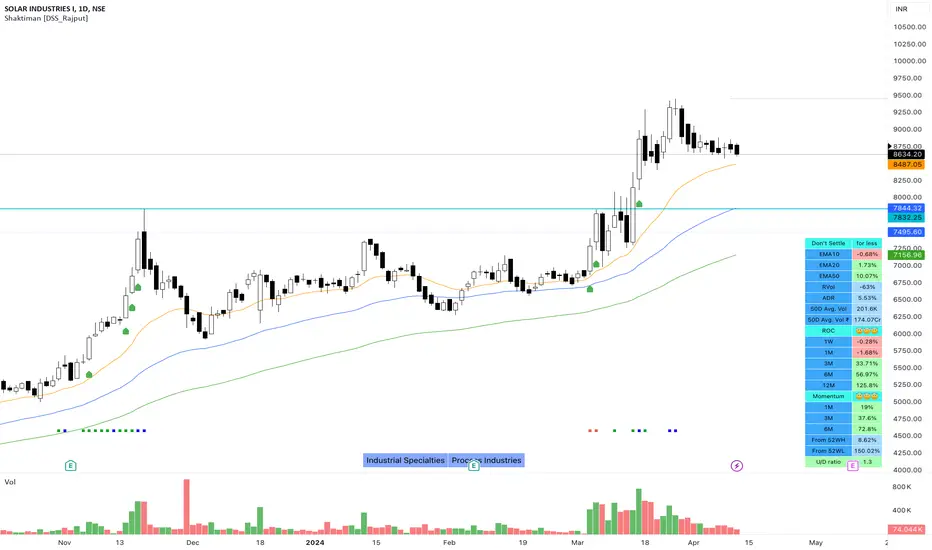
Shaktiman [DSS_Rajput]I'm a Momentum Trader, following the Indian markets, Mark Minervini and William O'Neil follower.
User Settings
Inputs tab
EMA option for Table - It compares the current price of the symbol to its key EMA's and calculates the rate of return to make it easier to track the performance of the symbol. It Helps you to identify how far the price is from its Key EMA's
ADDITIONAL TABLE DATA - It will allow you to use multiple performance data sets with your set of customizable inputs (You can change periods as per your requirements)
Show Inside Bar (IB): Allows you to add Inside Bar on your chart
Show NR4 (Narrow Range): Allows you to add an NR4 bar on your chart
Show INR7(Narrow Range): Allows you to add NR7 Bar on your chart
Distance_From_EMA_Table: Allows you to enable/disable the price difference with its key EMA's table.
ROC_Table: It compares the current price of the symbol to its past price and calculates the rate of return to make it easier to track the performance of the symbol.
Note that the Performance sidebar is not updated in real-time, while this indicator is, so on real-time charts.
The formula of the calculation is (Current value - Past value) * 100 / Past value, where Past value is: 1W, 1M, 3M, 6M, 1Y
Momentum_Table: It compares the current price of the symbol to its past lowest price of that period and calculates the %Gain of the symbol from the low of that period
Power_Play_Candidate: It will show the power play candidate, similar to IBD, It merely qualifies for Power_Play.
You need to wait for the Right Entry point. It will give you 8 Week Range.
According to IBD, it should move 100%+ in less than 8 weeks. You can modify your criteria by changing the percentage gain.
U/D Ratio: IBD defines the U/D ratio as "A 50-day ratio that is derived by dividing total volume on up days by the total volume on down days.
A ratio greater than 1.0 implies positive demand for a stock"
UpVol criteria: close>open and vice versa for DownVol
Rvol (Relative Vol): Percentage volume change (compared to daily average volume)
ADR : It allows you to add the Average Daily Range to the table.
Show 50D Avg. Vol & Avg. Vol rupee: It allows you to add 50-Day Avg. Vol and 50-Day Avg. Vol rupee.
Show_Bull_Snort: Allows you to add bull snort to your chart and style the bar.
Bull Snort is the work of Oliver Kell. For more info about Oliver kell, check youtube videos of Oliver Kell.
Normal Moving Average: Plot 4 Simple, Exponential, and Weighted Moving Averages. (You can choose an option between EMA/SMA/WMA)
Fixed Moving Average : Plot 4 Simple, Exponential, and Weighted Moving Averages. (You can choose an option between EMA/SMA/WMA)
Plus Point: It will not change its value when you switch to a different timeframe. Let's say you applied Fixed Daily 20MA, on the intraday chart.
It will not change its value and It will give you much more clarity that, from where the price is bouncing from 20MA. Explore it (You will definitely love it!)
Fixed Moving Average : Plot 2 Simple, Exponential, and Weighted Moving Averages. (You can choose an option between EMA/SMA/WMA)
Plus Point: It will not change its value when you switch to a different timeframe. (It's like Plotting 10 Week Line on Daily Chart & Intraday Charts)
Numbers of weeks to show High & Low: It will add data to the tables and also add 52 weeks of High & Low lines on the charts.
(Number of weeks is customizable, you can change as per your requirements.)
Style tab
You can modify the style and color of any of the inputs except table color.
Conclusion
If you like this script, click on Add to favorite indicators, so that you can easily add this indicator from your favorites tab right away.
Hope you find this useful. Please leave any questions you have in the comment section and I'll be happy to answer them.
Thanks!
RVOL/ATR LabelRelative Volume and Average True Range are critical for quick decision-making and managing risk. Even if the setup is there for a day trade, having a high relative volume on the name helps with confirmation to put on the risk. Additionally, using ATR to define your risk is a very helpful way to quickly size your trade in the moment. This indicator provides the ability immediately assess whether a trade is worth taking, as well as defining risk for the trade.
HOW TO USE
Our relative volume calculation looks at the cumulative volume up until the current minute of the day, and compares that with the same calculation of the previous 5 trading days. We have provided an "RVOL Threshold" input, which paints the RVOL square green if it is greater than or equal to this number (otherwise, it is red). We prefer an RVOL value of at least 2; however, feel free to change this value to your preference.
OUTPUTS
This indicator prints the RVOL and ATR values in the top right of your chart for quick and easy decision-making (as described above). If the RVOL value is greater than or equal to your RVOL Threshold, the square will be green. Use the color-coding to your advantage when making quick decisions.
Happy Trading!

Multi Exchange Relative Volume - FOREXHello traders! This is my first script that I will publish here. This script calculates the relative volume based on the average volume at that time of the day across different brokers.

4C Volume w/ Relative Volume at TimeThis is a Volume indicator that also shows Relative Volume at Time (RVOL).
The RVOL is easily visible as a background color, that changes between Low and High RVOL colors.
The RVOL portion of the indicator is a modified version of the 'Relative Volume At Time' indicator by Tradingview (which has been the best/most accurate RVOL indicator i have seen yet on Tradingview, and seems to closely match the how the "Zanger Volume" indicator works).
Elevated RVOL can be a very important criteria for trading , especially on lower time frames.
This indicator can be used as a simple filter when looking at charts to determine whether it should be traded or not, based on the RVOL.
Higher volume/participation relative to previous time periods can lead to better follow through of moves and price action, and can lead to trending conditions.
Lower RVOL can lead to choppy market conditions, with lower participation and follow through on chart patterns.
The RVOL portion of the indicator draws from the Tradingview 'Relative Volume At Time' indicator developed by authors @e2e4mfck and @LucF , for TradingView.
This indicator takes the Past Volume mark and changes it into a background color.
High RVOL = When the day's cumulative volume is greater than the Past Volume levels, then the background is painted Blue by default
Low RVOL = When the day's cumulative volume is lower than the Past Volume levels, then the background is painted Purple by default
See annotated examples in the chart Below, which compares/contrasts this new indicator with the RVOL indicator by Tradingview:
Portions of the 'Relative Volume At Time' indictor code have been removed to clean up the script.
Plans in the future are to remove more code were possible, to further refine the script and speed up the processing times for the indicator.
If anyone is able to strip out more and keep it functioning the same, please let me know.
Enjoy.
Credit also goes to author @LazyBear . Portions of the Volume indicator is adapted from - HawkEye Volume Indicator

[TTI] ZVR Watchlist––––History & Credit ––––––––––––––––––––––––––––––––––––––––––––––––––––––––––––––
This indicator/screener is inspired by the methodology of a great momentum master - Dan Zanger. Dan holds the world record for higher % gain in a 12month period, which was achieved in 1998 and has not been broken since. One of the secrets he has shared with the world is his famous Zanger Volume Ratio (ZVR), to which his attributes great part of his success.
–––––What it does –––––––––––––––––––––––––––––––––––––––––––––––––––––––––––––––
The script allows you to monitor your watchlist for the most important momentum indicators on an intraday basis in order to maximise your chance of jumping in the right time.
1️⃣ ZVR - pre breakout indicator
ZVR measures unusual momentum at a given time of the day.
Example
Imagine it is the first hour of the trading session and you get AAPL with a daily volume (up to that time) of 2mn shares. Is this normal or not? If you just compare it to the average volume you will be making a logical mistake, since you have 7more hours for volume to reach the "average" level. Henceforth, average volume should be compared on an end of day basis. However, the ZVR looks at the current intraday cumulative volume at any particular time of day, and compare that to the average cumulative volume that has usually traded by that time of day in the past.
The 4 colors are 4 types:
🔴 (RED) — Volume is over 200% of the usual cumulative intraday volume for that day
🟣 (PURPLE) — Volume is between 150% and 200% of the usual cumulative intraday volume for that day
💓 (PINK) — Volume is between 100% and 150% of the usual cumulative intraday volume for that day
🟠 (ORANGE) — Volume is between 50% and 100% of the usual cumulative intraday volume for that day
🌚 (GRAY) — Volume is under 50% of the usual cumulative intraday volume for that day
2️⃣ SQN
The SQN is defined by the late Market Wizard Dr. Van Tharp: "A measure of a market’s movement through an application of the System Quality Number calculation. To calculate, the daily changes from close to close measured in percentage terms are averaged and the standard deviation is calculated. Plugged into the SQN formula, those values and the number of days (N) provide the market SQN score."
👉 Super Bullish - denoted by SB and lime color
👉 Bullish - denoted by B and green color
👉 Neutral - denoted by N and cyan/aqua color
👉 Bearish - denoted by Br and dark red color
👉 Super Bearish - denoted by SBr and light red color
–––––How to use it –––––––––––––––––––––––––––––––––––––––––––––––––––––––––––––––
I use the indicator very much like a watchlist. I put it on a secondary chart and load up all the stocks that I have identified as a buyable. I then wait to get signs of breakout. My favourites are stocks which are in SuperBullish trend (SQN) and starting to show RED ZVR in the beginning of the day. Often these are very strong names that show institutional buying. I purchase close to pivot point and hold for a swing trade. If the stock advances too fast 5-7% on the day, I take some off into strength.
Suggested use for this indicator is to combine with any volatility contraction methodology. Some examples include the TTM Squeeze, Squeeze Pro or my personal favorite Mark Minervini's Volatility Contraction Pattern (VCP).
Look for stocks in a long term uptrend (we have another indicator for Stage 2 identification).

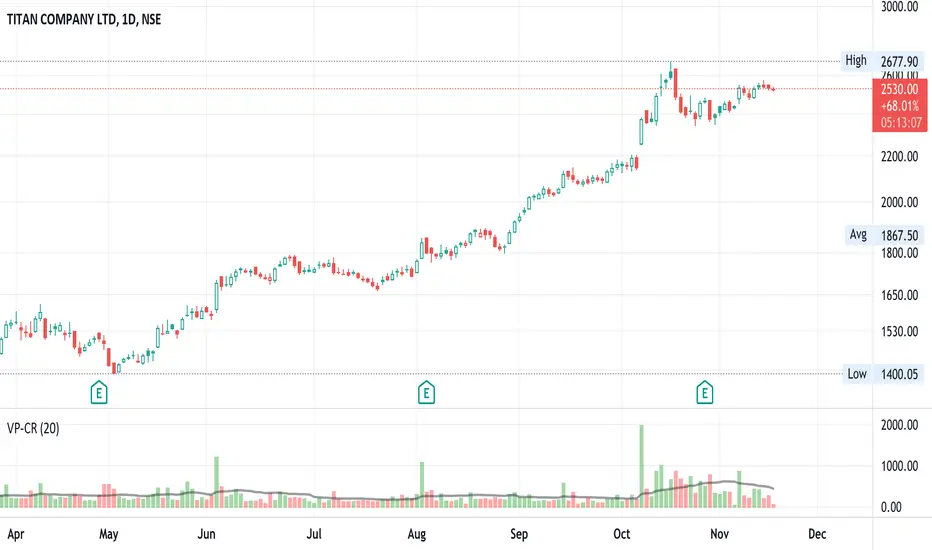
Volume x Price in Crores + RVolScript is designed predominantly for Indian users. Many are used to looking at numbers in lakhs and crores vs millions and billions, this provides a volume figure in rupee crores.
Formula is last close_price x volume / 1 cr or (close_price x volume /10000000). The second figure is the simple moving average (default to 20sma ) again in rupee crores. The third is the relative volume - todays volume / 20 day moving average.
Helpful especially when putting on a trade for a thinly traded stock. It is a quick gauge to how large or small one would want to buy or avoid. Helps manage risk. Also, great to see large volumes in crores to gauge institutional buys or sells.
On 10/NOV/21 - In the chart displayed here, Titan volumes are on average quite substantial as one can see. The 20 day moving average is 550 CR+. 10/NOV volumes are shown as 226 CR and the RVOL is 0.41 (226/550).
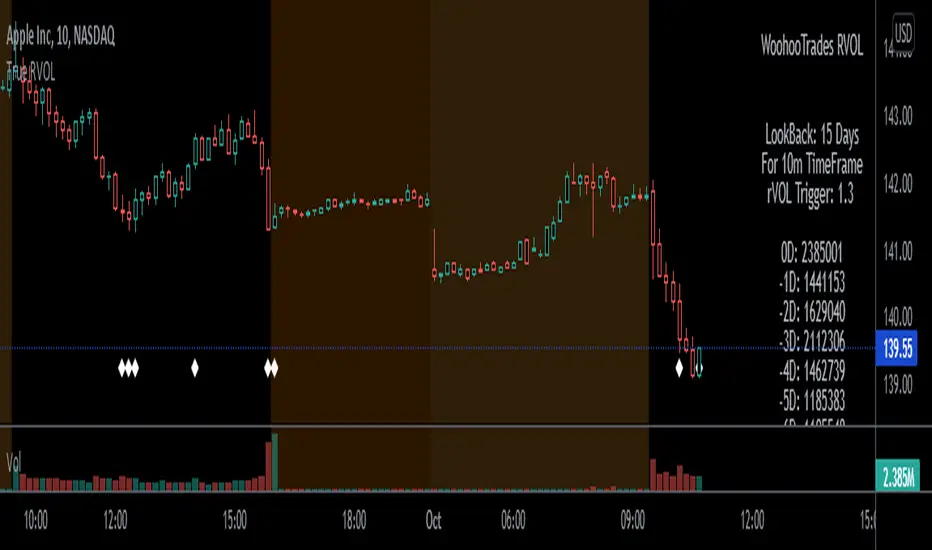
True Relative VolumeRelative Volume shows traders how "in-play" a current stonk is. Works great for day traders and scalpers!
Volume of Current TimeFrame's ratio to the average volume over X days back on the same time frame.
ie .
z = Volume at 0930-0940am over X days period divided by X
rVol = current volume divided by z
Dots at the bottom to indicate candles whose RVOL is morethan set minimum ratio.
Yes, its only 5 and 10 minutes. Might do calculations for other timeframes if this gets a good following.
Only works on US market session. 0930am to 0400pm EST.
Play Strategies :
- on break of support/resistance, if rvol supports action, ride direction of price action.
- look for in-play names, wait for price action to return to support/resistance area on low volume then
revisit if a bounce on the support/resistance line is supported by rVol again.
REMINDER!!!
This works only on 5 and 10 minutes TF. Dont forget to change your chart's timeframes.
This script will calculate erroneously if timeframe set on script and chart's current time frame are different.
Works even if extended market is enabled on your charts. It only looks at 0930 - 1600 EST bars.
Enjoy! Would love to hear your thoughts.
Relative Volume (rVol), Better Volume, Average Volume ComparisonThis is the best version of relative volume you can find a claim which is based on the logical soundness of its calculation.
I have amalgamated various volume analysis into one synergistic script. I wasn't going to opensource it. But, as one of the lucky few winners of TradingClue 2. I felt obligated to give something back to the community.
Relative volume traditionally compares current volume to prior bar volume or SMA of volume. This has drawbacks. The question of relative volume is "Volume relative to what?" In the traditional scripts you'll find it displays current volume relative to the last number of bars. But, is that the best way to compare volume. On a daily chart, possibly. On a daily chart this can work because your units of time are uniform. Each day represents a full cycle of volume. However, on an intraday chart? Not so much.
Example: If you have a lookback of 9 on an hourly chart in a 24 hour market, you are then comparing the average volume from Midnight - 9 AM to the 9 AM volume. What do you think you'll find? Well at 9:30 when NY exchanges open the volume should be consistently and predictably higher. But though rVol is high relative to the lookback period, its actually just average or maybe even below average compared to prior NY session opens. But prior NY session opens are not included in the lookback and thus ignored.
This problem is the most visibly noticed when looking at the volume on a CME futures chart or some equivalent. In a 24 hour market, such as crypto, there are website's like skew can show you the volume disparity from time of day. This led me to believe that the traditional rVol calculation was insufficient. A better way to calculate it would be to compare the 9:30 am 30m bar today to the last week's worth of 9:30 am 30m bars. Then I could know whether today's volume at 9:30 am today is high or low based on prior 9:30 am bars. This seems to be a superior method on an intraday basis and is clearly superior in markets with irregular volume
This led me to other problems, such as markets that are open for less than 24 hours and holiday hours on traditional market exchanges. How can I know that the script is accurately looking at the correct prior relevant bars. I've created and/or adapted solutions to all those problems and these calculations and code snippets thus have value that extend beyond this rVol script for other pinecoders.
The Script
This rVol script looks back at the bars of the same time period on the viewing timeframe. So, as we said, the last 9:30 bars. Averages those, then divides the: . The result is a percentage expressed as x.xxx. Thus 1.0 mean current volume is equal to average volume. Below 1.0 is below the average and above 1.0 is above the average.
This information can be viewed on its own. But there are more levels of analysis added to it.
Above the bars are signals that correlate to the "Better Volume Indicator" developed by, I believe, the folks at emini-watch and originally adapted to pinescript by LazyBear. The interpretation of these symbols are in a table on the right of the indicator.
The volume bars can also be colored. The color is defined by the relationship between the average of the rVol outputs and the current volume. The "Average rVol" so to speak. The color coding is also defined by a legend in the table on the right.
These can be researched by you to determine how to best interpret these signals. I originally got these ideas and solid details on how to use the analysis from a fellow out there, PlanTheTrade.
I hope you find some value in the code and in the information that the indicator presents. And I'd like to thank the TradingView team for producing the most innovative and user friendly charting package on the market.
(p.s. Better Volume is provides better information with a longer lookback value than the default imo)
Credit for certain code sections and ideas is due to:
LazyBear - Better Volume
Grimmolf (From GitHub) - Logic for Loop rVol
R4Rocket - The idea for my rVol 1 calculation
And I can't find the guy who had the idea for the multiples of volume to the average. Tag him if you know him
Final Note: I'd like to leave a couple of clues of my own for fellow seekers of trading infamy.
Indicators: indicators are like anemometers (The things that measure windspeed). People talk bad about them all the time because they're "lagging." Well, you can't tell what the windspeed is unless the wind is blowing. anemometers are lagging indicators of wind. But forecasters still rely on them. You would use an indicator, which I would define as a instrument of measure, to tell you the windspeed of the markets. Conversely, when people talk positively about indicators they say "This one is great and this one is terrible." This is like a farmer saying "Shovels are great, but rakes are horrible." There are certain tools that have certain functions and every good tool has a purpose for a specific job. So the next time someone shares their opinion with you about indicators. Just smile and nod, realizing one day they'll learn... hopefully before they go broke.
How to forecast: Prediction is accomplished by analyzing the behavior of instruments of measure to aggregate data (using your anemometer). The data is then assembled into a predictive model based on the measurements observed (a trading system). That predictive model is tested against reality for it's veracity (backtesting). If the model is predictive, you can optimize your decision making by creating parameter sets around the prediction that are synergistic with the implications of the prediction (risk, stop loss, target, scaling, pyramiding etc).
<3
