RedK_Directional Index / K xDMIHere's a modern take on the famous DMI/ADX. i first wrote this on another platform few years ago, so i'm happy to be able to share it on TradingView
quick refresher: what does DMI/ADX tell us:
------------------------------------------------------
in simple terms, at the core of this indicator, there are 3 main calculations / lines: the Plus Directional Index ( +DI ) which represents how much the bulls are able to push the high of a bar compared to previous one, the Minus Directional Index ( -DI ), showing how much the bears are able to push the low of a bar from previous one, then the Average Directional index ( ADX ) line, which creates an oscillator of the +DI and -DI to represent the strength of a trend -- usually the lines will be colored accordingly (bulls = green, bears = red, and any different color for the ADX )
Similar to my version of the RSI , we take a classic concept, then use the computing and visualization "super powers" available to us today, to extend and improve on what those masters created in the past. I guess they sort of expected us to do exactly that :)
this "extended" version of DMI/ADX provides couple of highly needed features (in my opinion) -- let's explore:
trying as much as possible to avoid jargon - pls forgive me if i failed in some places.
-------------------------------------------------------------------------------------------------
1 - the big change: the ability to visualize the ADX in a way that makes some more sense.
- the original calculation restricted the ADX to oscillate below zero - i'm sure they had a good reason to build it that way in the past - but to me, it becomes super hard to interpret what the ADX line means, especially when a negative trend (the bears) take over. by removing that restriction and allowing the ADX to oscillate up or down (and we're free to do that, so the indicator shows *us* what *we need* to see), we end up with an improved representation of the trend and the trend strength.
- also the original calculation applies a moving average (default 14 bars) of a moving average (another 14 of the Directional Indexes, which represent the strength of bulls vs bears) to calculate the ADX - that makes the ADX very "removed" from the base price values - i change that, and just smooth the initial +Di / -Di then calculate the ADX from there. again, this shows me the outcome of the (relatively) immediate moves.
2 - i use weighted average WMA () in all my averaging calculations .. i believe this type of average is the best to express the importance of recent days / bars vs the ones further in the past, compared to other averaging techniques
3 - ability to make the DMI volume-weighted .. but contrary to my RSI , this is not set by default.
4 - couple of options to view the unrestricted ADX (as an area or as histogram/columns .. which i call Vertical Bars) for improved visualization
other stuff:
5 - a "step" option for the ADX .. you can set the step option to an increment of, say 5 or 10. this is in case you prefer to see the trend more in "quality" terms - so the equivalent of weak, medium, strong, v. strong...etc -- since in reality, a number like 47.7683 doesn't really mean anything specific
6 - optional "strong trend" adjustable level
Settings & usage suggestion:
-----------------------------------
i prefer to use the defaults (length = 7, smoothing = 3, ..etc) -- i believe these are more suitable to the much faster trading that we have now. you can review the comparison chart and see if this works for you, and adjust as you need.
from a "signal" standpoint, you can use the xDMI as you use the classic DMI/ADX, bulls (or bears) are in control when the corresponding DI line crosses the other going up, *AND* moving above the "strong trend" level that you can set as an extra filter (usually a value between 20 to 30), while ADX will show the quality/strength of the trend.
i suggest you also utilize this indicator with other trend / momentum confirmation methods, and additional analysis and not in isolation - as well as inspecting the prevailing / longer time frame to ensure you're acting in the direction of the broader move / trend.
the above chart includes a side-by-side comparison between our new xDMI with the classic DMI/ADX using the same settings - then we add at the bottom panel also the xDMI, but with my default (faster) settings and showing other visualization options that can be utilized - the Moving Averages on the top / price panel is just to help put the price movement into perspective in terms of trend and trend strength.
The code is open and commented - please feel free to use, share, comment & provide feedback. if you're a DMI fan, and you find this useful in your trading, i would be more than happy to hear about it
Good luck!
"墨尔本胜利vs西悉尼流浪者"に関するスクリプトを検索

BEST Engulfing + Breakout StrategyHello traders
This is a simple algorithm for a Tradingview strategy tracking a convergence of 2 unrelated indicators.
Convergence is the solution to my trading problems.
It's a puzzle with infinite possibilities and only a few working combinations.
Here's one that I like
- Engulfing pattern
- Price vs Moving average for detecting a breakout
Definition
Take out the notebooks :) and some coffee (good for focus). I'm bullish in coffee
The engulfing pattern is a two-candle reversal pattern.
The second candle completely ‘engulfs’ the real body of the first one, without regard to the length of the tail shadows.
The bullish Engulfing pattern appears in a downtrend and is a combination of one red candle followed by a larger green candle
The bearish Engulfing pattern appears in a downtrend and is a combination of one green candle followed by a larger red candle
Example: imgur.com
We're bored sir... what's the point of all this?
In summary, an engulfing is a pattern to track reversals. (the whole TradingView audience stands up now giving a standing ovation)
Adding the Price vs Moving average filters allows to track reversals with momentums (half of the audience collapsed because this is too awesome)
Ok sir... you picked up my interest
I included some cool backtest filters:
- date range filtering
- flexible take profit in USD value (plotted in blue)
- flexible stop loss in USD value (plotted in red)
All the best
Dave

BTC Volume absolute (fiat vs Tether vs futures)BTC volume split by fiat, Tether and futures in USD
fiat = COINBASE + BITFLYER + BITSTAMP + KRAKEN
Tether = BITFINEX + BINANCE + HUOBI + HITBTC
futures = BITMEX + BYBIT

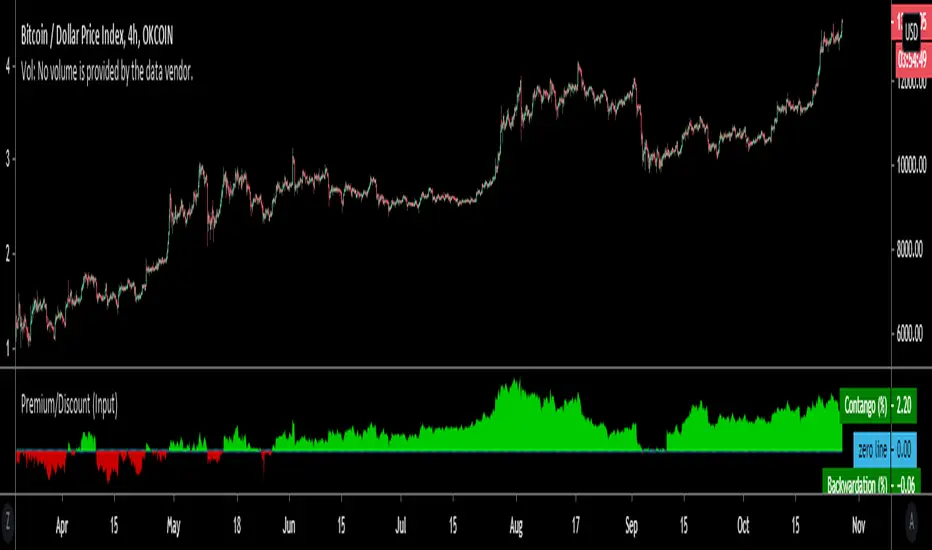
Premium/Discount (Input)Used to show Contango or Backwardation in futures contracts vs spot price. You can input your own tickers so can technically can be used to compare anything.
* In this example I'm showing Okex Quarterly contract vs Okex spot index price because it showcases it better.
* If you are using this after 2019 the default setting will not work because I set it to Bitmex which does not currently have a "current contract in front" ticker available.
It should be fairly self explanatory, but just ask below if you have any questions.
Volume Profile Free Ultra SLI (100 Levels Value Area VWAP) - RRBVolume Profile Free Ultra SLI by RagingRocketBull 2019
Version 1.0
This indicator calculates Volume Profile for a given range and shows it as a histogram consisting of 100 horizontal bars.
This is basically the MAX SLI version with +50 more Pinescript v4 line objects added as levels.
It can also show Point of Control (POC), Developing POC, Value Area/VWAP StdDev High/Low as dynamically moving levels.
Free accounts can't access Standard TradingView Volume Profile, hence this indicator.
There are several versions: Free Pro, Free MAX SLI, Free Ultra SLI, Free History. This is the Free Ultra SLI version. The Differences are listed below:
- Free Pro: 25 levels, +Developing POC, Value Area/VWAP High/Low Levels, Above/Below Area Dimming
- Free MAX SLI: 50 levels, 2x SLI modes for Buy/Sell or even higher res 150 levels
- Free Ultra SLI: 100 levels, packed to the limit, 2x SLI modes for Buy/Sell or even higher res 300 levels
- Free History: auto highest/lowest, historic poc/va levels for each session
Features:
- High-Res Volume Profile with up to 100 levels (line implementation)
- 2x SLI modes for even higher res: 300 levels with 3x vertical SLI, 100 buy/sell levels with 2x horiz SLI
- Calculate Volume Profile on full history
- POC, Developing POC Levels
- Buy/Sell/Total volume modes
- Side Cover
- Value Area, VAH/VAL dynamic levels
- VWAP High/Low dynamic levels with Source, Length, StdDev as params
- Show/Hide all levels
- Dim Non Value Area Zones
- Custom Range with Highlighting
- 3 Anchor points for Volume Profile
- Flip Levels Horizontally
- Adjustable width, offset and spacing of levels
- Custom Color for POC/VA/VWAP levels, Transparency for buy/sell levels
WARNING:
- Compilation Time: 1 min 20 sec
Usage:
- specify max_level/min_level/spacing (required)
- select range (start_bar, range length), confirm with range highlighting
- select volume type: Buy/Sell/Total
- select mode Value Area/VWAP to show corresponding levels
- flip/select anchor point to position the buy/sell levels
- use Horiz Buy/Sell SLI mode with 100 or Vertical SLI with 300 levels if needed
- use POC/Developing POC/VA/VWAP High/Low as S/R levels. Usually daily values from 1-3 days back are used as levels for the current day.
SLI:
use SLI modes to extend the functionality of the indicator:
- Horiz Buy/Sell 2x SLI lets you view 100 Buy/Sell Levels at the same time
- Vertical Max_Vol 3x SLI lets you increase the resolution to 300 levels
- you need at least 2 instances of the indicator attached to the same chart for SLI to work
1) Enable Horiz SLI:
- attach 2 indicator instances to the chart
- make sure all instances have the same min_level/max_level/range/spacing settings
- select volume type for each instance: you can have a buy/sell or buy/total or sell/total SLI. Make sure your buy volume instance is the last attached to be displayed on top of sell/total instances without overlapping.
- set buy_sell_sli_mode to true for indicator instances with volume_type = buy/sell, for type total this is optional.
- this basically tells the script to calculate % lengths based on total volume instead of individual buy/sell volumes and use ext offset for sell levels
- Sell Offset is calculated relative to Buy Offset to stack/extend sell after buy. Buy Offset = Zero - Buy Length. Sell Offset = Buy Offset - Sell Length = Zero - Buy Length - Sell Length
- there are no master/slave instances in this mode, all indicators are equal, poc/va levels are not affected and can work independently, i.e. one instance can show va levels, another - vwap.
2) Enable Vertical SLI:
- attach the first instance and evaluate the full range to roughly determine where is the highest max_vol/poc level i.e. 0..20000, poc is in the bottom half (third, middle etc) or
- add more instances and split the full vertical range between them, i.e. set min_level/max_level of each corresponding instance to 0..10000, 10000..20000 etc
- make sure all instances have the same range/spacing settings
- an instance with a subrange containing the poc level of the full range is now your master instance (bottom half). All other instances are slaves, their levels will be calculated based on the max_vol/poc of the master instance instead of local values
- set show_max_vol_sli to true for the master instance. for slave instances this is optional and can be used to check if master/slave max_vol values match and slave can read the master's value. This simply plots the max_vol value
- you can also attach all instances and set show_max_vol_sli to true in all of them - the instance with the largest max_vol should become the master
Auto/Manual Ext Max_Vol Modes:
- for auto vertical max_vol SLI mode set max_vol_sli_src in all slave instances to the max_vol of the master indicator: "VolumeProfileFree_MAX_RRB: Max Volume for Vertical SLI Mode". It can be tricky with 2+ instances
- in case auto SLI mode doesn't work - assign max_vol_sli_ext in all slave instances the max_vol value of the master indicator manually and repeat on each change
- manual override max_vol_sli_ext has higher priority than auto max_vol_sli_src when both values are assigned, when they are 0 and close respectively - SLI is disabled
- master/slave max_vol values must match on each bar at all times to maintain proper level scale, otherwise slave's levels will look larger than they should relative to the master's levels.
- Max_vol (red) is the last param in the long list of indicator outputs
- the only true max_vol/poc in this SLI mode is the master's max_vol/poc. All poc/va levels in slaves will be irrelevant and are disabled automatically. Slaves can only show VWAP levels.
- VA Levels of the master instance in this SLI mode are calculated based on the subrange, not the whole range and may be inaccurate. Cross check with the full range.
WARNING!
- auto mode max_vol_sli_src is experimental and may not work as expected
- you can only assign auto mode max_vol_sli_src = max_vol once due to some bug with unhandled exception/buffer overflow in Tradingview. Seems that you can clear the value only by removing the indicator instance
- sometimes you may see a "study in error state" error when attempting to set it back to close. Remove indicator/Reload chart and start from scratch
- volume profile may not finish to redraw and freeze in an ugly shape after an UI parameter change when max_vol_sli_src is assigned a max_vol value. Assign it to close - VP should redraw properly, but it may not clear the assigned max_vol value
- you can't seem to be able to assign a proper auto max_vol value to the 3rd slave instance
- 2x Vertical SLI works and tested in both auto/manual, 3x SLI - only manual seems to work (you can have a mixed mode: 2nd instance - auto, 3rd - manual)
Notes:
- This code uses Pinescript v3 compatibility framework
- This code is 20x-30x faster (main for cycle is removed) especially on lower tfs with long history - only 4-5 sec load/redraw time vs 30-60 sec of the old Pro versions
- Instead of repeatedly calculating the total sum of volumes for the whole range on each bar, vol sums are now increased on each bar and passed to the next in the range making it a per range vs per bar calculation that reduces time dramatically
- 100 levels consist of 50 main plot levels and 50 line objects used as alternate levels, differences are:
- line objects are always shown on top of other objects, such as plot levels, zero line and side cover, it's not possible to cover/move them below.
- all line objects have variable lengths, use actual x,y coords and don't need side cover, while all plot levels have a fixed length of 100 bars, use offset and require cover.
- all key properties of line objects, such as x,y coords, color can be modified, objects can be moved/deleted, while this is not possible for static plot levels.
- large width values cause line objects to expand only up/down from center while their length remains the same and stays within the level's start/end points similar to an area style.
- large width values make plot levels expand in all directions (both h/v), beyond level start/end points, sometimes overlapping zero line, making them an inaccurate % length representation, as opposed to line objects/plot levels with area style.
- large width values translate into different widths on screen for line objects and plot levels.
- you can't compensate for this unwanted horiz width expansion of plot levels because width uses its own units, that don't translate into bars/pixels.
- line objects are visible only when num_levels > 50, plot levels are used otherwise
- Since line objects are lines, plot levels also use style line because other style implementations will break the symmetry/spacing between levels.
- if you don't see a volume profile check range settings: min_level/max_level and spacing, set spacing to 0 (or adjust accordingly based on the symbol's precision, i.e. 0.00001)
- you can view either of Buy/Sell/Total volumes, but you can't display Buy/Sell levels at the same time using a single instance (this would 2x reduce the number of levels). Use 2 indicator instances in horiz buy/sell sli mode for that.
- Volume Profile/Value Area are calculated for a given range and updated on each bar. Each level has a fixed length. Offsets control visible level parts. Side Cover hides the invisible parts.
- Custom Color for POC/VA/VWAP levels - UI Style color/transparency can only change shape's color and doesn't affect textcolor, hence this additional option
- Custom Width - UI Style supports only width <= 4, hence this additional option
- POC is visible in both modes. In VWAP mode Developing POC becomes VWAP, VA High and Low => VWAP High and Low correspondingly to minimize the number of plot outputs
- You can't change buy/sell level colors from input (only transparency) - this requires 2x plot outputs => 2x reduces the number of levels to fit the max 64 limit. That's why 2 additional plots are used to dim the non Value Area zones
- You can change level transparency of line objects. Due to Pinescript limitations, only discrete values are supported.
- Inverse transp correlation creates the necessary illusion of "covered" line objects, although they are shown on top of the cover all the time
- If custom lines_transp is set the illusion will break because transp range can't be skewed easily (i.e. transp 0..100 is always mapped to 100..0 and can't be mapped to 50..0)
- transparency can applied to lines dynamically but nva top zone can't be completely removed because plot/mixed type of levels are still used when num_levels < 50 and require cover
- transparency can't be applied to plot levels dynamically from script this can be done only once from UI, and you can't change plot color for the past length bars
- All buy/sell volume lengths are calculated as % of a fixed base width = 100 bars (100%). You can't set show_last from input to change it
- Range selection/Anchoring is not accurate on charts with time gaps since you can only anchor from a point in the future and measure distance in time periods, not actual bars, and there's no way of knowing the number of future gaps in advance.
- Adjust Width for Log Scale mode now also works on high precision charts with small prices (i.e. 0.00001)
- in Adjust Width for Log Scale mode Level1 width extremes can be capped using max deviation (when level1 = 0, shift = 0 width becomes infinite)
- There's no such thing as buy/sell volume, there's just volume, but for the purposes of the Volume Profile method, assume: bull candle = buy volume, bear candle = sell volume
P.S. I am your grandfather, Luke! Now, join the Dark Side in your father's steps or be destroyed! Once more the Sith will rule the Galaxy, and we shall have peace...

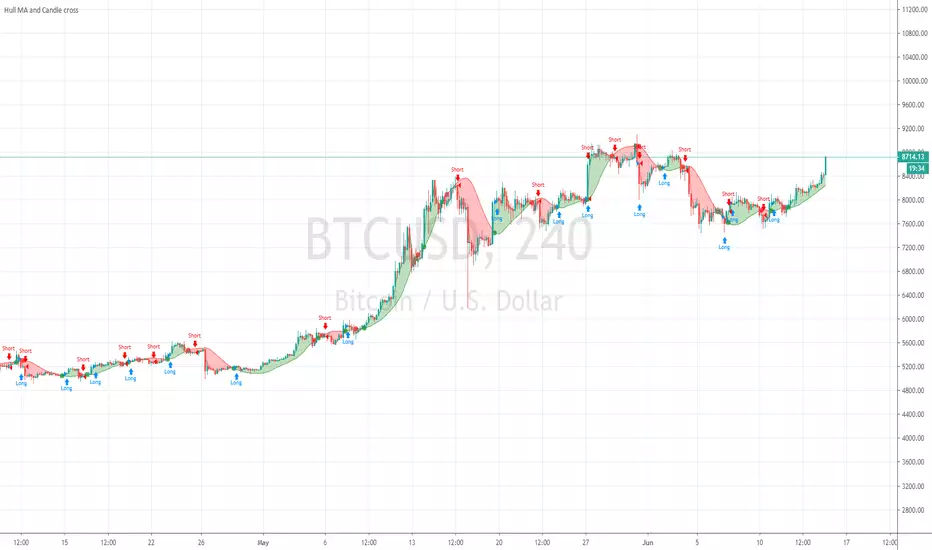
Hull MA and Candle crossHull MA vs price cossover . not 2 Hull MA's crossing, and also a price vs previous price crossover :
current price higher than previous = buy
current price lower than previous = sell
Price value set to OPEN to avoid repaint during candle
Volume Profile Free MAX SLI (50 Levels Value Area VWAP) by RRBVolume Profile Free MAX SLI by RagingRocketBull 2019
Version 1.0
All available Volume Profile Free MAX SLI versions are listed below (They are very similar and I don't want to publish them as separate indicators):
ver 1.0: style columns implementation
ver 2.0: style histogram implementation
ver 3.0: style line implementation
This indicator calculates Volume Profile for a given range and shows it as a histogram consisting of 50 horizontal bars.
It can also show Point of Control (POC), Developing POC, Value Area/VWAP StdDev High/Low as dynamically moving levels.
Free accounts can't access Standard TradingView Volume Profile, hence this indicator.
There are several versions: Free Pro, Free MAX SLI, Free History. This is the Free MAX SLI version. The Differences are listed below:
- Free Pro: 25 levels, +Developing POC, Value Area/VWAP High/Low Levels, Above/Below Area Dimming
- Free MAX SLI: 50 levels, packed to the limit, 2x SLI modes for Buy/Sell or even higher res 150 levels
- Free History: auto highest/lowest, historic poc/va levels for each session
Features:
- High-Res Volume Profile with up to 50 levels (3 implementations)
- 20-30x faster than the old Pro versions especially on lower tfs with long history
- 2x SLI modes for even higher res: 150 levels with 3x vertical SLI, 50 buy/sell levels with 2x horiz SLI
- Calculate Volume Profile on full history
- POC, Developing POC Levels
- Buy/Sell/Total volume modes
- Side Cover
- Value Area, VAH/VAL dynamic levels
- VWAP High/Low dynamic levels with Source, Length, StdDev as params
- Show/Hide all levels
- Dim Non Value Area Zones
- Custom Range with Highlighting
- 3 Anchor points for Volume Profile
- Flip Levels Horizontally
- Adjustable width, offset and spacing of levels
- Custom Color for POC/VA/VWAP levels and Transparency for buy/sell levels
Usage:
- specify max_level/min_level/spacing (required)
- select range (start_bar, range length), confirm with range highlighting
- select volume type: Buy/Sell/Total
- select mode Value Area/VWAP to show corresponding levels
- flip/select anchor point to position the buy/sell levels
- use Horiz SLI mode for 50 Buy/Sell or Vertical SLI for 150 levels if needed
- use POC/Developing POC/VA/VWAP High/Low as S/R levels. Usually daily values from 1-3 days back are used as levels for the current day.
SLI:
- use SLI modes to extend the functionality of the indicator:
- Horiz Buy/Sell 2x SLI lets you view 50 Buy/Sell Levels at the same time
- Vertical Max_Vol 3x SLI lets you increase the resolution to 150 levels
- you need at least 2 instances of the indicator attached to the same chart for SLI to work
1) Enable Horiz SLI:
- attach 2 indicator instances to the chart
- make sure all instances have the same min_level/max_level/range/spacing settings
- select volume type for each instance: you can have a buy/sell or buy/total or sell/total SLI. Make sure your buy volume instance is the last attached to be displayed on top of sell/total instances without overlapping.
- set buy_sell_sli_mode to true for indicator instances with volume_type = buy/sell, for type total this is optional.
- this basically tells the script to calculate % lengths based on total volume instead of individual buy/sell volumes and use ext offset for sell levels
- Sell Offset is calculated relative to Buy Offset to stack/extend sell after buy. Buy Offset = Zero - Buy Length. Sell Offset = Buy Offset - Sell Length = Zero - Buy Length - Sell Length
- there are no master/slave instances in this mode, all indicators are equal, poc/va levels are not affected and can work independently, i.e. one instance can show va levels, another - vwap.
2) Enable Vertical SLI:
- attach the first instance and evaluate the full range to roughly determine where is the highest max_vol/poc level i.e. 0..20000, poc is in the bottom half (third, middle etc) or
- add more instances and split the full vertical range between them, i.e. set min_level/max_level of each corresponding instance to 0..10000, 10000..20000 etc
- make sure all instances have the same range/spacing settings
- an instance with a subrange containing the poc level of the full range is now your master instance (bottom half). All other instances are slaves, their levels will be calculated based on the max_vol/poc of the master instance instead of local values
- set show_max_vol_sli to true for the master instance. for slave instances this is optional and can be used to check if master/slave max_vol values match and slave can read the master's value. This simply plots the max_vol value
- you can also attach all instances and set show_max_vol_sli to true in all of them - the instance with the largest max_vol should become the master
Auto/Manual Ext Max_Vol Modes:
- for auto vertical max_vol SLI mode set max_vol_sli_src in all slave instances to the max_vol of the master indicator: "VolumeProfileFree_MAX_RRB: Max Volume for Vertical SLI Mode". It can be tricky with 2+ instances
- in case auto SLI mode doesn't work - assign max_vol_sli_ext in all slave instances the max_vol value of the master indicator manually and repeat on each change
- manual override max_vol_sli_ext has higher priority than auto max_vol_sli_src when both values are assigned, when they are 0 and close respectively - SLI is disabled
- master/slave max_vol values must match on each bar at all times to maintain proper level scale, otherwise slave's levels will look larger than they should relative to the master's levels.
- Max_vol (red) is the last param in the long list of indicator outputs
- the only true max_vol/poc in this SLI mode is the master's max_vol/poc. All poc/va levels in slaves will be irrelevant and are disabled automatically. Slaves can only show VWAP levels.
- VA Levels of the master instance in this SLI mode are calculated based on the subrange, not the whole range. Cross check with the full range.
WARNING!
- auto mode max_vol_sli_src is experimental and may not work as expected
- you can only assign auto mode max_vol_sli_src = max_vol once due to some bug with unhandled exception/buffer overflow in Tradingview. Seems that you can clear the value only by removing the indicator instance
- sometimes you may see a "study in error state" error when attempting to set it back to close. Remove indicator/Reload chart and start from scratch
- volume profile may not finish to redraw and freeze in an ugly shape after an UI parameter change when max_vol_sli_src is assigned a max_vol value. Assign it to close - VP should redraw properly, but it may not clear the assigned max_vol value
- you can't seem to be able to assign a proper auto max_vol value to the 3rd slave instance
- 2x Vertical SLI works and tested in both auto/manual, 3x SLI - only manual seems to work
Notes:
- This code is 20x-30x faster (main for cycle is removed) especially on lower tfs with long history - only 2-3 sec load/redraw time vs 30-60 sec of the old Pro versions
- Instead of repeatedly calculating the total sum of volumes for the whole range on each bar, vol sums are now increased on each bar and passed to the next in the range making it a per range vs per bar calculation that reduces time dramatically
- hist_base for levels still results is ugly redraw
- if you don't see a volume profile check range settings: min_level/max_level and spacing, set spacing to 0 (or adjust accordingly based on the symbol's precision, i.e. 0.00001)
- you can view either of Buy/Sell/Total volumes, but you can't display Buy/Sell levels at the same time using a single instance (this would 2x reduce the number of levels). Use 2 indicator instances in horiz buy/sell sli mode for that.
- Volume Profile/Value Area are calculated for a given range and updated on each bar. Each level has a fixed length. Offsets control visible level parts. Side Cover hides the invisible parts.
- Custom Color for POC/VA/VWAP levels - UI Style color/transparency can only change shape's color and doesn't affect textcolor, hence this additional option
- Custom Width - UI Style supports only width <= 4, hence this additional option
- POC is visible in both modes. In VWAP mode Developing POC becomes VWAP, VA High and Low => VWAP High and Low correspondingly to minimize the number of plot outputs
- You can't change buy/sell level colors from input (only plot transparency) - this requires 2x plot outputs => 2x reduces the number of levels to fit the max 64 limit. That's why 2 additional plots are used to dim the non Value Area zones
- All buy/sell volume lengths are calculated as % of a fixed base width = 100 bars (100%). You can't set show_last from input to change it
- There's no such thing as buy/sell volume, there's just volume, but for the purposes of the Volume Profile method, assume: bull candle = buy volume, bear candle = sell volume
P.S. Gravitonium Levels Are Increasing. Unobtainium is nowhere to be found!
Links on Volume Profile and Value Area calculation and usage:
www.tradingview.com
stockcharts.com
onlinelibrary.wiley.com

Bitfinex Margin ComparisonDisplays the RSI of Longs vs Shorts from Bitfinex for most majors ( BTC , ETH, LTC, XRP, EOS, NEO).
Displays RSI of both longs and shorts to gauge the short term momentum of both while also showing the ratio of Longs vs Shorts as the background.

Premium ComparisonScript to display futures premium/discount vs basis; uses Bitmex XBTUSD 10.99% as basis vs XBTM18 and XBTU18 futures , but these are configurable.

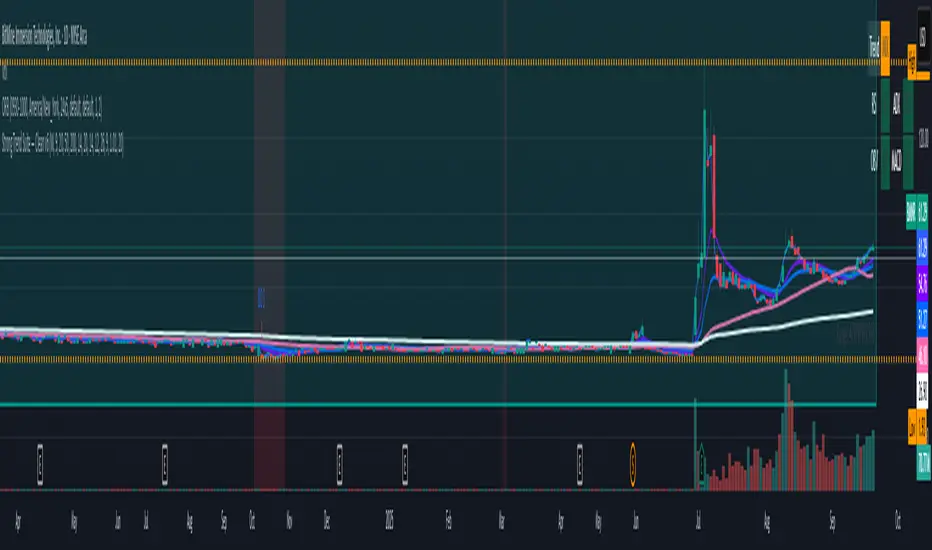
ST_Trend_ReversalSTRONG TREND REVERSAL INDICATOR
The code is the percentage difference between the spot price of a given financial asset and its 200-day MA of that period. My standard setup is Daily, and I think it's got very good predictive power at that timeframe.
It can be read in two ways:
1. Values extremely above or below the 200-period MA present chances of buying/selling agains the prevailing trend.
2. Values closely above or below the 200-period MA are make-or-break market periods, where a medium-term trend becomes evident. Breaks above or below the MA are associated with strong chances of directional movements. But it's not fool-proof as false breaks have become commonplace nowadays.
Other way to use it is as confirmation of breakdowns: For example, an asset that loses its 200-day MA and then can't rally above it becomes exposed to steep losses afterwards.
It's also helpful to use in volatility trading: the closer the asset goes to its MA, the lower goes implied vol, and thus better opportiunities to be long volatility on those occasions where direction is hard to predict.
STRI = close/(200dMA)
Values over 100 indicate percentage premiums of spot vs its moving average.
Values below indicate percentage discounts of spot vs its moving average.

Ersoy-intersection(Kesisme)-Update-1website: www.ersoytoptas.com
Newspaper : tr.investing.com
hi , Friends
i wanna be someone who wants to help everyone
updated my script he published some time ago.
What happened?
* intersection When ever Bar Color Yellow Be
* Alarms to be more comprehensible
* Short and Long Days Choosing a Opportunities
* Source Opportunities
All Charts Usable( Example ;15,30,60 ... vs) and ALL MARKETS ( Stocks , forex , ... vs)
i strive to improve further
Easy to get

INFLECTION NEXUS - SPAINFLECTION NEXUS - SPA (Shadow Portfolio Adaptive)
Foreword: The Living Algorithm
For decades, technical analysis has been a conversation between a trader and a static chart. We apply our indicators with their fixed-length inputs, and we hope that our rigid tools can somehow capture the essence of a market that is fluid, chaotic, and perpetually evolving. When our tools fail, we are told to "adapt." But what if the tools themselves could learn that lesson? What if our indicators could adapt not just for us, but with us?
This script, INFLECTION NEXUS - SPA, is the realization of that vision. It is an advanced analytical framework built around a revolutionary core: the Shadow Portfolio Adaptive (SPA) Engine . The buy and sell signals you see on the chart are an evolution of the logic from my previous work, "Turning Point." However, this is not a simple combination of two scripts. The SPA engine so fundamentally transforms the nature of the analysis that it creates an entirely new class of indicator. This publication is a showcase of that groundbreaking, self-learning engine.
This system is undeniably complex. When you first load it, the sheer volume of information may feel overwhelming. That is a testament to the depth of its analysis. This guide is designed to be your comprehensive manual, to break down every single component, every color, every number, into simple, understandable concepts. By the end of this document, you will not only master its functions but will also possess a deeper understanding of the market dynamics it is designed to reveal.
Chapter 1: The Paradigm Shift - Why the SPA Engine is a Leap Forward
To grasp the innovation here, we must first deconstruct the severe limitations of traditional "adaptive" indicators.
Part A: The Traditional Model - Driving by the Rear-View Mirror
Conventional "adaptive" systems are fundamentally reactive. They operate on a slow, inefficient loop: they wait for their own specific, biased signal to fire, wait for that trade to close, and only after a long and statistically significant "warm-up" period of 50-100 trades do they finally make a small, retrospective adjustment. They are always adapting to a market that no longer exists.
Part B: The SPA Model - The Proactive Co-Pilot
The Shadow Portfolio Adaptive (SPA) engine is a complete re-imagining of this process. It is not reactive; it is proactive, data-saturated, and instantly aware.
Continuous, Unbiased Learning: The SPA engine does not wait for a signal to learn. Its Shadow Portfolio is constantly running 5-bar long and short trades in the background. It learns from every single 5-bar slice of market action , giving it a continuous, unbiased stream of performance data. It is the difference between reading a textbook chapter and having a live sparring partner in the ring 24/7.
Instantaneous Market Awareness - The End of the "Warm-Up": This is the critical innovation. The SPA engine does not require a 100-trade warm-up period. The learning does not start after 50 trades; it begins on the 6th bar of the chart when the first shadow trade closes. From that moment on, the system is market-aware, analyzing data, and capable of making intelligent adjustments. The SPA engine is not adapting to old wins and losses. It is adapting, in near real-time, to the market's ever-shifting character, volatility, and personality.
Chapter 2: The Anatomy of the SPA Engine - A Granular Deep Dive
The engine is composed of three primary systems that work in a sophisticated, interconnected symphony.
Section 1: The Shadow Portfolio (The Information Harvester)
What it is, Simply: Think of this as the script's eyes and ears. It's a team of 10 virtual traders (5 long, 5 short) who are constantly taking small, quick trades to feel out the market.
How it Works, Simply: On every new bar, a new "long" trader and a new "short" trader enter the market. Exactly 5 bars later, they close their positions. This cycle is perpetual and relentless.
The Critical 'Why': Because these virtual traders enter and exit based on a fixed time (5 bars), not on a "good" or "bad" signal, their results are completely unbiased . They are simply measuring: "What happened to price over the last 5 bars?" This provides the raw, untainted truth about the market's behavior that the rest of the system needs to learn effectively.
The Golden Metric (ATR Normalization): The engine doesn't just look at dollar P&L. It's smarter than that. It asks a more intelligent question: "How much did this trade make relative to the current volatility?"
Analogy: Imagine a flea and an elephant. If they both jump 1 inch, who is more impressive? The flea. The SPA engine understands this. A $10 profit when the market is dead quiet is far more significant than a $10 profit during a wild, volatile swing.
The Formula: realized_atr = (close - trade.entry) / trade.atr_entry. It takes the raw profit and divides it by the Average True Range (a measure of volatility) at the moment of entry. This gives a pure, "apples-to-apples" score for every single trade, which is the foundational data point for all learning.
Section 2: The Cognitive Map (The Long-Term Brain)
What it is, Simply: This is the engine's deep memory, its library of experiences. Imagine a giant, 64-square chessboard (8x8 grid). Each square on the board represents a very specific type of market environment.
The Two Dimensions of Thought (The 'How'): How does it know which square we are on? It looks at two things:
The Market's Personality (X-Axis): Is the market behaving like a disciplined soldier, marching in a clear trend? Or is it like a chaotic, unpredictable child, running all over the place? The engine calculates a "Regime" score to figure this out.
The Market's Energy Level (Y-Axis): Is the market sleepy and quiet, or is it wide-awake and hyperactive? The engine measures "Normalized Volatility" to determine this.
The Power of Generalization (The 'Why'): When a Shadow Portfolio trade closes, its result is recorded in the corresponding square on the chessboard. But here's the clever part: it also shares a little bit of that lesson with the squares immediately next to it (using a Gaussian Kernel).
Analogy: If you touch a hot stove and learn "don't touch," your brain is smart enough to know you probably shouldn't touch the hot oven door next to it either, even if you haven't touched it directly. The Cognitive Map does the same thing, allowing it to make intelligent inferences even in market conditions it has seen less frequently. Each square remembers what indicator settings worked best in that specific environment.
Section 3: The Adaptive Engine (The Central Nervous System)
What it is, Simply: This is the conductor of the orchestra. It takes information from all other parts of the system and decides exactly what to do.
The Symphony of Inputs: It listens to three distinct sources of information before making a decision:
The Short-Term Memory (Rolling Stats): It looks at the performance of the last rollN shadow trades. This is its immediate, recent experience.
The Long-Term Wisdom (Cognitive Map): It consults the grand library of the Cognitive Map to see what has worked best in the current market type over the long haul.
The Gut Instinct (Bin Learning): It keeps a small "mini-batch" of the most recent trades. If this batch shows a very strong, sudden pattern, it can trigger a rapid, reflexive adjustment, like pulling your hand away from a flame.
The Fusion Process: It then blends these three opinions together in a sophisticated way. It gives more weight to the opinions it's more confident in (e.g., a Cognitive Map square with hundreds of trades of experience) and uses your Adaptation Intensity (dialK) input to decide how much to listen to its "gut instinct." The final decision is then smoothed to ensure the indicator's parameters change in a stable, intelligent way.
Chapter 3: The Control Panel - A Novice's Guide to Every Input
This is the most important chapter. Let's break down what these confusing settings actually do in the simplest terms possible.
--- SECTION 1: THE DRIVER'S SEAT (SIGNAL ENGINE & BASE SETTINGS) ---
🧾 Signal Engine (Turning Point):
What it is: These are the rules for the final BUY and SELL signs.
Think of it like this: The SPA engine is the smart robot that tunes your race car. These settings are you, the driver, telling the robot what kind of race you're in.
Enable Reversal Mode: You tell the robot, "I want to race on a curvy track with lots of turns." The robot will tune the car to be agile for catching tops and bottoms.
Enable Breakout Mode: You tell the robot, "I want to race on a long, straight track." The robot will tune the car for pure speed to follow the trend.
Require New Extreme: This is a quality filter. It tells the driver, "Don't look for a turn unless we've just hit a new top speed on the straightaway." It makes sure the reversal is from a real extreme.
Min Bars Between Signals: This is the "pit stop" rule. You're telling the robot, "After you show me a sign, wait at least 10 bars before showing another one, so I don't get confused."
⚡ ATR Bands (Base Inputs):
What they are: These are the starting settings for your car before the robot starts tuning it. These are your factory defaults.
Sensitivity: This is the "Bump Detector." A low number means the car feels every tiny pebble on the road. A high number means it only notices the big speed bumps. You want to set it so it notices the important bumps (real market structure) but ignores the pebbles (noise).
ATR Period & Multiplier: These set the starting size of the "safety lane" (the green and blue bands) around your car. The robot's main job is to constantly adjust the size of this safety lane to perfectly fit the current road conditions.
📊 & 📈 Filter Settings (RSI & Volume):
What they are: These are your co-pilot's confirmation checks.
Enable RSI Filter: Your co-pilot will check the "Engine Temperature" (RSI). He won't let you hit the gas (BUY) if the engine is already overheating (overbought).
RSI Length & Lookbacks: These tune how your co-pilot's temperature gauge works. The defaults are standard.
Require Volume Spike: Your co-pilot will check the "Crowd Noise" (Volume). He won't give you a signal unless he hears the crowd roar, confirming that a lot of people are interested in this move.
🎯 Signal Quality Control:
Enable Major Levels Only: This tells your co-pilot to be extra picky. He will only confirm signals that happen after a huge, powerful move, ignoring all the small stuff.
--- SECTION 2: THE ROBOT'S BRAIN (ENGINE & LEARNING CONTROLS) ---
🎛️ Master Control:
Adaptation Intensity (dialK): THIS IS THE ROBOT'S PERSONALITY DIAL.
Turn it DOWN (1-5): The robot becomes a "Wise Old Professor." It thinks very slowly and carefully, gathers lots of data, and only makes a change when it is 100% sure. Its advice is very reliable but might come a little late.
Turn it UP (15-20): The robot becomes a "Hyper-Reactive Teenager." It has a short attention span, reacts instantly to everything it sees, and changes its mind constantly. It's super-fast to new information but might get faked out a lot.
The Default (10): A "Skilled Professional." The perfect balance of thoughtful and responsive. Start here.
🧠 Adaptive Engine:
Enable Adaptive System: This is the main power button for your robot. Turn it off, and you're driving a normal, non-smart car. Turn it on, and the robot takes over the tuning.
Use Shadow Cycle: This turns on the robot's "practice laps." The robot can't learn without practicing. This must be on for the robot to work.
Lock ATR Bands: This is a visual choice. "Locked" means the safety lanes on your screen stay where your factory defaults put them (the robot still makes changes to the signals in the background). "Unlocked" means you see the safety lanes moving and changing shape in real-time as the robot tunes them.
🎯 Learning (Global + Risk):
What they are: These are the deep-level settings for how your robot's brain processes information.
Rolling Window Size: This is the robot's "Short-Term Memory." How many of the last few practice laps should it remember? A small number means it only cares about what just happened. A big number means it remembers the last hour of practice.
Learn Rate & Smooth Alpha: This is "How big of a change should the robot make?" and "How smoothly should it make the change?" Think of it as turning the steering wheel. A high learn rate is like yanking the wheel; a low one is like a gentle turn. The smoothing makes sure the turn is graceful.
WinRate Thresholds & PnL Cap: These are rules for the robot's learning. They tell it what a "good" or "bad" outcome looks like and tell it to ignore crazy, once-in-a-lifetime events so its memory doesn't get corrupted.
--- SECTION 3: THE GARAGE (RISK, MEMORY & VISUALS) ---
⚠️ Risk Management:
What they are: These are safety rules you can give to your co-pilot for your own awareness. They appear on the dashboard.
The settings: You can set a max number of trades, a max loss for the day, and a "time out" period after a few losses.
Apply Risk to Shadow: This is an important switch. If you turn this ON, your safety rules also apply to the robot's practice laps. If you hit your max loss, the robot stops practicing and learning. It's recommended to leave this OFF so the robot can learn 24/7, even if you have stopped trading.
🗺️ Cognitive Map, STM & Checkpoints:
What it is: The robot's "Long-Term Memory" or its entire library of racing experience.
Use Cognitive Map & STM: These switches turn on the long-term and short-term memory banks. You want these on for the smartest robot.
Map Settings (Grid, Sigma, Half-Life): These are very advanced settings for neuroscientists. They control how the robot's brain is structured and how it forgets old information. The defaults are expertly tuned.
The Checkpoint System: This is the "Save Your Game" button for the robot.
To Save: Check Emit Checkpoint Now. Go to your alert log, and you will see a very long password. Copy this password.
To Load: Paste that password into the Memory Checkpoint box. Then, check Apply Checkpoint On Next Bar. The robot will instantly download all of its saved memories and experience.
🎨 Visuals & 🧩 Display Params:
What they are: These are all about how your screen looks.
You can control everything: The size and shape of the little diamonds (Entry Orbs), whether you see the purple Adapt Pulse, and where the Dashboards appear on your screen. You can change the Theme to Dark, Light, or Neon. These settings don't change how the robot thinks, only how it presents its information to you.
Chapter 4: The Command Center - Decoding the Dashboard
PANEL A (INFLECTION NEXUS): Your high-level mission control, showing the engine's classification of the current Market Context and the performance summary of the Shadow Portfolio.
PANEL B (SHADOW PORTFOLIO ADAPTIVE): Your deep diagnostic screen.
Performance Metrics: View advanced risk-adjusted stats like the Sharpe Ratio to understand the quality of the market movements the engine is learning from.
Adaptive Parameters (Live vs Base): THIS IS THE MOST CRITICAL SECTION. It shows the engine's Live parameters right next to your (Base) inputs. When the Live values deviate, the engine is communicating its learned wisdom to you. For example, a Live ATR Multiplier of 2.5 versus your Base of 1.4 is the engine telling you: "Caution. The market is currently experiencing high fake-outs and requires giving positions more room to breathe." This section is a direct translation of the engine's learning into actionable insight.
Chapter 5: Reading the Canvas - On-Chart Visuals
The Bands (Green/Blue Lines): These are not static Supertrend lines. They are the physical manifestation of the engine's current thinking. As the engine learns and adapts its ATR Period and Multiplier, you will see these bands widen, tighten, and adjust their distance from price. They are alive.
The Labels (BUY/SELL): These are the final output of the "Turning Point" logic, now supercharged and informed by the fully adaptive SPA engine.
The Purple Pulse (Dot and Background Glow): This is your visual cue that the engine is "thinking." Every time you see this pulse, it means the SPA has just completed a learning cycle and updated its parameters. It is actively recalibrating itself to the market.
Chapter 6: A Manifesto on Innovation and Community
I want to conclude with a personal note on why I dedicate countless hours to building systems like this and sharing them openly.
My purpose is to drive innovation, period. I am not in this space to follow the crowd or to re-package old ideas. The world does not need a 100th version of a slightly modified MACD. Real progress, real breakthroughs, come from venturing into the wilderness, from asking "what if?" and from pursuing concepts that lie at the very edge of possibility.
I am not afraid of being wrong. I am not afraid of being bested by my peers. In fact, I welcome it. If another developer takes an idea from this engine, improves it, and builds something even more magnificent, that is a profound win for our entire community. The only failure I recognize is the failure to try. The only trap I fear is the creative complacency of producing sterile, recycled work just to appease the status quo.
I love this community, and I believe with every fiber of my being that we have barely scratched the surface of what can be discovered and created. This script is my contribution to that shared journey. It is a tool, an idea, and a challenge to all of us: let's keep pushing.
DISCLAIMER: This script is an advanced analytical tool provided for educational and research purposes ONLY. It does not constitute financial advice. All trading involves substantial risk of loss. Past performance is not indicative of future results. Please use this tool responsibly and as part of a comprehensive trading plan.
As the great computer scientist Herbert A. Simon, a pioneer of artificial intelligence, famously said:
"Learning is any process by which a system improves performance from experience."
*Tooltips were updated with a comprehensive guide
May this engine enhance your experience.
— Dskyz, for DAFE Trading Systems

Simple Turnover (Enhanced v2)📊 Simple Turnover (Enhanced)
🔹 Overview
The Simple Turnover Indicator calculates a stock’s turnover by combining both price and volume, and then compares it against quarterly highs. This helps traders quickly gauge whether market participation in a move is strong enough to confirm a breakout, or weak and likely to be false.
Unlike volume alone, turnover considers both traded volume and price level, giving a truer reflection of capital flow in/out of a stock.
________________________________________
🔹 Formulae Used
1. Average Price (SMA)
AvgPrice=SMA(Close,n)
2. Average Volume (SMA)
AvgVol=SMA(Volume,n)
3. Turnover (Raw)
Turnover raw=AvgPrice × AvgVol
4. Unit Adjustment
• If Millions → Turnover = Turnover raw × 10^−6
• If Crores → Turnover = Turnover raw × 10^−7
• If Raw → Turnover = Turnover raw
5. Quarterly High Turnover (qHigh)
Within each calendar quarter (Jan–Mar, Apr–Jun, Jul–Sep, Oct–Dec), we track the maximum turnover seen:
qHigh=max (Turnover within current quarter)
________________________________________
🔹 Visualization
• Bars → Color follows price candle:
o Green if Close ≥ Open
o Red if Close < Open
• Blue Line → Rolling Quarterly High Turnover (qHigh)
________________________________________
🔹 Strategy Use Case
The Simple Turnover Indicator is most effective for confirming true vs false breakouts.
• A true breakout should be supported by increasing turnover, showing real capital backing the move.
• A false breakout often occurs with weak or declining turnover, suggesting lack of conviction.
📌 Example Strategy (3H timeframe):
1. Identify a demand zone using your preferred supply-demand indicator.
2. From this demand zone, monitor turnover bars.
3. A potential long entry is validated when:
o The current turnover bar is at least 20% higher than the previous one or two bars.
o Example setting: SMA length = 5 (i.e., turnover = 5-bar average close × 5-bar average volume).
4. This confirms strong participation in the move, increasing probability of a sustained breakout.
________________________________________
🔹 Disclaimer
⚠️ This indicator/strategy does not guarantee 100% accurate results.
It is intended to improve the probability of identifying true breakouts.
The actual success of the strategy will depend on price action, market momentum, and prevailing market conditions.
Always use this as a supporting tool along with broader trading analysis and risk management.

Market Breadth: VOLD Ratios VOLD for multiple markets - essential for 0DTE trading to see trending vs choppy days

Multi-Symbol RSI/ADX Monitor# 📊 Multi-Symbol RSI/ADX Monitor + EMA Trend Analyzer
### 🔹 Smart Trend Analyzer with Golden/Death Cross Signals + Multi-Symbol Scanner
---
## 📌 Overview
The **Multi-Symbol RSI/ADX Monitor + EMA Trend Analyzer** combines **trend detection**, **crossover signals**, and a **multi-asset strength scanner** into a single tool.
- 🔹 **EMA Trend Analyzer** → Detects strong/weak bullish & bearish phases based on price vs EMAs, slope, and crossovers.
- 🔹 **RSI/ADX Scanner** → Monitors up to **10 custom tickers** in a dynamic table for relative strength & momentum.
- 🔹 **Alerts** → Catch **Strong Trends** or **Golden/Death Crosses** instantly.
Perfect for traders who want to track **trend bias** on their main chart while scanning **other assets for confirmation**.
---
## ✨ Key Features
### 🔹 EMA Trend Analyzer
- ✅ Plots **Fast EMA (20)** & **Slow EMA (50)**.
- ✅ Main **Trend EMA (100)** with slope confirmation.
- ✅ Detects **5 Market States**:
- 🟢 Strong Bullish (Green)
- 🟢 Moderate Bullish (Lime)
- 🟠 Moderate Bearish (Orange)
- 🔴 Strong Bearish (Red)
- ⚪ Neutral / Sideways (Gray)
- ✅ Highlights **Golden Cross** & **Death Cross**:
- 🎯 Golden Cross → Fast EMA crosses above Slow EMA (Green dot + label)
- 🎯 Death Cross → Fast EMA crosses below Slow EMA (Red dot + label)
- ✅ Dynamic **trend label** on the right edge (shows trend + crossover info).
- ✅ Optional **background shading** by trend strength.
---
### 🔹 Multi-Symbol RSI/ADX Monitor
- ✅ Track up to **10 tickers** simultaneously.
- ✅ Calculates **RSI & ADX** per symbol on the current chart’s timeframe.
- ✅ **Table display** with flexible position (top, middle, bottom).
- ✅ Highlights assets meeting both **RSI ≥ Threshold** & **ADX ≥ Threshold**.
- ✅ Handles empty slots gracefully → `"No symbols selected"`.
---
### 🔹 Alerts
- 📢 **Strong Bullish Trend**
- 📢 **Strong Bearish Trend**
- 📢 **Golden Cross (EMA Fast > Slow)**
- 📢 **Death Cross (EMA Fast < Slow)**
---
## 📖 How to Use
1. **EMA Analyzer**
- Enable *“Show Trend Direction”* to see EMA-based market bias.
- Look for **color-coded labels** & **background shading** to guide bias.
- Watch for **Golden/Death Cross dots** as entry/exit signals.
2. **RSI/ADX Scanner**
- Enter up to **10 tickers** (e.g., `NASDAQ:AAPL`, `BINANCE:BTCUSDT`).
- Adjust **RSI/ADX Lengths & Thresholds** to match your strategy.
- Monitor the **table panel** for which markets show **strong trend confirmation**.
3. **Alerts**
- Add alerts to catch **trend shifts** or **crossovers** without watching charts 24/7.
---
## 🎯 Best For
- ✅ Trend traders
- ✅ Swing traders
- ✅ Multi-asset confluence trading
- ✅ Traders using **EMA + RSI + ADX confirmation**
---
## ⚠️ Disclaimer
This script is for **educational purposes only**.
It is **not financial advice**. Please trade responsibly.
---

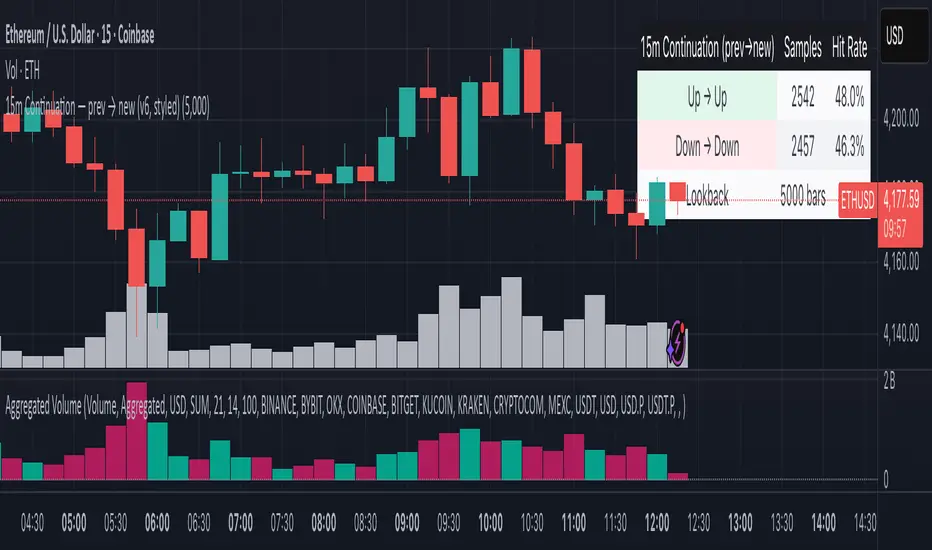
15m Continuation — prev → new (v6, styled)This indicator gives you backtested statistics on how often reversals vs continuations occur on 15 minute candles on any pair you want to trade. This is great for 15m binary markets like on Polymarket.
EMA Volume Confluence + Trend Bands[BBM]# EMA Volume Confluence + Trend Bands Indicator
## Overview
A professional day trading indicator designed to eliminate false breakouts and early entries by combining multiple confirmation signals. Perfect for futures and crypto traders holding positions 1-2 days max.
## What It Does
- **Filters out false signals** by requiring EMA crossovers, volume spikes, VWAP confirmation, AND momentum alignment
- **Shows volatility-based trend bands** to identify genuine breakouts vs noise
- **Provides clear entry signals** only when ALL conditions align
- **Real-time metrics dashboard** showing RSI, volume, VWAP position, and band status
## Signal Types
- **LONG/SHORT triangles**: High-probability EMA cross entries with full confirmation
- **BO (Breakout) crosses**: Volatility expansion breakouts with volume support
- **Yellow background**: Volume spike in progress - watch for signals
- **Colored bands**: Trade inside the channel or wait for confirmed breakouts
## Recommended Settings
### For Crypto (High Volatility)
- **Volume Spike Multiplier**: 2.0x (crypto has bigger spikes)
- **Band Multiplier**: 2.5-3.0 (wider bands for volatility)
- **Best Timeframes**: 5min, 15min
- **RSI Settings**: Keep default (70/30)
### For Futures (E-mini, Oil, Gold)
- **Volume Spike Multiplier**: 1.3-1.5x (tighter volume filter)
- **Band Multiplier**: 1.5-2.0 (narrower for cleaner signals)
- **Best Timeframes**: 1min, 5min, 15min
- **RSI Settings**: Keep default (70/30)
### For Swing/Position (1-2 day holds)
- **Volume Spike Multiplier**: 1.5x
- **Band Multiplier**: 2.0
- **Best Timeframes**: 1H, 4H
- **Consider**: Adjust RSI to 65/35 for less filtering on larger timeframes
## Pro Tips
1. **Best trades**: LONG/SHORT signals that appear right as price touches the bands
2. **Avoid**: Signals when RSI is extended (red/green in table)
3. **Volume is key**: No yellow background = probably skip the signal
4. **VWAP acts as bias**: Above = favor longs, Below = favor shorts
5. **Band breakouts (BO)**: These are your highest conviction momentum plays
## Risk Management
- Use the Band Multiplier (ATR-based) to gauge volatility
- "Above/Below" band position = extended move, consider taking profits
- "Inside" band position = consolidation, best for entries
- Higher volume multiplier = fewer but higher quality signals
## Alert Setup
Set alerts for:
- "Long Entry" - Full EMA setup
- "Short Entry" - Full EMA setup
- "Breakout Long" - Band breakout with volume
- "Breakout Short" - Band breakdown with volume
---
**Note**: This indicator prioritizes quality over quantity. You'll get fewer signals, but they have much better win rates because they require multiple confirmations. Perfect for traders tired of getting whipsawed by false breakouts!

Momentum Shift Oscillator (MSO) [SharpStrat]Momentum Shift Oscillator (MSO)
The Momentum Shift Oscillator (MSO) is a custom-built oscillator that combines the best parts of RSI, ROC, and MACD into one clean, powerful indicator. Its goal is to identify when momentum shifts are happening in the market, filtering out noise that a single momentum tool might miss.
Why MSO?
Most traders rely on just one momentum indicator like RSI, MACD, or ROC. Each has strengths, but also weaknesses:
RSI → great for overbought/oversold, but often lags in strong trends.
ROC (Rate of Change) → captures price velocity, but can be too noisy.
MACD Histogram → shows trend strength shifts, but reacts slowly at times.
By blending all three (with adjustable weights), MSO gives a balanced view of momentum. It captures trend strength, velocity, and exhaustion in one oscillator.
How MSO Works
Inputs:
RSI, ROC, and MACD Histogram are calculated with user-defined lengths.
Each is normalized (so they share the same scale of -100 to +100).
You can set weights for RSI, ROC, and MACD to emphasize different components.
The components are blended into a single oscillator value.
Smoothing (SMA, EMA, or WMA) is applied.
MSO plots as a smooth line, color-coded by slope (green rising, red falling).
Overbought and oversold levels are plotted (default: +60 / -60).
A zero line helps identify bullish vs bearish momentum shifts.
How to trade with MSO
Zero line crossovers → crossing above zero suggests bullish momentum; crossing below zero suggests bearish momentum.
Overbought and oversold zones → values above +60 may indicate exhaustion in bullish moves; values below -60 may signal exhaustion in bearish moves.
Slope of the line → a rising line shows strengthening momentum, while a falling line signals fading momentum.
Divergences → if price makes new highs or lows but MSO does not, it can point to a possible reversal.
Why MSO is Unique
Combines trend + momentum + velocity into one view.
Filters noise better than standalone RSI/MACD.
Adapts to both trend-following and mean-reversion styles.
Can be used across any timeframe for confirmation.

Strong Trend Suite — Clean v6A clean, rules-based trend tool for swing traders. It identifies strong up/down trends by syncing five pillars:
Trend structure: price above/below a MA stack (EMA20 > SMA50 > EMA200 for up; inverse for down).
Momentum: RSI (50 line) and MACD (line > signal and side of zero).
Trend strength: ADX above a threshold and rising.
Volume confirmation: OBV vs its short MA (accumulation/distribution).
Optional higher-TF bias: weekly filter to avoid fighting bigger flows.
When all align, the background tints and the mini-meter flips green/red (UP/DOWN).
It also marks entry cues: pullbacks to EMA20/SMA50 with a MACD re-cross, or breakouts of recent highs/lows on volume.
Built-in alerts for strong trend, pullback, and breakout keep you hands-off; use “Once per bar close” on the Daily chart for best signal quality.
Gap Zones Pro - Price Action Confluence Indicator with Alerts█ OVERVIEW
Gap Zones Pro identifies and tracks price gaps - crucial areas where institutional interest and market imbalance create high-probability reaction zones. These gaps represent areas of strong initial buying/selling pressure that often act as magnets when price returns.
█ WHY GAPS MATTER IN TRADING
- Gaps reveal institutional footprints and areas of market imbalance
- When price returns to a gap, it often reaffirms the original directional bias
- Failed gap reactions can signal powerful reversals in the opposite direction
- Gaps provide excellent confluence when aligned with your trading narrative
- They act as natural support/resistance zones with clear risk/reward levels
█ KEY FEATURES
- Automatically detects and visualizes all gap zones on your chart
- Extends gaps to the right edge for easy monitoring
- Customizable number of gaps displayed (manage chart clarity)
- Minimum gap size filter to focus on significant gaps only
- Real-time alerts when price enters gap zones
- Color-coded visualization (green for gap ups, red for gap downs)
- Clean, professional appearance with adjustable transparency
█ HOW TO USE
1. Add to chart and adjust maximum gaps displayed based on your timeframe
2. Set minimum gap size % to filter out noise (0.5-1% recommended for stocks)
3. Watch for price approaching gap zones for potential reactions
4. Use gaps as confluence with other technical factors:
- Support/resistance levels
- Fibonacci retracements
- Supply/demand zones
- Trend lines and channels
5. Set alerts to notify you when price enters key gap zones
█ TRADING TIPS
- Gaps with strong contextual stories (earnings, news, breakouts) are most reliable
- Multiple gaps in the same area create stronger zones
- Unfilled gaps above price can act as resistance targets
- Unfilled gaps below price can act as support targets
- Watch for "gap and go" vs "gap fill" scenarios based on market context
█ SETTINGS
- Maximum Number of Gaps: Control how many historical gaps to display
- Minimum Gap Size %: Filter out insignificant gaps
- Colors: Customize gap up and gap down zone colors
- Transparency: Adjust visibility while maintaining chart readability
- Show Borders: Toggle gap zone borders on/off
- Alerts: Automatic notifications when price crosses gap boundaries
█ BEST TIMEFRAMES
Works on all timeframes but most effective on:
- Daily charts for swing trading
- 4H for intraday position trading
- 1H for day trading key levels
- Weekly for long-term investing
Remember: Gaps are most powerful when they align with your overall market thesis and other technical confluences. They should confirm your narrative, not define it.
---
Updates: Real-time gap detection | Alert system | Extended visualization | Performance optimized

Apex Edge Sentinel - Stop Loss HUDApex Edge – ATR Sentinel Stop Loss HUD
The Apex Edge – ATR Sentinel is a complete stop-loss intelligence system built as a clean, always-on HUD.
It delivers institutional-level risk guidance by calculating and displaying live ATR-based stop levels for both long and short trades at multiple risk tolerances.
Forget cluttered charts and repainting lines — Sentinel gives you a clear stop-loss reference panel that updates dynamically with every bar.
✅ Features
• Triple ATR Multipliers
User-defined (e.g. x1.5 / x2.0 / x2.5). Compare tight, medium, and wide stops instantly.
• Dual-Side SL Levels
Both Long and Short safe stop prices displayed side by side. No more guessing trend
bias.
• ATR Transparency
HUD shows ATR(length) so you always know the calculation basis. Default = 14, adjustable
to your style.
• ATR Regime Meter
Detects volatility conditions (LOW / NORMAL / HIGH) by comparing ATR to its SMA. Helps
you avoid over-tight stops in high-volatility markets.
• Tick-Aware Rounding
Stop levels auto-rounded to the instrument’s tick size (Gold = 0.10, FX = 0.0001, indices =
whole points).
Custom HUD Design
• Location: Top/Bottom, Left/Right
• Sizes: Compact / Medium / Large (desktop or mobile)
• Opacity control (25% default Apex styling)
How to Use
1. Load Sentinel on your chart.
2. Check the HUD:
• ATR(14): 2.6 → base volatility measure.
• x1.5 / x2.0 / x2.5 → instant SL levels for both long & short trades.
3. Before entering a trade → decide which multiplier matches your style (tight scalper vs wider swing).
4. Manually place your SL at the level displayed in the HUD.
Sentinel works as both:
• A pre-trade check (is ATR stop too wide for my RR?).
• A live risk compass (updated stop levels every bar).
Why Apex Sentinel?
Most ATR stop indicators clutter charts with lagging lines or repainting trails. Sentinel strips it back to what matters:
• The numbers.
• The risk levels.
• The context.
It’s a pure stop-loss HUD, designed for serious traders who want clarity, discipline, and instant reference points across any market or timeframe.
Notes
• This is a HUD-only system (no automatic SL line). Traders manually apply the SL level
shown in the panel.
• Defaults: ATR(14), multipliers 1.5 / 2.0 / 2.5. Adjust to your trading style.
• Best used on intraday pairs like XAUUSD, EURUSD, indices, but works universally.
Apex Edge Philosophy: Clean. Smart. Institutional.
No clutter. No gimmicks. Just precision tools for modern markets.

ORB + Session VWAP Pro (London & NY) — fixedORB + Session VWAP Pro (London & NY) — Listing copy (EN)
What it is
A clean, non-repainting intraday tool that fuses the classic Opening Range Breakout (ORB) with a session-anchored VWAP filter for London and New York. It highlights only the higher-quality breakouts (above/below session VWAP), adds an optional retest confirmation, and scores each signal with an intuitive Confidence metric (0–100).
Why it works
• ORB provides the day’s first actionable structure (range high/low).
• Session VWAP filters “cheap” breaks and favors flows aligned with session value.
• Optional retest reduces first-tick whipsaws.
• Confidence blends breakout depth (vs ATR), VWAP slope and band distance.
Key visuals
• LDN/NY OR High/Low (line break style) + optional OR boxes.
• Active Session VWAP (resets per signal window; falls back to daily VWAP outside).
• Optional VWAP bands (stdev or %).
• Session shading (London/NY windows).
• Signal markers (LDN BUY/SELL, NY BUY/SELL) fired with cooldown.
Signals
• London Long / Short: Break of LDN OR High/Low ± ATR buffer, aligned with VWAP side.
• NY Long / Short: Same logic during NY window.
• Retest (optional): Requires a tag back to the OR level ± tolerance before confirmation.
• Confidence: 0–100; gate via Min Confidence (default 55).
Inputs that matter
• Open Range Length (min): Default 15.
• London/NY times & timezones.
• ATR buffer & retest tolerance.
• Bands mode: Stdev (with lookback) or % (e.g., 1%).
• Signal cooldown: Avoids clutter on fast moves.
Non-repaint policy
• OR lines build within fixed time windows using the current bar’s timestamp.
• VWAP is cumulative within the session window; no lookahead.
• All ta.crossover/ta.crossunder are precomputed every bar (no conditional execution).
• Signals are based on live bar values, not future bars.
⸻
Quick start (examples)
1) EURUSD, London momentum
• Chart: 5m or 15m.
• OR: 15 min starting 08:00 Europe/London.
• Signals: Use defaults; keep ATR buffer = 0.2 and Retest = ON, Min Confidence ≥ 55.
• Play:
• BUY when price breaks LDN OR High + buffer and stays above VWAP; retest confirms.
• Trail behind VWAP or band #1; partials into band #2.
2) NAS100, New York breakout & run
• Chart: 5m.
• NY window: 09:30 America/New_York, OR = 15 min.
• Retest OFF on high momentum days; Min Confidence ≥ 60.
• Use band mode Stdev, bandLen=50, show ±1/±2.
• Momentum continuation: add on pullbacks that hold above VWAP after the breakout.
3) XAUUSD, London fake & VWAP fade
• Chart: 5m.
• Keep Retest ON; accept only shorts that break OR Low but retest fails back under VWAP.
• Confidence gate ≥ 50 to allow more mean-reversion setups.
⸻
Pro tips
• Adjust ATR buffer to the instrument: FX 0.15–0.25, indices 0.20–0.35, metals 0.20–0.30.
• Retest ON for choppy conditions; OFF for news momentum.
• Use VWAP bands: take partials at ±1; stretch targets at ±2/±3.
• Session timezones are explicit (London/New York). Ensure they match your instrument’s behavior.
• Pair with a higher-TF bias (e.g., 1H/4H trend) for directional filtering.
⸻
Alerts (ready to use)
• ORB+SVWAP — LDN Long, LDN Short, NY Long, NY Short
(Respect your cooldown; alerts fire only after confirmation and confidence gate.)
⸻
Known limits & notes
• Designed for intraday. On 1D+ charts, session windows compress.
• If your broker session differs from London/NY clocks on a holiday, adjust input times.
• Session-anchored VWAP uses the script’s signal window, not exchange sessions, by design.

DynamoSent DynamoSent Pro+ — Professional Listing (Preview)
— Adaptive Macro Sentiment (v6)
— Export, Adaptive Lookback, Confidence, Boxes, Heatmap + Dynamic OB/OS
Preview / Experimental build. I’m actively refining this tool—your feedback is gold.
If you spot edge cases, want new presets, or have market-specific ideas, please comment or DM me on TradingView.
⸻
What it is
DynamoSent Pro+ is an adaptive, non-repainting macro sentiment engine that compresses VIX, DXY and a price-based activity proxy (e.g., SPX/sector ETF/your symbol) into a 0–100 sentiment line. It scales context by volatility (ATR%) and can self-calibrate with rolling quantile OB/OS. On top of that, it adds confidence scoring, a plain-English Context Coach, MTF agreement, exportable sentiment for other indicators, and a clean Light/Dark UI.
Why it’s different
• Adaptive lookback tracks regime changes: when volatility rises, we lengthen context; when it falls, we shorten—less whipsaw, more relevance.
• Dynamic OB/OS (quantiles) self-calibrates to each instrument’s distribution—no arbitrary 30/70 lines.
• MTF agreement + Confidence gate reduce false positives by highlighting alignment across timeframes.
• Exportable output: hidden plot “DynamoSent Export” can be selected as input.source in your other Pine scripts.
• Non-repainting rigor: all request.security() calls use lookahead_off + gaps_on; signals wait for bar close.
Key visuals
• Sentiment line (0–100), OB/OS zones (static or dynamic), optional TF1/TF2 overlays.
• Regime boxes (Overbought / Oversold / Neutral) that update live without repaint.
• Info Panel with confidence heat, regime, trend arrow, MTF readout, and Coach sentence.
• Session heat (Asia/EU/US) to match intraday behavior.
• Light/Dark theme switch in Inputs (auto-contrasted labels & headers).
⸻
How to use (examples & recipes)
1) EURUSD (swing / intraday blend)
• Preset: EURUSD 1H Swing
• Chart: 1H; TF1=1H, TF2=4H (default).
• Proxies: Defaults work (VIX=D, DXY=60, Proxy=D).
• Dynamic OB/OS: ON at 20/80; Confidence ≥ 55–60.
• Playbook:
• When sentiment crosses above 50 + margin with Δ ≥ signalK and MTF agreement ≥ 0.5, treat as trend breakout.
• In Oversold with rising Coach & TF agreement, take fade longs back toward mid-range.
• Alerts: Enable Breakout Long/Short and Fade; keep cooldown 8–12 bars.
2) SPY (daytrading)
• Preset: SPY 15m Daytrade; Chart: 15m.
• VIX (D) matters more; preset weights already favor it.
• Start with static 30/70; later try dynamic 25/75 for adaptive thresholds.
• Use Coach: in US session, when it says “Overbought + MTF agree → sell rallies / chase breakouts”, lean momentum-continuation after pullbacks.
3) BTCUSD (crypto, 24/7)
• Preset: BTCUSD 1H; Chart: 1H.
• DXY and BTC.D inform macro tone; keep Carry-forward ON to bridge sparse ticks.
• Prefer Dynamic OB/OS (15/85) for wider swings.
• Fade signals on weekend chop; Breakout when Confidence > 60 and MTF ≥ 1.0.
4) XAUUSD (gold, macro blend)
• Preset: XAUUSD 4H; Chart: 4H.
• Weights tilt to DXY and US10Y (handled by preset).
• Coach + MTF helps separate trend legs from news pops.
⸻
Best practices
• Theme: Switch Light/Dark in Inputs; the panel adapts contrast automatically.
• Export: In another script → Source → DynamoSent Pro+ → DynamoSent Export. Build your own filters/strategies atop the same sentiment.
• Dynamic vs Static OB/OS:
• Static 30/70: fast, universal baseline.
• Dynamic (quantiles): instrument-aware; use 20/80 (default) or 15/85 for choppy markets.
• Confidence gate: Start at 50–60% to filter noise; raise when you want only A-grade setups.
• Adaptive Lookback: Keep ON. For ultra-liquid indices, you can switch it OFF and set a fixed lookback.
⸻
Non-repainting & safety notes
• All request.security() calls use lookahead=barmerge.lookahead_off and gaps=barmerge.gaps_on.
• No forward references; signals & regime flips are confirmed on bar close.
• History-dependent funcs (ta.change, ta.percentile_linear_interpolation, etc.) are computed each bar (not conditionally).
• Adaptive lookback is clamped ≥ 1 to avoid lowest/highest errors.
• Missing-data warning triggers only when all proxies are NA for a streak; carry-forward can bridge small gaps without repaint.
⸻
Known limits & tips
• If a proxy symbol isn’t available on your plan/exchange, you’ll see the NA warning: choose a different symbol via Symbol Search, or keep Carry-forward ON (it defaults to neutral where needed).
• Intraday VIX is sparse—using Daily is intentional.
• Dynamic OB/OS needs enough history (see dynLenFloor). On short histories it gracefully falls back to static levels.
Thanks for trying the preview. Your comments drive the roadmap—presets, new proxies, extra alerts, and integrations.
