LiquidationsFirst, thanks to the following Tradingview community members for providing open source indicators that I used to develop this indicator!
Liquidations by volume (spot/futures) - @Thomas_Davison
Pivot and liquidation lines - @lmatl
Let me know if either of you do not approve and I will remove the indicator.
This indicator uses pivot points, volume and a liquidation percentage to determine potential liquidation levels. These are not exact but can give traders an idea of potential support or resistance levels.
Pivot points: Currently the pivot points are set to look left 5 bars and right 2 bars. This will determine the high and lows in the chart.
Volume: Assuming that high volume bars are where more leverage is used, this indicator uses the average volume over a 1000 bar period to determine to determine a baseline. I have arbitrarily set 100x lines to 20% above the average volume, 50x lines 10% above, 25x lines 5% above, 10x lines 2.5% above and 5x lines 1.25% above.
Liquidation: Finally, we are making a few assumptions on how liquidations are calculated. The following table includes the percentage a position can decline before being liquidated.
Short: Long:
100x 0.51% 0.49%
50x 1.55% 1.47%
25x 3.70% 3.38%
10x 5.11% 4.67%
5x 6.705% 6.115%
Let me know if there are any questions or if anyone has any improvements!
"Liquidation"に関するスクリプトを検索

Liquidation_linesLibrary "Liquidationline"
f_calculateLeverage(_leverage, _maintainance, _value, _direction)
Parameters:
_leverage
_maintainance
_value
_direction
f_liqline_update(_Liqui_Line, _killonlowhigh)
Parameters:
_Liqui_Line
_killonlowhigh
f_liqline_draw(_Liqui_Line, _priceorliq)
Parameters:
_Liqui_Line
_priceorliq
f_liqline_add(_Liqui_Line, linetoadd, _limit)
Parameters:
_Liqui_Line
linetoadd
_limit
Liquidationline
Fields:
creationtime
stoptime
price
leverage
maintainance
line_active
line_color
line_thickness
line_style
line_direction
line_finished
text_active
text_size
text_color
this library can draw typical liquidation lines, which can be called e.g. by indicator signals
You can see the default implementation in the lower part of the code, starting with RUNTIME
Don't forget to increase max lines to 500 in your script.
It can look like this screenshot here, with only minor changes to your executing script.
The base is the same

Liquidations Meter [LuxAlgo]The Liquidation Meter aims to gauge the momentum of the bar, identify the strength of the bulls and bears, and more importantly identify probable exhaustion/reversals by measuring probable liquidations.
🔶 USAGE
This tool includes many features related to the concept of liquidation. The two core ones are the liquidation meter and liquidation price calculator, highlighted below.
🔹 Liquidation Meter
The liquidation meter presents liquidations on the price chart by measuring the highest leverage value of longs and shorts that have been potentially liquidated on the last chart bar, hence allowing traders to:
gauge the momentum of the bar.
identify the strength of the bulls and bears.
identify probable reversal/exhaustion points.
Liquidation of low-leveraged positions can be indicative of exhaustion.
🔹 Liquidation Price Calculator
A liquidation price calculator might come in handy when you need to calculate at what price level your leveraged position in Crypto, Forex, Stocks, or any other asset class gets liquidated to add a protective stop to mitigate risk. Monitoring an open position gets easier if the trader can calculate the total risk in order for them to choose the right amount of margin and leverage.
Liquidation price is the distance from the trader's entry price to the price where trader's leveraged position gets liquidated due to a loss. As the leverage is increased, the distance from trader's entry price to the liquidation price shrinks.
While you have one or several trades open you can quickly check their liquidation levels and determine which one of the trades is closest to their liquidation price.
If you are a day trader that uses leverage and you want to know which trade has the best outlook you can calculate the liquidation price to see which one of the trades looks best.
🔹 Dashboard
The bar statistics option enables measuring and presenting trading activity, volatility, and probable liquidations for the last chart bar.
🔶 DETAILS
It's important to note that liquidation price calculator tool uses a formula to calculate the liquidation price based on the entry price + leverage ratio.
Other factors such as leveraged fees, position size, and other interest payments have been excluded since they are variables that don’t directly affect the level of liquidation of a leveraged position.
The calculator also assumes that traders are using an isolated margin for one single position and does not take into consideration the additional margin they might have in their account.
🔹Liquidation price formula
the liquidation distance in percentage = 100 / leverage ratio
the liquidation distance in price = current asset price x the liquidation distance in percentage
the liquidation price (longs) = current asset price – the liquidation distance in price
the liquidation price (shorts) = current asset price + the liquidation distance in price
or simply
the liquidation price (longs) = entry price * (1 – 1 / leverage ratio)
the liquidation price (shorts) = entry price * (1 + 1 / leverage ratio)
Example:
Let’s say that you are trading a leverage ratio of 1:20. The first step is to calculate the distance to your liquidation point in percentage.
the liquidation distance in percentage = 100 / 20 = 5%
Now you know that your liquidation price is 5% away from your entry price. Let's calculate 5% below and above the entry price of the asset you are currently trading. As an example, we assume that you are trading bitcoin which is currently priced at $35000.
the liquidation distance in price = $35000 x 0.05 = $1750
Finally, calculate liquidation prices.
the liquidation price (longs) = $35000 – $1750 = $33250
the liquidation price (short) = $35000 + $1750 = $36750
In this example, short liquidation price is $36750 and long liquidation price is $33250.
🔹How leverage ratio affects the liquidation price
The entry price is the starting point of the calculation and it is from here that the liquidation price is calculated, where the leverage ratio has a direct impact on the liquidation price since the more you borrow the less “wiggle-room” your trade has.
An increase in leverage will subsequently reduce the distance to full liquidation. On the contrary, choosing a lower leverage ratio will give the position more room to move on.
🔶 SETTINGS
🔹Liquidations Meter
Base Price: The option where to set the reference/base price.
🔹Liquidation Price Calculator
Liquidation Price Calculator: Toggles the visibility of the calculator. Details and assumptions made during the calculations are stated in the tooltip of the option.
Entry Price: The option where to set the entry price, a value of 0 will use the current closing price. Details are given in the tooltip of the option.
Leverage: The option where to set the leverage value.
Show Calculated Liquidation Prices on the Chart: Toggles the visibility of the liquidation prices on the price chart.
🔹Dashboard
Show Bar Statistics: Toggles the visibility of the last bar statistics.
🔹Others
Liquidations Meter Text Size: Liquidations Meter text size.
Liquidations Meter Offset: Liquidations Meter offset.
Dashboard/Calculator Placement: Dashboard/calculator position on the chart.
Dashboard/Calculator Text Size: Dashboard text size.
🔶 RELATED SCRIPTS
Here are some of the scripts that are related to the liquidation and liquidity concept, for more and other conceptual scripts you are kindly invited to visit LuxAlgo-Scripts .
Liquidation-Levels
Liquidations-Real-Time
Buyside-Sellside-Liquidity

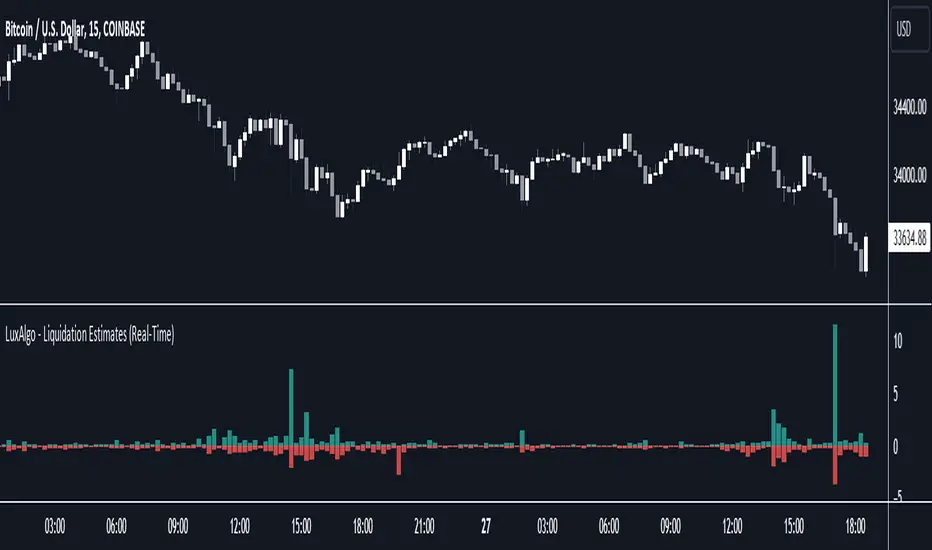
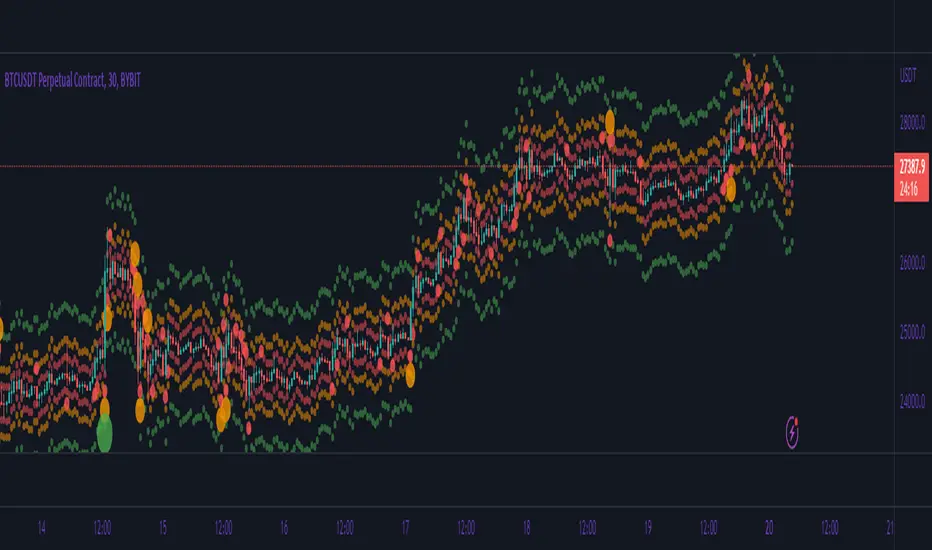
Liquidation Estimates (Real-Time) [LuxAlgo]The Liquidation Estimates (Real-Time) experimental indicator attempts to highlight real-time long and short liquidations on all timeframes. Here with liquidations, we refer to the process of forcibly closing a trader's position in the market.
By analyzing liquidation data, traders can gauge market sentiment, identify potential support and resistance levels, identify potential trend reversals, and make informed decisions about entry and exit points.
🔶 USAGE
Liquidation refers to the process of forcibly closing a trader's position. It occurs when a trader's margin account can no longer support their open positions due to significant losses or a lack of sufficient margin to meet the maintenance requirements.
Liquidations can be categorized as either a long liquidation or a short liquidation. A long liquidation is a situation where long positions are being liquidated, while short liquidation is a situation where short positions are being liquidated.
The green bars indicate long liquidations – meaning the number of long positions liquidated in the market. Typically, long liquidations occur when there is a sudden drop in the asset price that is being traded. This is because traders who were bullish on the asset and had opened long positions on the same will now face losses since the market has moved against them.
Similarly, the red bars indicate short liquidations – meaning the number of short positions liquidated in the futures market. Short liquidations occur when there is a sudden spike in the price of the asset that is being traded. This is because traders who were bearish on the asset and had opened short positions will now face losses since the market has moved against them.
Liquidation patterns or clusters of liquidations could indicate potential trend reversals.
🔹 Dominance
Liquidation dominance (Difference) displays the difference between long and short liquidations, aiming to help identify the dominant side.
🔹 Total Liquidations
Total liquidations display the sum of long and short liquidations.
🔹 Cumulative Liquidations
Cumulative liquidations are essentially the cumulative sum of the difference between short and long liquidations aiming to confirm the trend and the strength of the trend.
🔶 DETAILS
It's important to note that liquidation data is not provided on the Trading View's platform or can not be fetched from anywhere else.
Yet we know that the liquidation data is closely tied in with trading volumes in the market and the movement in the underlying asset’s price. As a result, this script analyzes available data sources extracts the required information, and presents an educated estimate of the liquidation data.
The data presented does not reflect the actual individual quantitative value of the liquidation data, traders and analysts shall look to the changes over time and the correlation between liquidation data and price movements.
The script's output with the default option values has been visually checked/compared with the liquidation chart presented on coinglass.com.
🔶 SETTINGS
🔹Liquidations Input
Mode: defines the presentation of the liquidations chart. Details are given in the tooltip of the option.
Longs Reference Price: defines the base price in calculating long liquidations.
Shorts Reference Price: defines the base price in calculating short liquidations.
🔶 RELATED SCRIPTS
Liquidation-Levels
Liquidity-Sentiment-Profile
Buyside-Sellside-Liquidity
Liquidations by volume (TG fork)Shows actual liquidations on a per-candle basis by using the difference in volume between spot and futures markets.
i.e. volume on a futures market will be much higher if there are many liquidations.
By default, green represents short liquidations (hence a bullish move, hence why it's green), whereas red is for long liquidations (bearish move). The colors can be changed in the settings if you prefer an inverted theme.
Long liquidation data should in theory be more accurate than short liquidation data due to the inability to short on a spot market.
This indicator should be able to help identify trends by determining liquidation points in the chart.
Extended by Tartigradia to automatically detect the symbol (only for crypto assets found on Binance with a USDTPERP pair, so it works for ETH, BNB, etc) and add multi-timeframe support (MTF).
If you like the indicator, please show the original author Thomas_Davison some love:

Liquidations [ChartPrime]Liquidations Indicator:
The Liquidations indicator is a powerful tool designed to help traders identify significant liquidation levels in financial markets. By analyzing volume data over a specified lookback period, the indicator highlights potential areas where market participants with high leverage positions may face liquidation, providing valuable insights into market dynamics.
Usage:
Traders can use the Liquidations indicator to:
◈ Identify liquidity grab opportunities: Liquidation levels often attract price action as market participants with leveraged positions face the risk of forced liquidation. Traders can anticipate price movements as the market aims to trigger these stops, potentially leading to rapid price movements or reversals.
◈ Confirm trend strength: A cluster of liquidation levels in the same direction as the prevailing trend may confirm the strength of the trend, while divergences between liquidation levels and price movements may signal potential trend reversals.
Settings:
◈ Previous Value Bars Back: Specifies the number of previous bars used in calculating the liquidation levels.
◈ Show Leverage: Allows users to selectively display liquidation levels for different leverage multiples, including 5x, 10x, 25x, 50x, and 100x.
◈ Liquidation Levels Width: Sets the width of the lines representing liquidation levels on the chart.
◈ Short Liquidations Color: Specifies the color of the lines representing short liquidation levels.
◈ Long Liquidations Color: Specifies the color of the lines representing long liquidation levels.
◈ Bar Color: Sets the color of the background bar when the indicator is active.
Visual Representation:
◈ Liquidation levels are plotted as horizontal lines on the chart, with different colors representing short and long liquidation levels.
◈ Each liquidation level is labeled with the corresponding leverage multiple (e.g., 5x, 10x, etc.).
A dashboard displays the active liquidation levels for each leverage multiple, allowing traders to quickly assess the current market conditions.
◈ Time Window allows users to cut off unnecessary part of the chart and concentrate on a current active part of the chart to make better trading decisions:
Interpretation:
Market participants tend to place stop-loss orders near liquidation levels , creating clusters of pending orders. As price approaches these levels, it may trigger a cascade of stop-loss orders, providing liquidity for market orders and potentially leading to rapid price movements in the opposite direction.
Traders can anticipate price reversals or accelerations as price interacts with liquidation levels, using them as reference points for identifying potential entry or exit opportunities.
Note:
While the Liquidations indicator provides valuable insights into market dynamics, traders should use it in conjunction with other technical analysis tools and risk management strategies to make informed trading decisions.

Liquidations Zones [ChartPrime]The Liquidation Zones indicator is designed to detect potential liquidation zones based on common leverage levels such as 10x, 25x, 50x, and 100x. By calculating percentage distances from recent pivot points, the indicator shows where leveraged positions are most likely to get liquidated. It also tracks buy and sell volumes in these zones, helping traders assess market pressure and predict liquidation scenarios. Additionally, the indicator features a heat map mode to highlight areas where orders and stop-losses might be clustered.
⯁ KEY FEATURES AND HOW TO USE
⯌ Leverage Zones Detection :
The indicator identifies zones where positions with leverage ratios of 100x, 50x, 25x, and 10x are at risk of liquidation. These zones are based on percentage moves from recent pivots: a 1% move can liquidate 100x positions, a 4% move affects 25x positions, and so on.
⯌ Liquidated Zones and Volume Tracking :
The indicator displays liquidated zones by plotting gray areas where the price potentually liquidate positons. It calculates the volume needed to liquidate positions in these zones, showing volume from bullish candles if short positions were liquidated and volume from bearish candles for long positions. This feature helps traders assess the risk of liquidation as the price approaches these zones.
⯌ Buy/Sell Volume Calculation :
Buy and sell volumes are calculated from the most recent pivot high or low. For buy volume, only bullish candles are considered, while for sell volume, only bearish candles are summed. This data helps traders gauge the strength of potential liquidation in different zones.
Example of buy and sell volume tracking in active zones:
⯌ Liquidity Heat Map :
In heat map mode, the indicator visualizes potential liquidity areas where orders and stop-losses may be clustered. This map highlights zones that are likely to experience liquidations based on leverage ratios. Additionally, it tracks the highest and lowest price levels for the past 100 bars, while also displaying buy and sell volumes. This feature is useful for predicting market moves driven by liquidation events.
⯁ USER INPUTS
Length : Determines the number of bars used to calculate pivots for liquidation zones.
Extend : Controls how far the liquidation zones are extended on the chart.
Leverage Options : Toggle options to display zones for different leverage levels: 10x, 25x, 50x, and 100x.
Display Heat Map : Enables or disables the liquidity heat map feature.
⯁ CONCLUSION
The Liquidation Zones indicator provides a powerful tool for identifying potential liquidation zones, tracking volume pressure, and visualizing liquidity areas on the chart. With its real-time updates and multiple features, this indicator offers valuable insights for managing risk and anticipating market moves driven by leveraged positions.

Liquidation Longs/Shorts [UAlgo]🔶Description:
The "Liquidation Longs/Shorts " indicator is designed to identify potential liquidation levels for long and short positions. It calculates the distance of the selected price source (close, high, low, or open) from two moving averages (MA) and plots the resulting values on the chart. When the price is at an extreme distance from the moving averages, it suggests a potential liquidation point for either long or short positions.
🔶Key Features:
Liquidation Calculations: The indicator calculates the distance of the selected price source from two moving averages: a simple moving average (SMA) and an exponential moving average (EMA) with customizable lengths.
Color Customization: Users can customize the colors of the plotted columns representing the distance from the moving averages for long and short liquidation levels.
Liquidation Circles: The indicator marks potential liquidation levels with small circles on the chart, with customizable colors for long and short liquidations.
Orange Circles -> Identifies Potential Short Liquidations
Aqua Circles -> Identifies Potential Long Liquidations
Example:
Adaptive Source Selection: Traders can select the price source (close, high, low, or open) for liquidation calculations, allowing flexibility based on their trading strategies.
Dynamic Threshold Calculation: The indicator dynamically adjusts the liquidation threshold based on the selected moving average lengths, providing adaptability to changing market conditions.
Disclaimer:
Use with Caution: This indicator is provided for educational purposes only and should not be considered as financial advice. Users should exercise caution and perform their own analysis before making trading decisions based on the indicator's signals.
Not Financial Advice: The information provided by this indicator does not constitute financial advice, and the creator (UAlgo) shall not be held responsible for any trading losses incurred as a result of using this indicator.
Backtesting Recommended: Traders are encouraged to backtest the indicator thoroughly on historical data before using it in live trading to assess its performance and suitability for their trading strategies.
Risk Management: Trading involves inherent risks, and users should implement proper risk management strategies, including but not limited to stop-loss orders and position sizing, to mitigate potential losses.
No Guarantees: The accuracy and reliability of the indicator's signals cannot be guaranteed, as they are based on historical price data and past performance may not be indicative of future results.
This indicator serves as a tool to assist traders in identifying potential liquidation levels, but it should be used in conjunction with other technical analysis tools and risk management practices for effective trading decision-making.

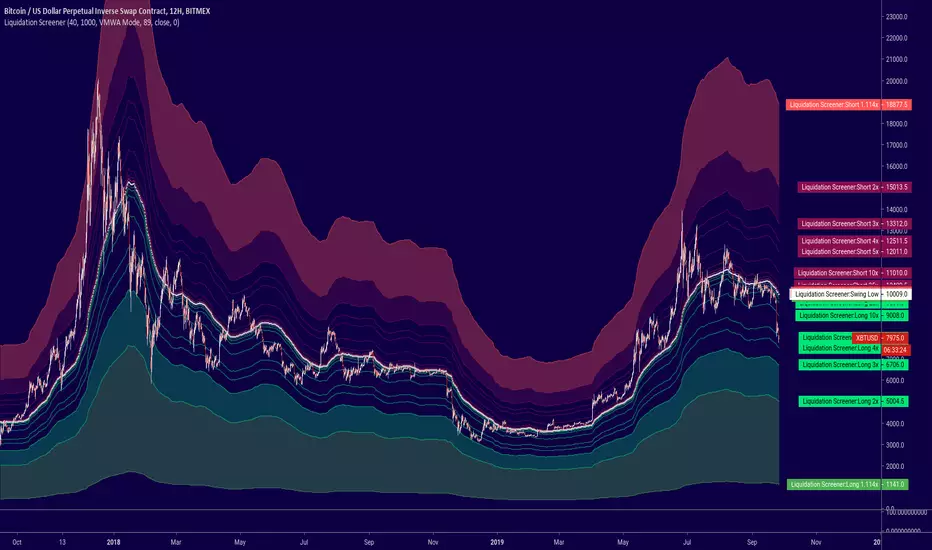
Liquidation ScreenerOption to screen for,
1. Volume Weighted Moving Average (better representation of majority)
2. Liquidation from Top Entered Positions (Long & Shorts)
3. Liquidations from Bottom Entered Positions (Longs & Shorts)
4. Liquidations from Top Shorts and Bottom Longs
5. Liquidations from Top Longs and Bottom Shorts
You can change candle lookback for 2-5 since these use a highest/lowest value for defined period. For the VWMA you can change the source and the MA length.
Optionally input for custom price to specifically look for liquidation levels.
Happy trading/ stay sharp,
-TheTrex
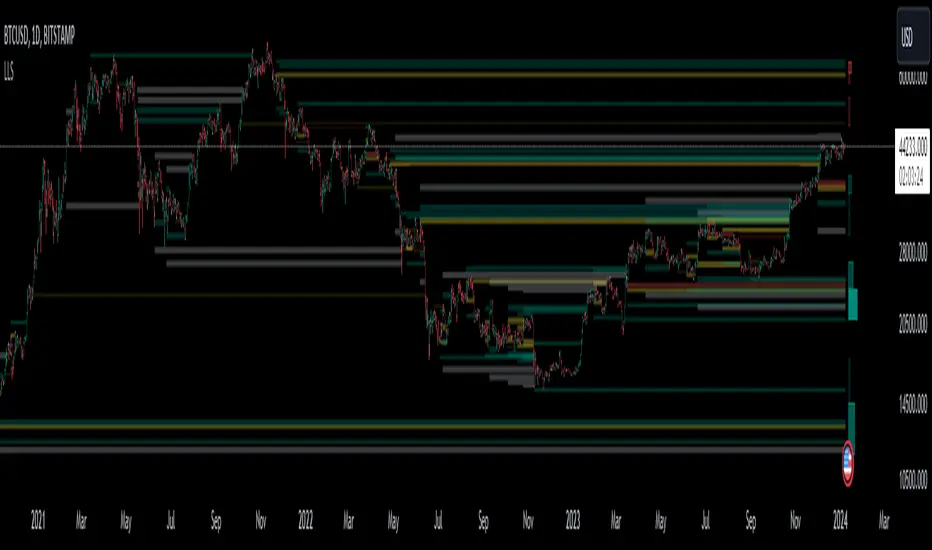
Liquidation Level ScreenerThe Liquidation Level Screener is an analytical tool designed for traders who seek a comprehensive view of potential liquidation zones in the market. This script, adaptable to almost any timeframe from 1 minute to 3 days, offers a unique perspective by mapping out key liquidation levels where significant market actions could occur.
Key Features:
Multi-Exchange Data Aggregation: Unlike many other indicators, the Liquidation Levels Indicator compiles data from multiple leading exchanges including Binance, Bitmex, Kraken, and Bitfinex. This approach ensures a more holistic and accurate representation of market sentiment, providing insights into potential liquidation points across various platforms.
Customizable Timeframes and Modes: The script is versatile, working effectively across various timeframes. It operates in two distinct modes:
Actual Levels Display: Visually represents potential liquidation levels.
Settings Mode: Showcases an open interest (OI) oscillator. When OI is exceptionally high, indicating a surge in opened positions at a specific candle, it signals traders to be vigilant about upcoming liquidation levels.
Three-Tier Liquidation System: The indicator categorizes liquidation levels into three distinct tiers based on open interest levels—1, 2, and 3—with Level 3 representing the highest concentration of open positions. This tiered approach allows traders to gauge the significance of each level and adjust their strategies accordingly.
Histogram Visualization: A novel feature of this script is the histogram on the chart's right side, representing the concentration of liquidation levels in specific market zones. This visual aid helps traders identify crucial areas that warrant close attention, enhancing decision-making.
Customizable Options:
Moving Averages: Choose from a wide range of moving average types, including VWMA, SMA, EMA, and more, to tailor the indicator to your analysis style.
Histogram Settings: Adjust the number of histograms, lookback bars, and their proximity to the latest candle, allowing for a personalized density and range of visualization.
Liquidation Level Sensitivity: Set thresholds for different liquidation levels, fine-tuning the indicator to detect varying degrees of market leverage.
Color Coding: Customize the color scheme for different leverage levels, enhancing visual clarity and ease of interpretation.
The Liquidation Level Screener offers a unique edge by highlighting potential zones where significant market movements can occur due to liquidations. By consolidating data from multiple exchanges, it provides a more rounded view of market behavior, which is essential in today’s interconnected trading environment. The tiered liquidation system and histogram feature equip traders with the ability to identify and focus on key market segments where high activity is expected. This tool is particularly valuable for traders who base their strategies on market liquidity and leverage dynamics.
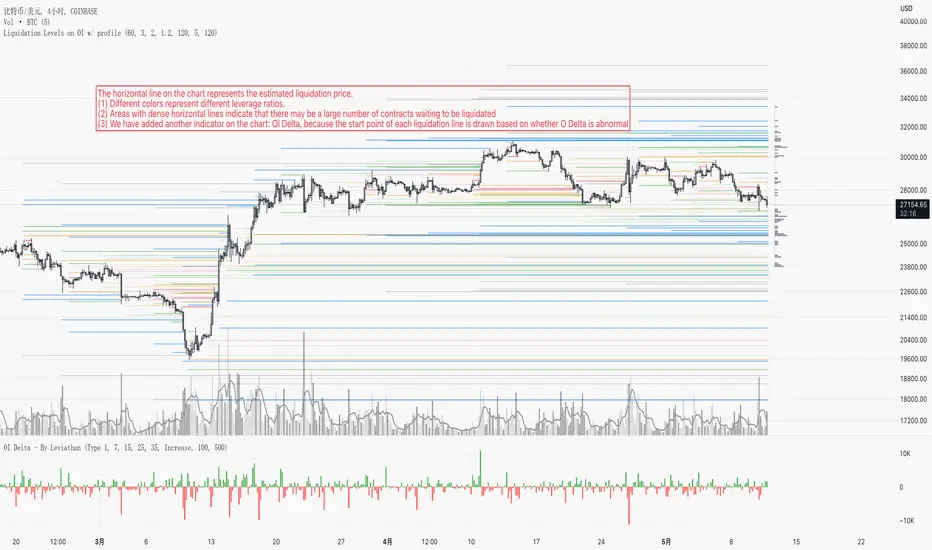
Liquidation Levels on OIThis indicator is used to display estimated contract liquidation prices. When there are dense liquidation areas on the chart, it indicates that there may be a lot of liquidity at that price level. The horizontal lines of different colors on the chart represent different leverage ratios. See below for details.
Let me introduce the principle behind this indicator:
1. When position trading volume increases or decreases significantly higher than usual levels in a specific candlestick chart, it indicates that a large number of contracts were opened during that period. We use the 60-day moving average change as a benchmark line. If the position trading volume changes more than 1.2x, 2x or 3x its MA60 value, it is considered small, medium or large abnormal increase or decrease.
2. This indicator takes an approximate average between high, open, low and close prices of that candlestick as opening price.
3. Since contracts involve liquidity provided by both buyers and sellers with equal amounts of long and short positions corresponding to each contract respectively; since we cannot determine actual settlement prices for contract positions; therefore this indicator estimates settlement prices instead which marks five times (5x), ten times (10x), twenty-five times (25x), fifty times (50x) and one hundred times (100x) long/short settlement prices corresponding to each candlestick chart generating liquidation lines with different colors representing different leverage levels.
4. We can view areas where dense liquidation lines appear as potential liquidation zones which will have high liquidity.
5. We can adjust orders based on predicted liquidation areas because most patterns in these areas will be quickly broken.
6. We provide a density histogram to display the liquidation density of each price range.
Special thanks to the following TradingView community members for providing open-source indicators and contributing to the development of this indicator!
Liquidation - @Mysterysauce
Open Interest Delta - By Leviathan - @LeviathanCapital
Regarding the relationship with the above-mentioned open source indicators:
1. Indicator Liquidation - @Mysterysauce can also draw a liquidation line in the chart, but:
(1) Our indicator generates a liquidation line based on abnormal changes in open interest; their indicator generates a liquidation line based on trading volume.
(2) Our indicator will generate both long and short liquidation lines at the same time; their indicator will only generate a liquidation line in a single direction.
We refer to their method of drawing liquidation lines when drawing our own.
2. Indicator Open Interest Delta - By Leviathan - @LeviathanCapital obtained OI data for Binance USDT perpetual contracts in the code. We refer to their method of obtaining OI data in our code.
============= 中文版本 =============
此指标用于显示估计合约清算价格。当图表上有密集的清算区域时,表示该价格水平可能存在大量流动性。图表上不同颜色的水平线代表不同杠杆比率。详情请参见下面的说明。
让我介绍一下这个指标背后的原理:
1. 当特定蜡烛图对应的合约仓位增加量(OI Delta)显著高于通常水平时,表示在那段时间有大量合约开仓。我们使用OI Delta的60日移动均线作为基准线。如果OI Delta超过其MA60值的1.2倍、2倍或3倍,则认为是小型、中型或大型的异常OI Delta。
2. 该指标将上述蜡烛图高、开、低和收盘价的平均值作为近似的合约开仓价。
3. 由于合约涉及买方和卖方之间相互提供流动性,每个合约对应相等数量的多头和空头头寸。由于我们无法确定合约头寸的实际清算价格,因此该指标估计了清算价格。它标记了与该蜡烛图相对应的多头和空头5倍、10倍、25倍、50倍和100倍的清算价格,生成清算线。不同杠杆水平用不同颜色表示。
4. 我们可以将出现密集清算线的区域视为潜在的清算区域。这些区域将具有高流动性。
5. 我们可以根据预测到的清算区域调整自己的订单,因为根据规律,这些清算区域大部分都会很快被击穿。
6. 我们提供了密度直方图来显示每个价格范围的清算密度
特别感谢以下TradingView社区成员提供开源指标并为该指标的开发做出贡献!
Liquidation - @Mysterysauce
Open Interest Delta - By Leviathan - @LeviathanCapital
与上述开源指标的关系:
1. 指标Liquidation - @Mysterysauce也可以在图中绘制清算线,但是:
(1)我们的指标是基于open interest的异常变化生成的清算线;他们的指标是基于成交量生成的清算线
(2)我们的指标会同时生成多头和空头清算线;他们的指标仅会在单一方向生成清算线
我们的指标在绘制清算线上参考了他们绘制清算线的方式
2. 指标Open Interest Delta - By Leviathan - @LeviathanCapital在代码中获取了Binance USDT永续合约的OI数据。我们在代码中参考他们获取OI数据的方式
Liquidation Levels with Liquidity Sweeps/Breakouts [AlgoAlpha]🌊📈 Dive into the depths of market liquidity with "Liquidation Levels with Liquidity Sweeps/Breakouts" - your ultimate tool for navigating the turbulent waters of trading! 🧹💹 Crafted by the wizards at AlgoAlpha, this Pine Script™ masterpiece illuminates the unseen liquidity levels and sweeps, guiding you through the financial seas with insight. 🚀🔍
Key Features:
🕒 Timeframe Flexibility: Customize your analysis with a TimeFrame Multiplier, allowing the indicator to operate on higher timeframes for broader market insight.
💥 Dynamic Volume Threshold: Set your sensitivity to breakouts with the High Volume Threshold, ensuring you catch significant market movements while avoiding fakeouts.
👀 Visibility Controls: Toggle the display of swept liquidity and highlight liquidity breakouts with customizable background colors for clear, actionable insights.
🎨 Custom Appearance: Personalize your chart with bullish, bearish, and breakout colors to match your trading style.
How to Use the Liquidity Levels with Liquidation Sweeps Indicator:
Maximize your trading efficiency with the Liquidity Levels with Liquidation Sweeps Indicator by following these simple steps! 🚀🌟
⚙️ Customize Settings: Access the indicator settings to personalize the TimeFrame Multiplier, High Volume Threshold, and Relative Volume Period. Tailor these settings to match your trading strategy and chart preferences.
👁️ Analyze Liquidity Levels: Monitor the chart for liquidity levels and sweeps. Bullish sweeps are marked with green labels, bearish sweeps with red, and breakouts highlighted by the chart background.
🔔 Set Alerts: Enable alert conditions for liquidity breakouts and sweeps within the indicator's settings. This feature allows you to receive real-time notifications, helping you to act promptly on trading opportunities.
How It Works:
The heart of this indicator lies in its ability to track and highlight liquidity levels derived from swing pivots, and sweeps across multiple timeframes. By calculating relative volume against a user-defined threshold, it identifies strong volume movements indicative of liquidity breakouts, this helps filter out fake-outs. When a liquidity level is breached but not completely mitigated, it's either marked as a bullish or bearish sweep, which come with the option to show an estimate of the number of liquidations during the sweep.
if peakform and peakprinted != 1
aR.push(line.new(bar_index-mult, h.get(1), bar_index+1, h.get(1), color = red))
aRv.push(h.get(1))
peakprinted := 1
if valleyform and valleyprinted != 1
aS.push(line.new(bar_index-mult, l.get(1), bar_index+1, l.get(1), color = green))
aSv.push(l.get(1))
valleyprinted := 1

Liquidation Ranges + Volume/OI Dots [Kioseff Trading]Hello!
Introducing a multi-faceted indicator "Liquidation Ranges + Volume Dots" - this indicator replicates the volume dot tools found on various charting platforms and populates a liquidation range on crypto assets!
Features
Volume/OI dots populated according to user settings
Size of volume/OI dots corresponds to degree of abnormality
Naked level volume dots
Fixed range capabilities for volume/OI dots
Visible time range capabilities for volume/OI dots
Lower timeframe data used to discover iceberg orders (estimated using 1-minute data)
S/R lines drawn at high volume/OI areas
Liquidation ranges for crypto assets (10x - 100x)
Liquidation ranges are calculated using a popular crypto exchange's method
# of violations of liquidation ranges are recorded and presented in table
Pertinent high volume/OI price areas are recorded and presented in table
Personalized coloring for volume/OI dots
Net shorts / net long for the price range recorded
Lines shows reflecting net short & net long increases/decreases
Configurable volume/OI heatmap (displayed between liquidation ranges)
And some more (:
Liquidation Range
The liquidation range component of the indicator uses a popular crypto exchange's calculation (for liquidation ranges) to populate the chart for where 10x - 100x leverage orders are stopped out.
The image above depicts features corresponding to net shorts and net longs.
The image above shows features corresponding to liquidation zones for the underlying coin.
The image above shows the option to display volume/oi delta at the time the corresponding grid was traded at.
The image above shows an instance of using the "fixed range" feature for the script.
*The average price of the range is calculated to project liquidation zones.
*Heatmap is calculated using OI (or volume) delta.
Huge thank you to Pine Wizard @DonovanWall for his range filter code!
Price ranges are automatically detected using his calculation (:
Volume / OI Dots
Similar to other charting platforms, the volume/OI dots component of the indicator distinguishes "abnormal" changes in volume/OI; the detected price area is subsequently identified on the chart.
The detection method uses percent rank and calculates on the last bar of the chart. The "agelessness" of detection is contingent on user settings.
The image above shows volume dots in action; the size of each volume dot corresponds to the amount of volume at the price area.
Smaller dots = lower volume
Larger dots = higher volume
The image above exemplifies the highest aggression setting for volume/OI dot detection.
The table oriented top-right shows the highest volume areas (discovered on the 1-minute chart) for the calculated period.
The open interest change and corresponding price level are also shown. Results are listed in descending order but can also be listed in order of occurrence (most relevant).
Additionally, you can use the visible time range feature to detect volume dots.
The feature shows and explains how the visible range feature works. You select how many levels you want to detect and the script will detect the selected number of levels.
For instance, if I select to show 20 levels, the script will find the 20 highest volume/OI change price areas and distinguish them.
The image above shows a narrower price range.
The image above shows the same price range; however, the script is detecting the highest OI change price areas instead of volume.
* You can also set a fixed range with this feature
* Naked levels can be used
Additionally, you can select for the script to show only the highest volume/ OI change price area for each bar. When active, the script will successively identify the highest volume / OI change price area for the most recent bars.
Naked Levels
The image above shows and explains how naked levels can be detected when using the script.
And that's pretty much it!
Of course, there're a few more features you can check out when you use the script that haven't been explained here (:
Thank you again to @DonovanWall
Thank you to @Trendoscope for his binary insertion sort library (:
Thank you to @PineCoders for their time library
Thank you for checking this out!

Liquidation Levels [LuxAlgo]The Liquidation Levels indicator aims at detecting and estimating potential price levels where large liquidation events may occur.
By analyzing liquidation Levels, traders can identify potential support & resistance levels, identify stop-loss levels, and gauge market sentiment and potential areas of price volatility.
🔶 USAGE
Liquidation refers to the process of forcibly closing a trader's leveraged positions in the market. It occurs when a trader's margin account can no longer support their open positions due to significant losses or a lack of sufficient margin to meet the maintenance margin requirements.
Liquidation events happen at all times and the script focuses on detecting the most significant ones. Bubbles will appear on the relevant price bar when larger trading activity has been detected. Larger bubbles represent more significant potential liquidation levels. The lines attached to the bubbles represent the liquidation zones at that price.
These liquidation levels are based on clusters of price points where highly leveraged traders open long or short positions. High leverage is identified as 100x, 50x, and 25x leverages used for both long and short positions. The script allows users to either remove or customize leverage levels.
Price generally heads towards zones or clusters of liquidity.
🔶 SETTINGS
🔹Liquidation Levels
Reference Price: defines the base price in calculating liquidation levels.
Volume Threshold: The volume threshold is the primary factor in detecting the significant trading activities that could potentially lead to liquidating leveraged positions.
Volatility Threshold: The volatility threshold option is the secondary factor that aims at detecting significant movement in the underlying asset’s price with relatively lower trading activities that could potentially also lead to liquidating high-leveraged positions.
Leverage Options: The leverage options are where the trader will set the desired leverage value and customize the potential liquidation level colors.
Hide Liquidation Bubbles: Toggles the visibility of the bubbles.
Hide Liquidation Levels: Toggles the visibility of the lines.
🔶 RELATED SCRIPTS
Liquidity-Sentiment-Profile
Buyside-Sellside-Liquidity

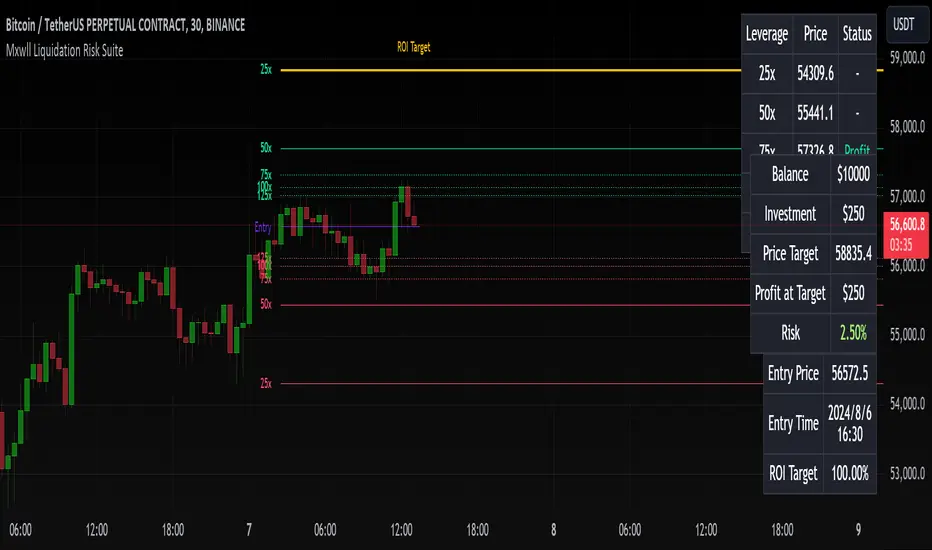
Liquidation Risk Suite [Mxwll]Hello traders 👋
This indicator "Liquidation Risk Suite" hosts various features that allow the trade to determine optimal position sizing, leverage, profit targets, and more!
Features
Customizable entry price and time
From the entry price, a user-defined number of liquidation levels by leverage are shown
From the entry price, a user-defined number of profit targets by leverage are shown
User-defined ROI % target. Liquidation levels and profit targets automatically change to account for the traders' desired profit percentage.
Calculate for long and short positions
Trader can set portfolio balance and investment per trade - indicator will warn the trader when the investment per trade is too high relative to the portfolio balance.
How this script works
The Liquidation Risk Suite is designed to help traders determine position sizing, appropriate risk for their position (leverage, etc.), and potential profit targets from their entry point.
Upon loading the script, the script will prompt you for an entry price and entry time. Simply click the screen at the appropriate locations (your entry price and entry bar) and, from there, the script will calculate various liquidation levels, determine whether your trade has achieved the desired profit at various leverages, and provide various trading metrics such as % risk of portfolio, ROI target %, profit at target, and more!
The image above outlines various trade-related metrics for your position!
These metrics include:
Status of trade (profit or loss) for various common leverage amounts
Portfolio balance
Investment amount
Price target (calculated from desired ROI%)
Profit at target (calculated from desired ROI% and leverage used)
Portfolio risk
Entry price
Entry time
ROI Target %
The image above explains the output of the script, including line style indications!
Solid lines indicate that the leverage used for at your entry price constitutes an active trade. Dotted lines mean the trade has already achieved your profit target for that leverage, or stopped out.
Additionally, the script can calculate pertinent metrics for short positions!
That's all, just a simple, sweet script to help traders figure out what leverage to use for their positions, the risk they're taking on, and potential stop and profit levels!
Thank you to kaigouthro for his colors library!
Liquidation Levels
I got sick of calculating leverage all of the time, so I made this real time calculator. It is primarily for crypto derivatives.
It tracks and displays the liquidation price for 5 customisable leverage levels and plots them either historically and/or in real time, with labels beside each including the estimated price.
These calculations include maintenance margin and can be configured for linear futures (USDT) or non-linear futures. Never again make dumb mistakes that are obvious with a bit of maths.
To jazz it up, you can customise the colours, disable various labels, set different leverage multiples, and change the offsets and number of bars to plot in the past.
Alternatively, you can change the offset to 24 on an hourly chart and change show last bars to 0. By doing this, you can see which levels most often get liquidated. It is crude, I know, and there are better tools for tracking liquidation hunts. This is not an attempt to replace or compete with them.
Enjoy and trade safely.

Liquidations Levels [RunRox]📈 Liquidation Levels is an indicator designed to visualize key price levels on the chart, highlighting potential reversal points where liquidity may trigger significant price movements.
Liquidity is essential in trading - price action consistently moves from one liquidity area to another. We’ve created this free indicator to help traders easily identify and visualize these liquidity zones on their charts.
📌 HOW IT WORKS
The indicator works by marking visible highs and lows, points widely recognized by traders. Because many traders commonly place their stop-loss orders beyond these visible extremes, significant liquidity accumulates behind these points. By analyzing trading volume and visible extremes, the indicator estimates areas where clusters of stop-loss orders (liquidity pools) are likely positioned, giving traders valuable insights into potential market moves.
As shown in the screenshot above, the price aggressively moved toward Sell-Side liquidity. After sweeping this liquidity level for the second time, it reversed and began targeting Buy-Side liquidity. This clearly demonstrates how price moves from one liquidity pool to another, continually seeking out liquidity to fuel its next directional move.
As shown in the screenshot, price levels with fewer anticipated trader stop-losses are indicated by less vibrant, faded colors. When the lines become more saturated and vivid, it signals that sufficient liquidity - in the form of clustered stop-losses has accumulated, potentially attracting price movement toward these areas.
⚙️ SETTINGS
🔹 Period – Increasing this setting makes the marked highs and lows more significant, filtering out minor price swings.
🔹 Low Volume – Select the color displayed for low-liquidity levels.
🔹 High Volume – Select the color displayed for high-liquidity levels.
🔹 Levels to Display – Choose between 1 and 15 nearest liquidity levels to be shown on the chart.
🔹 Volume Sensitivity – Adjust the sensitivity of the indicator to volume data on the chart.
🔹 Show Volume – Enable or disable the display of volume values next to each liquidity level.
🔹 Max Age – Limits displayed liquidity levels to those not older than the specified number of bars.
✅ HOW TO USE
One method of using this indicator is demonstrated in the screenshot above.
Price reached a high-liquidity level and showed an initial reaction. We then waited for a second confirmation - a liquidity sweep followed by a clear market structure break - to enter the trade.
Our target is set at the liquidity accumulated below, with the stop-loss placed behind the manipulation high responsible for the liquidity sweep.
By following this approach, you can effectively identify trading opportunities using this indicator.
🔶 We’ve made every effort to create an indicator that’s as simple and user-friendly as possible. We’ll continue to improve and enhance it based on your feedback and suggestions in the future.

Crypto Liquidation Heatmap [LuxAlgo]The Crypto Liquidation Heatmap tool offers real-time insights into the liquidations of the top cryptocurrencies by market capitalization, presenting the current state of the market in a visually accessible format. Assets are sorted in descending order, with those experiencing the highest liquidation values placed at the top of the heatmap.
Additional details, such as the breakdown of long and short liquidation values and the current price of each asset, can be accessed by hovering over individual boxes.
🔶 USAGE
The crypto liquidation heatmap tool provides real-time insights into liquidations across all timeframes for the top 29 cryptocurrencies by market capitalization. The assets are visually represented in descending order, prioritizing assets with the highest liquidation values at the top of the heatmap.
Different colors are used to indicate whether long or short liquidations are dominant for each asset. Green boxes indicate that long liquidations surpass short liquidations, while red boxes indicate the opposite, with short liquidations exceeding long liquidations.
Hovering over each box provides additional details, such as the current price of the asset, the breakdown of long and short liquidation values, and the duration for the calculated liquidation values.
🔶 DETAILS
🔹Crypto Liquidation
Crypto liquidation refers to the process of forcibly closing a trader's positions in the cryptocurrency market. It occurs when a trader's margin account can no longer support their open positions due to significant losses or a lack of sufficient margin to meet the maintenance requirements. Liquidations can be categorized as either a long liquidation or a short liquidation.
A long liquidation occurs when long positions are being liquidated, typically due to a sudden drop in the price of the asset being traded. Traders who were bullish on the asset and had opened long positions will face losses as the market moves against them.
On the other hand, a short liquidation occurs when short positions are being liquidated, often triggered by a sudden spike in the price of the asset. Traders who were bearish on the asset and had opened short positions will face losses as the market moves against them.
🔹Liquidation Data
It's worth noting that liquidation data is not readily available on TradingView. However, we recognize the close correlation between liquidation data, trading volumes, and asset price movements. Therefore, this script analyzes accessible data sources, extracts necessary information, and offers an educated estimation of liquidation data. It's important to emphasize that the presented data doesn't reflect precise quantitative values of liquidations. Traders and analysts should instead focus on observing changes over time and identifying correlations between liquidation data and price movements.
🔶 SETTINGS
🔹Cryptocurrency Asset List
It is highly recommended to select instruments from the same exchange with the same currency to maintain proportional integrity among the chosen assets, as different exchanges may have varying trading volumes.
Supported currencies include USD, USDT, USDC, USDP, and USDD. Remember to use the same currency when selecting assets.
List of Crypto Assets: The default options feature the top 29 cryptocurrencies by market capitalization, currently listed on the Binance Exchange. Please note that only crypto assets are supported; any other asset type will not be processed or displayed. To maximize the utility of this tool, it is crucial to heed the warning message displayed above.
🔹Liquidation Heatmap Settings
Position: Specifies the placement of the liquidation heatmap on the chart.
Size: Determines the size of the liquidation heatmap displayed on the chart.
🔶 RELATED SCRIPTS
Liquidations-Meter
Liquidation-Estimates
Liquidation-Levels

Open Intrest / Volume / Liquidations (Suite) [BigBeluga]This indicator is a suite of tools that aims to provide traders with efficient metrics to analyze the market in a different way, such as various types of Open Interest, Intraday Volume, and Liquidations.
This indicator can both save time and also provide a different approach to the usual price action trading style.
🔶 FEATURES
The indicator contains the following features:
Open Interest Suite
- Delta OI
- Net longs and shorts
- OI Relative Strength Index
Intraday Volume Suite
- Bullish and Bearish LTF Volume
- CVD
- Delta Volume
Liquidations Suite
- Long and Short Liquidations
- Cumulative Liquidations
🔶 EXAMPLE OF SUITE
In the example above, we can see how we can plot long and short positions, both opening and closing out.
This can give a unique way to view which side is the strongest but also which side has the most resting liquidity.
For example, if more longs are entering the market, it also means more liquidity for longs and vice versa.
Or, for example, plotting the delta OI will allow the user to see big percentages in change and spot big areas of position closing out.
This presents a fascinating method for observing numerous positions closing out in conjunction with a surge of liquidations, which could indicate a potential reversal in price.
Here, we can see a basic example of using intraday volume on a 1m LTF.
With this, we are able to see both bullish and bearish volume of the same candle, very useful to see both volumes traded in the same candle.
Using the CVD to see the overall direction based purely on the volume and spot divergence, for example, the price in an uptrend but CVD going down, indicating weak shorts in the market or trapped shorts.
Or simply view liquidations happening in the market in a very different way, both long and short liquidation at the same time + the option to use multi-timeframe liquidations.
🔶 CONCLUSION
The idea of this script is to provide a set of tools in a unique script to optimize time and analyze the market in both a quick way and in a different way than usual.

Pivot and liquidation lines [LM]Hello traders,
I would like to introduce you pivot and liquidation zones. Levels are rendered based on pivot points. We are looking for confluence of liquidation lines in order to have the gist where the market could go. calculation for the liquidation lines are taken from Bybit. It's good to look for line clusters. Indicator doesn't tell you where the market will go but it tells you where are the potential zones of position liquidations
There are several settings:
pivot setting - ordinary pivot lines setting
first leverage - setting for first leverage
second leverage - setting for second leverage
third leverage - setting for first leverage
fourth leverage - setting for second leverage
Hope you will enjoy it.

Leverage Liquidation Circles/dots/alertsThis plots liquidation alerts for different levels of leverage. The script calculates the liquidation prices for both long and short positions based on the inputted leverage values. Then, it plots dots on the chart where liquidation can occur for each level of leverage. Additionally, it plots circles on the chart only when a liquidation event occurs, at which point the circle changes color to indicate the level of leverage that triggered the liquidation.
The script allows traders to visualize potential liquidation events for different levels of leverage, which can be helpful in managing risk when trading on margin. The different colors of the circles can quickly communicate which level of leverage triggered the liquidation, allowing traders to quickly assess the situation and adjust their positions if necessary.
DCA Liquidation Calculation [ChartPrime]The DCA Liquidation Calculator is a powerful table indicator designed for both manual and bot-assisted traders who practice Dollar Cost Averaging (DCA). Its primary objective is to help traders avoid getting liquidated and make informed decisions when managing their positions. This comprehensive table indicator provides essential information to DCA traders, enabling them to plan their trades effectively and mitigate potential risks of liquidation.
Key Features:
Liquidation Price Awareness: The DCA Liquidation Calculator calculates and displays the liquidation price for each trade within your position. This critical information empowers traders to set appropriate stop-loss levels and avoid being liquidated in adverse market conditions, especially in leveraged trading scenarios.
DCA Recommendations: Whether you are executing DCA manually or using a trading bot, the DCA Liquidation Calculator offers valuable guidance. It suggests optimal entry prices and provides insights into the percentage deviation from the current market price, helping traders make well-timed and well-informed DCA decisions.
Position Sizing: Proper position sizing is essential for risk management. The DCA Liquidation Calculator helps traders determine the percentage of capital to allocate to each trade based on the provided insights. By using the recommended position sizing, traders can protect their capital and potentially maximize profits.
Profit and Loss Visualization: Gain real-time visibility into your Profit and Loss (PnL) with the DCA Liquidation Calculator. This feature allows you to monitor your trades' performance, enabling you to adapt your strategies as needed and make data-driven decisions.
Margin Call Indicators: Anticipating potential margin calls is crucial for maintaining a healthy trading account. The DCA Liquidation Calculator's smart analysis helps you identify and manage potential margin call situations, reducing the risk of account liquidation.
Capital Requirements: Before entering a trade, it's vital to know the required capital. The DCA Liquidation Calculator provides you with this information, ensuring you are adequately prepared to execute your trades without overextending your resources.
Maximum Trade Limit: Considering your available capital, the DCA Liquidation Calculator helps you determine the maximum number of trades you can enter. This feature ensures you maintain a disciplined and sustainable trading approach aligned with your financial capabilities.
Color-Coded Risk Indicators:
Green Liquidation Price Cell: Indicates that the position is considered safe from liquidation at the given parameters.
Yellow Liquidation Price Cell: Warns traders of potential liquidation risk. Exercise caution and monitor the trade closely to avoid undesirable outcomes.
Purple Liquidation Price Cell: Shows the liquidation price, but it does not necessarily indicate an imminent liquidation. Use this information to make prudent risk management decisions.
Red Row: Signals that the trade cannot be executed due to insufficient capital. Consider alternative strategies or ensure adequate capitalization before proceeding.
Settings explained:
In conclusion, the DCA Liquidation Calculator equips traders with essential tools to make well-calculated decisions, minimize liquidation risks, and optimize their Dollar Cost Averaging strategy. By offering comprehensive insights into your trading position, this indicator empowers you to navigate the markets with confidence and increase your potential for successful and sustainable trading.

TriexDev - Liquidation Rekt LevelsTriexDev - Liquidation Rekt Levels TradingView Indicator
A basic indicator which lets you see where positions will be liquidated. Each line is based on default leverage levels typically used for trading. (3x,5x,10x,25x,50x)
Have a subtle 'label prompt' on the 3x - because I had noticed some people didn't understand what labels were in other indicators.
In the settings:
- There is an offset to adjust the levels horizontally, this is to help make it easier to track if the chart has hit liquidation positions.
- You can change colours/opacity of the lines.
- You can hide the 'Labels', and/or 'label prompt'
- In the 'Style' tab you can hide individual levels.
Inspired/initially based off 'Mex Rekt Level'
I often have this added to my charts, and toggle visibility when I want to check the liq levels.
GitHub Repo for tidier/more detailed documentation as it is updated.
