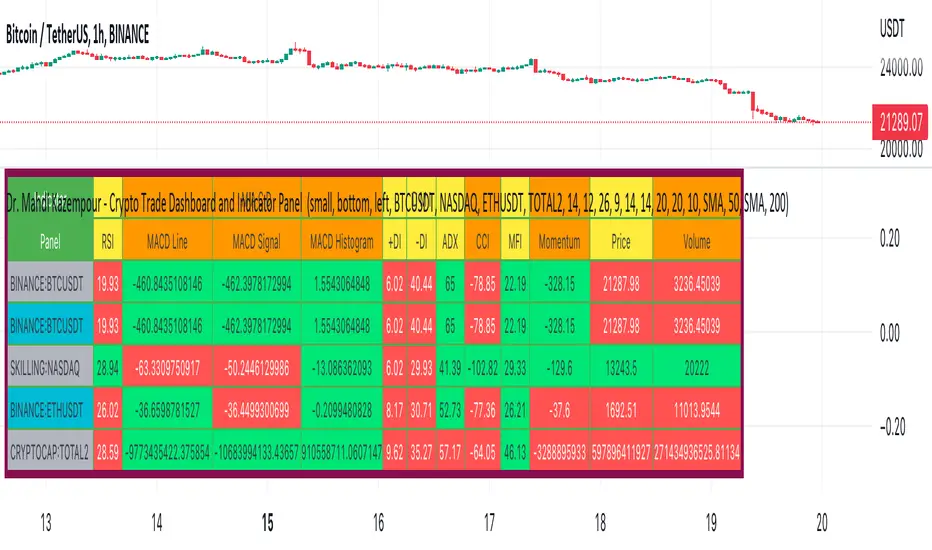
Dr. Mahdi Kazempour - Crypto Trade Dashboard and Indicator PanelA great panel for crypto traders all in one table:
Price, Volume, RSI, MACD, ADI, MOM
1) current symbol
2) BTCUSDT
3) NASDAQ
4) ETHUSDT
5) TOTAL2
"RSI MACD"に関するスクリプトを検索
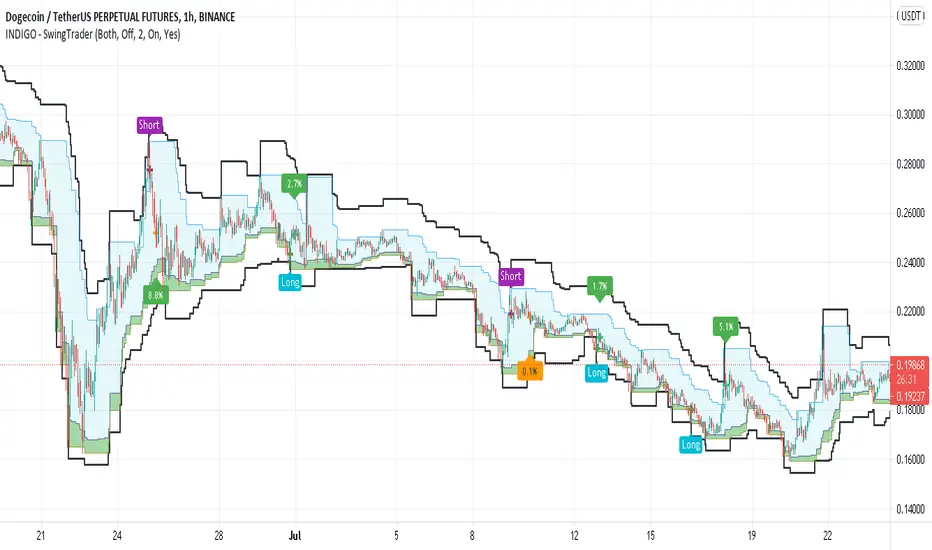
INDIGO - SwingTraderThis is a script that uses a couple of other indicators to find good swing trade entry's and exit's. You can choose which signals the script uses to calculate the position of the signals.
It uses the following:
- Stoch RSI
- MACD
- POC
- INDIGO Cloud
Also added are volume candles, acceleration of momentum indicators (triangle) and MACD candles. This way you can see more info to decide if the entry is valid.
I have used a couple of public scripts and tried to give credit to the original creators. If there is any script that hasn't been credited, please contact me.
Feedback is very much appreciated, positive and negative. Also If you have any question, feel free to ask me. I'll try to answer asap.
Enjoy the script :)
Divergence for Many Indicators v4Hello Traders,
Here is my new year gift for the community, Digergence for Many Indicators v4 . I tried to make it modular and readable as much as I can. Thanks to Pine Team for improving Pine Platform all the time!
How it works?
- On each candle it checks divergences between current and any of last 16 Pivot Points for the indicators.
- it search divergence on choisen indicators => RSI , MACD , MACD Histogram, Stochastic , CCI , Momentum, OBV, VWMACD, CMF and any External Indicator !
- it checks following divergences for 16 pivot points that is in last 100 bars for each Indicator.
--> Regular Positive Digergences
--> Regular Negative Digergences
--> Hidden Positive Digergences
--> Hidden Negative Digergences
- for positive divergences first it checks if closing price is higher than last closing price and indicator value is higher than perious value, then start searching divergence
- for negative divergences first it checks if closing price is lower than last closing price and indicator value is lower than perious value, then start searching divergence
Some Options:
Pivot Period: you set Pivot Period as you wish. you can see Pivot Points using "Show Pivot Points" option
Source for Pivot Points: you can use Close or High/Low as source
Divergence Type: you can choose Divergence type to be shown => "Regular", "Hidden", "Regular/Hidden"
Show Indicator Names: you have different options to show indicator names => "Full", "First Letter", "Don't Show"
Show Divergence Number: option to see number of indicators which has Divergence
Show Only Last Divergence : if you enable this option then it shows only last Positive and Negative Divergences
you can include any External Indicator to see if there is divergence
- enable "Check External Indicator"
- and then choose External indicator name in the list, "External Indicator"
- External indicator name is shown as Extrn
- related external indicator must be added before enabling this option
Coloring, line width and line style options for different type of divergences.
Following Alerts added:
- Positive Regular Divergence Detected
- Negative Regular Divergence Detected
- Positive Hidden Divergence Detected
- Negative Hidden Divergence Detected
Now lets see some examples:
Hidden Divergences:
Regular and Hidden Divergences together:
Showing first letters of indicators:
You can see only the number of indicators which has divergence:
You can see only divergence lines without indicators names and numbers:
option to used different label/line/text colors:
You have option to see only last divergences:
You can change Pivot Period, in following example Pivot Period = 15:
You can use Close or High/Low as Source for Divergence
You can include external indicators and get divergences on it:
Wish you all a happy new year!
Enjoy!

Divergence Histogram for Many IndicatorHello Traders,
This script analyses divergences for 11 predefined indicators and then draws column on the graph. Red columns for negatif divergence (means prices may go down or trend reversal), Lime columns for positive divergences (means prices may go up or trend reversal)
The script uses Pivot Points and on each bar it checks divergence between last Pivot Point and current High/Low and if it finds any divergence then immediately draws column. There is no Latency/Lag.
There are predefined 11 indicators in the script, which are RSI , MACD , MACD Histogram, Stochastic , CCI , Momentum, OBV, Diosc, VWMACD, CMF and MFI.
Smaller Pivot Point Period check smaller areas and if you use smaller numbers it would be more sensitive and may give alerts very often. So you should set it accordingly.
There is "Check Cut-Through in indicators" option, I recomment you to enable it. it checks that there is cut-through in indicators or not, if no cut-through then it's shown as valid divergence.
You should see following one as well if you haven't yet:
Enjoy!

Divergence for many indicator v3Hello Everyone. Almost one year later, with Pine version 4, I developed new version of the Divergence for many Indicator.
It analyses divergences for 10 predefined indicators and then draws line on the graph. Red for negatif divergence (means prices may go down or trend reversal), Lime for positive divergences (means prices may go up or trend reversal)
Divergences version 2 has latency because it waits higher time frame completion. in this new version the script uses Pivot Points and on every bar it checks divergence between last Pivot point and current bar and if it finds any then immediately draws line and removes old one. so there is no latency with this version.
There are predefined 10 indicators in the script, you have option to choose which indicators the script would analyse for divergence. (RSI , MACD , MACD Histogram, Stochastic , CCI , Momentum, OBV, Diosc, VWMACD and CMF)
In replay mode you can see how the script puts new divergence line and removes old one. you better see it for yourself by using replay mode.
Hope you Enjoy!

ANN MACD BTC v2.0 This script is the 2nd version of the BTC Deep Learning (ANN) system.
Created with the following indicators and tools:
RSI
MACD
MOM
Bollinger Bands
Guppy Exponential Moving Averages:
(3,5,8,10,12,15,30,35,40,45,50,60)
Note: I was inspired by the CM Guppy Ema script.
Thank you very much to dear wroclai for his great help.
He has been a big help in the deep learning series.
That's why the licenses in this series are for both of us.
I'm sharing these series and thats the first. Stay tuned and regards!
Note : Alerts added.

Divergences for many indicators v2.0A gift from me to all.
This script is developed to find Divergences for many indicators. it analyses divergences and then draws line on the graph. red for negatif, lime for positive divergences.
Currently script checks divergence for RSI, MACD, MACD Histogram, Stochastic, CCI, Momentum, OBV, Diosc, VWMACD and CMF indicators. You can use some or all of these indicators to check divergences as you wish by choosing them on the menu. Also you can add/remove many other indicators to the script to check if there is divergence.
The script first calculates tops/bottoms by using higher time frame zig zag and then finds divergences.
Higher Time Frames are
if currend period 1 min => HTF = 5 mins
if currend period 3 mins => HTF = 15 mins
if currend period 5 mins => HTF = 15 mins
if currend period 15 mins => HTF = 1 hour
if currend period 30 mins => HTF = 1 hour
if currend period 45 mins => HTF = 1 hour
if currend period 1 hour => HTF = 4 hours
if currend period 2 hours => HTF = 4 hours
if currend period 3 hours => HTF = 4 hours
if currend period 4 hours => HTF = 1 day
if currend period 1 day => HTF = 1 week
if currend period 1 week => HTF = 1 week
future plan : script finds regular divergences, soon I will add hidden divergences and also I plan to add alert ;)

Divergence/Convergence v1.0 [LonesomeTheBlue]The script is developed to find Divergence/Convergence for various indicators
it counts number of Divergence/Convergence and draws arrow
Arrow length changes according to number of Divergence/Convergence
that means if there is Divergence/Convergence on one indicator then arrow length = 1
if there is Divergence/Convergence on two indicator then arrow length = 2 etc.
Currently script checks Divergence/Convergence for RSI, MACD, MACD Histogram, Momentum, CMF indicators
You can add/remove many other indicators to check if there is Divergence/Convergence

Price Divergence Detector V3 revised by JustUncleLThis is a revised version of the original "Price Divergence Detector by RicardoSantos".
Description:
Price Divergence detection for various methods : RSI, MACD, STOCH, VOLUME, ACC-DIST, FISHER, CCI, BB %B and Ehlers IdealRSI. Both Hidden and Regular Divergences are detected.
Mofidifications:
Revision 3.0 by JustUncleL
Added option to disable/enable Hidden and Regular Divergence
Added new divergence method BB %B (close only)
Added new divergence mothos Ehlers IdealRSI (close only)
Revision 2.0 - by RicardoSantos
References:
Information on Divergence Trading:
www.babypips.com
www.incrediblecharts.com (BB %B)

Insync Index [LazyBear]BB Support + Histo mode
-------------------------------
Code: pastebin.com
Show enclosing BB
Show Insync as Histo:
v02 - Configurable levels
---------------------------------
Small update to allow configuring the 95/75/25/5 levels.
Latest source code: pastebin.com
v01 - orginal description
---------------------------------
Insync Index, by Norm North, is a consensus indicator. It uses RSI, MACD, MFI, DPO, ROC, Stoch, CCI and %B to calculate a composite signal. Basically, this index shows that when a majority of underlying indicators is in sync, a turning point is near.
There are couple of ways to use this indicator.
- Buy when crossing up 5, sell when crossing down 95.
- Market is typically bullish when index is above 50, bearish when below 50. This can be a great confirmation signal for price action + trend lines.
Also, since this is typical oscillator, look for divergences between price and index.
Levels 75/25 are early warning levels. Note that, index > 75 (and less than 95) should be considered very bullish and index below 25 (but above 5) as very bearish. Levels 95/5 are equivalent to traditional OB/OS levels.
The various values of the underlying components can be tuned via options page. I have also provided an option to color bars based on the index value.
More info: The Insync Index by Norm North, TASC Jan 1995
drive.google.com
List of my free indicators: bit.ly
List of my app-store indicators: blog.tradingview.com
(Support doc: bit.ly)

BB 3-Step Signals (Setup→Trigger→Target) + RSI + MACDHow it uses Upper, Middle, Lower together
Lower/Upper define the Setup with stretch + momentum agreement.
Middle is the Trigger (confirmation) via a proper cross through the basis.
Opposite Outer Band is the Target validation. If not reached within maxBarsSeq, the sequence expires.

Strong BUY/SELL with BB + RSI + MACD (with alerts)🔴 Upper BB = resistance zone → SELL setup.
🟠 Middle BB = trend filter → BUY when cross above / SELL when cross below.
🟢 Lower BB = support zone → BUY setup.
✅ Green label below candle = Confirmed BUY.

Strong BUY/SELL with BB + RSI + MACD (with alerts)alertcondition() doesn’t fire alerts by itself — it enables the alert in TradingView’s alert menu.
Once you add this script to a chart, you can go to Alerts → Create Alert → Condition → (your script name).
You’ll see BUY Signal and SELL Signal in the dropdown.
You can then choose notification type: popup, email, SMS, app push, or webhook (for bots)

Strong BUY/SELL with BB + RSI + MACDGreen BUY arrows only if score ≥ +2 and confirmed
Red SELL arrows only if score ≤ -2 and confirmed
Background shading for trend phases
Strength meter below chart for confirmation

Weekend Hunter Ultimate v6.2 Weekend Hunter Ultimate v6.2 - Automated Crypto Weekend Trading System
OVERVIEW:
Specialized trading strategy designed for cryptocurrency weekend markets (Saturday-Sunday) when institutional traders are typically offline and market dynamics differ significantly from weekdays. Optimized for 15-minute timeframe execution with multi-timeframe confluence analysis.
KEY FEATURES:
- Weekend-Only Trading: Automatically activates during configurable weekend hours
- Dynamic Leverage: 5-20x leverage adjusted based on market safety and signal confidence
- Multi-Timeframe Analysis: Combines 4H trend, 1H momentum, and 15M execution
- 10 Pre-configured Crypto Pairs: BTC, ETH, LINK, XRP, DOGE, SOL, AVAX, PEPE, TON, POL
- Position & Risk Management: Max 4 concurrent positions, -30% account protection
- Smart Trailing Stops: Protects profits when approaching targets
RISK MANAGEMENT:
- Maximum daily loss: 5% (configurable)
- Maximum weekend loss: 15% (configurable)
- Per-position risk: Capped at 120-156 USDT
- Emergency stops for flash crashes (8% moves)
- Consecutive loss protection (4 losses = pause)
TECHNICAL INDICATORS:
- CVD (Cumulative Volume Delta) divergence detection
- ATR-based dynamic stop loss and take profit
- RSI, MACD, Bollinger Bands confluence
- Volume surge confirmation (1.5x average)
- Weekend liquidity adjustments
INTEGRATION:
- Designed for Bybit Futures (0.075% taker fee)
- WunderTrading webhook compatibility via JSON alerts
- Minimum position size: 120 USDT (Bybit requirement)
- Initial capital: $500 recommended
TARGET METRICS:
- Win rate target: 65%
- Average win: 5.5%
- Average loss: 1.8%
- Risk-reward ratio: ~3:1
IMPORTANT DISCLAIMERS:
- Past performance does not guarantee future results
- Leveraged trading carries substantial risk of loss
- Weekend crypto markets have 13% of normal liquidity
- Not suitable for traders who cannot afford to lose their entire investment
- Requires continuous monitoring and adjustment
USAGE:
1. Apply to 15-minute charts only
2. Configure weekend hours for your timezone
3. Set up webhook alerts for automation
4. Monitor performance table in top-right corner
5. Adjust parameters based on your risk tolerance
This is an experimental strategy for educational purposes. Always test with small amounts first and never invest more than you can afford to lose completely.

FU + SMI Validator (Proper FU, 30m)Overview
The FU + SMI Validator is a sophisticated technical analysis indicator designed to detect Proper FU (Fakeouts or Liquidity Sweeps) on the 30-minute timeframe. This tool aims to help traders identify high-probability reversal setups that occur when price briefly breaks key levels (sweeping liquidity), then reverses with momentum confirmation.
Fakeouts are common market events where price action “hunts stops” before reversing direction. Correctly identifying these events can offer excellent entry points with defined risk. This indicator combines price action logic with momentum and volatility filters to provide reliable signals.
Core Concepts
Proper FU (Fakeout) Detection
At its core, the script identifies proper fakeouts by checking if the current bar’s price:
For bullish fakeouts: dips below the previous bar’s low (sweeping stops) and then closes above the previous bar’s high
For bearish fakeouts: spikes above the previous bar’s high and then closes below the previous bar’s low
This ensures that the breakout is a true sweep rather than just a one-sided close.
Optionally, the script can require one additional confirmation bar after the FU, ensuring that the momentum is sustained and reducing false signals.
SMI-style Momentum Validation
To improve the quality of signals, the indicator uses a proxy for the Stochastic Momentum Index (SMI) by calculating the difference between current and past linear regression slopes of price. This momentum check helps ensure that fakeouts occur alongside actual directional strength.
Key points:
Momentum must be increasing in the direction of the FU signal.
Momentum filters can be enabled or disabled based on user preference.
Squeeze Condition to Avoid Low-Volatility Traps
The script includes a volatility filter based on a squeeze-like condition:
It compares Bollinger Bands (BB) and Keltner Channels (KC).
When BB bands contract inside KC bands, the market is in a squeeze state, signaling low volatility.
Fakeouts during squeeze conditions are often unreliable; the script can filter these out to reduce false alarms.
Killzone Session Timing Filter
Recognizing that liquidity and volatility vary by session, this tool supports optional filtering for:
London Killzone: 09:00 to 10:30 (UK time)
New York Killzone: 13:00 to 14:30 (UK time)
Signals only trigger during these high-activity windows if enabled, helping traders focus on periods with the best liquidity and market participation.
Note: For Killzone filtering to work accurately, your TradingView chart must be set to the UK timezone.
Features & Benefits
Robust FU detection ensures the breakout price action is meaningful, reducing noise.
Momentum filter via linear regression slope captures trend strength in a smooth, mathematically sound way.
Low-volatility squeeze avoidance helps reduce false signals in choppy or range-bound markets.
Killzone timing filter focuses your attention on the most liquid and active market hours.
Optional confirmation bar increases signal reliability.
Raw FU markers allow visualization of all detected fakeouts for pattern recognition and manual analysis.
Alerts built-in for both valid buy and sell FU setups, enabling real-time notification and quicker decision-making.
Customization Options
Killzone usage: Enable or disable the session timing filter.
Sessions: Configure London and New York killzone time ranges.
Momentum alignment: Enable or disable momentum filter based on SMI proxy.
Volatility filter: Avoid signals during squeeze or low-volatility conditions.
FU confirmation: Option to require one additional confirming candle after the initial FU.
Squeeze and momentum parameters: Adjust Bollinger Bands length and multiplier, Keltner Channel length and ATR multiplier.
Raw FU markers: Show or hide all detected fakeouts regardless of filters.
How to Use This Indicator
Apply to 30-minute charts for forex pairs, indices, cryptocurrencies, or other instruments.
Set your chart timezone to UK time if using Killzone filters.
Adjust input parameters based on your preferred sessions and risk tolerance.
Look for green “VALID BUY FU” labels below bars for bullish fakeout entries.
Look for red “VALID SELL FU” labels above bars for bearish fakeout entries.
Use the alert system to receive notifications on setups.
Combine with your existing analysis or risk management strategy for entries, stops, and profit targets.
Why Use FU + SMI Validator?
Fakeouts are some of the most lucrative but tricky setups for many traders. Without proper filters, they can lead to false entries and losses. This script integrates price action, momentum, volatility, and session timing into one package, providing a robust tool to spot high-quality fakeout opportunities and improve trading confidence.
Limitations
Requires chart to be set to UK timezone for session filters.
Designed specifically for 30-minute timeframe — performance on other timeframes may vary.
Momentum is a proxy, not a direct SMI calculation.
Like all indicators, best used in conjunction with sound risk management and other analysis tools.
Potential Enhancements
Conversion into a full strategy script for backtesting entries and exits.
Addition of other momentum indicators (RSI, MACD) or volume filters.
Customizable time zones or auto time zone detection.
Multi-timeframe analysis capabilities.
Visual dashboard for summary of signal stats.

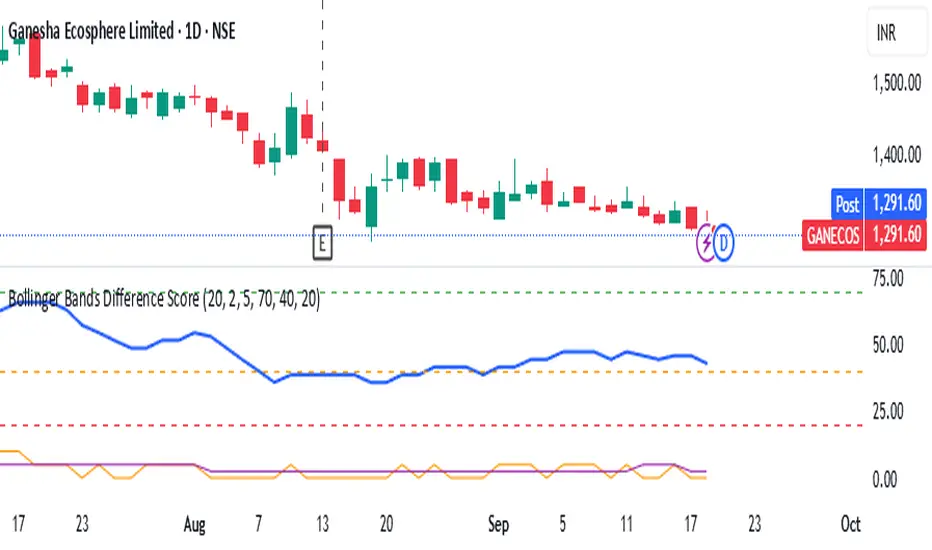
Bollinger Bands Difference Score
Bollinger Bands Difference Score (TradingView – Pine Script v6)
The **Bollinger Bands Difference Score** is a volatility-based scoring system designed to help traders quickly assess whether a stock is in a **strong trend, neutral zone, or weak setup**. It transforms the raw **Bollinger Band Width (BB-Diff)** into a **normalized score (0–100)** and classifies conditions with intuitive thresholds.
---
### 🔹 What is Bollinger Bands Difference (BB-Diff)?
* **Bollinger Bands** are built from a moving average with upper and lower bands set by standard deviations.
* The **difference (or width)** between the bands reflects market volatility.
* A **high difference** = wide bands = strong volatility (breakout/trend).
* A **low difference** = narrow bands = low volatility (consolidation).
This indicator standardizes BB-Diff into a score and smooths it for cleaner signals.
---
### 🔹 Key Features
1. **BB-Diff Scoring System**
* Converts Bollinger Band width into a **0–100 normalized score**.
* Higher score → higher volatility/trend strength.
* Lower score → consolidation or weaker momentum.
2. **Signal Levels**
* **Strong Zone (≥ 70):** Indicates strong trend strength or expansion in volatility.
* **Neutral Zone (40–70):** Sideways or undecided price action.
* **Weak Zone (≤ 20):** Suggests very low volatility, potential upcoming squeeze.
3. **Score Smoothing**
* Applies a moving average to reduce noise.
* Helps avoid false signals during choppy markets.
4. **Visual Enhancements**
* Plots the score as a line (0–100 scale).
* Adds horizontal reference lines for **Strong**, **Neutral**, and **Weak** levels.
* Background colors automatically highlight **bullish strength (green)** or **weakness (red)**.
---
### 🔹 How to Use
* **Trend Confirmation:**
Look for scores **above 70** → suggests trend continuation or volatility breakout.
* **Consolidation Watch:**
Scores in the **20 or below** zone may precede volatility squeezes → breakout setups.
* **Neutral Zone:**
Scores between **40–70** suggest sideways price action; avoid aggressive trades.
* **Combine with Price Action:**
Use with support/resistance, candlestick patterns, or momentum indicators for confirmation.
---
### 🔹 Best Practices
* Great as a **volatility filter** before entries.
* Use in combination with **RSI, MACD, or OBV** for directional bias.
* Works well for **breakout trading** (when score rises from low levels).
* Monitor on multiple timeframes for alignment.
---
✅ **In summary:** The **Bollinger Bands Difference Score** is a simple yet powerful tool that quantifies volatility strength into an actionable score, making it easier to spot strong trends, consolidation phases, and potential breakout opportunities.
HeatCandleHeatCandle - AOC Indicator
✨ Features
📊 Heat-Map Candles: Colors candles based on the price’s deviation from a Triangular Moving Average (TMA), creating a heat-map effect to visualize price zones.
📏 Zone-Based Coloring: Assigns colors to 20 distinct zones (Z0 to Z19) based on the percentage distance from the TMA, with customizable thresholds.
⚙️ Timeframe-Specific Zones: Tailored zone thresholds for 1-minute, 5-minute, 15-minute, 30-minute, 1-hour, and 4-hour timeframes for precise analysis.
🎨 Customizable Visuals: Gradient color scheme from deep blue (oversold) to red (overbought) for intuitive price movement interpretation.
🛠️ Adjustable Parameters: Configure TMA length and threshold multiplier to fine-tune sensitivity.
🛠️ How to Use
Add to Chart: Apply the "HeatCandle - AOC" indicator on TradingView.
Configure Inputs:
TMA Length: Set the period for the Triangular Moving Average (default: 150).
Threshold Multiplier: Adjust the multiplier to scale zone sensitivity (default: 1.0).
Analyze: Observe colored candles on the chart, where colors indicate the price’s deviation from the TMA:
Dark blue (Z0) indicates strong oversold conditions.
Red (Z19) signals strong overbought conditions.
Track Trends: Use the color zones to identify potential reversals, breakouts, or trend strength based on price distance from the TMA.
🎯 Why Use It?
Visual Clarity: The heat-map candle coloring simplifies identifying overbought/oversold conditions at a glance.
Timeframe Flexibility: Zone thresholds adapt to the selected timeframe, ensuring relevance across short and long-term trading.
Customizable Sensitivity: Adjust TMA length and multiplier to match your trading style or market conditions.
Versatile Analysis: Ideal for scalping, swing trading, or trend analysis when combined with other indicators.
📝 Notes
Ensure sufficient historical data for accurate TMA calculations, especially with longer lengths.
The indicator is most effective on volatile markets where price deviations are significant.
Pair with momentum indicators (e.g., RSI, MACD) or support/resistance levels for enhanced trading strategies.
Happy trading! 🚀📈

Structure Strategycreated to spot key area needed to take valid trades in most market conditions. use beside RSI MACD

Moving Average Signals : Support ResistanceThis indicator plots a Simple Moving Average (default 50-period, adjustable) and highlights potential bounce or rejection signals when price interacts with the SMA.
It is designed to identify moments when price tests the moving average from one side and then continues in the prior direction, signaling a possible continuation trade.
🔴 Red Triangle (Bearish Rejection)
A red triangle is plotted above the bar when:
Price has been trading below the SMA.
Price tests the SMA from below (the high touches or pierces the SMA but closes back below it).
Price then continues lower on the next bar.
This suggests the SMA acted as resistance and the downtrend may resume.
🟢 Green Triangle (Bullish Rejection)
A green triangle is plotted below the bar when:
Price has been trading above the SMA.
Price tests the SMA from above (the low touches or pierces the SMA but closes back above it).
Price then continues higher on the next bar.
This suggests the SMA acted as support and the uptrend may resume.
⚡ HOW TO USE IN TRADING
Trend Confirmation
Use this indicator in trending markets (not choppy ranges).
A rising SMA suggests bullish trend bias; a falling SMA suggests bearish trend bias.
Signal Entry
Green Triangle: Consider long entries when the SMA supports price and a bullish continuation is signaled.
Red Triangle: Consider short entries when the SMA rejects price and a bearish continuation is signaled.
Stop-Loss Placement
Place stops just beyond the SMA or the rejection candle’s high/low.
Example: For a red signal, stop above the SMA or rejection candle’s high.
Take-Profit Ideas
Target prior swing highs/lows or use risk/reward multiples (e.g., 2R, 3R).
You can also trail stops behind the SMA in a strong trend.
Filters for Higher Accuracy (optional)
Confirm signals with volume, momentum indicators (e.g., RSI, MACD), or higher-timeframe trend.
Avoid trading signals against strong higher-timeframe bias.

Gann Fan Strategy [KedarArc Quant]Description
A single-concept, rule-based strategy that trades around a programmatic Gann Fan.
It anchors to a swing (or a manual point), builds 1×1 and related fan lines numerically, and triggers entries when price interacts with the 1×1 (breakout or bounce). Management is done entirely with the fan structure (next/previous line) plus optional ATR trailing.
What TV indicators are used
* Pivots: `ta.pivothigh/ta.pivotlow` to confirm swing highs/lows for anchor selection.
* ATR: `ta.atr` only to scale the 1×1 slope (optional) and for an optional trailing stop.
* EMA: `ta.ema` as a trend filter (e.g., only long above the EMA, short below).
No RSI/MACD/Stoch/Heikin/etc. The logic is one coherent framework: Gann price–time geometry, with ATR as a scale and EMA as a risk filter.
How it works
1. Anchor
* Auto: chooses the most recent *confirmed* pivot (you control Left/Right).
* Manual: set a price and bar index and the fan will hold that point (no re-anchoring).
* Optional Re-anchor when a newer pivot confirms.
2. 1×1 Slope (numeric, not cosmetic)
* ATR mode: `1×1 = ATR(Length) × Multiplier` (adapts to volatility).
* Fixed mode: `ticks per bar` (constant slope).
Because slope is numeric, it doesn’t change with chart zoom, unlike the drawing tool.
3. Fan Lines
Builds classic ratios around the 1×1: 1/8, 1/4, 1/3, 1/2, 1/1, 2/1, 3/1, 4/1, 8/1.
4. Signals
* Breakout: cross of price over/under the 1×1 in the EMA-aligned direction.
* Bounce (optional): touch + reversal across the 1×1 to reduce whipsaw.
5. Exits & Risk
* Take-profit at the next fan line; Stop at the previous fan line.
* If a level is missing (right after re-anchor), a fallback Risk-Reward (RR) is used.
* Optional ATR trailing stop.
Why this is unique
* True numeric fan: The 1×1 slope is calculated from ATR or fixed ticks—not from screen geometry—so it is scale-invariant and reproducible across users/timeframes.
* Deterministic anchor logic: Uses confirmed pivots (with your L/R settings). No look-ahead; anchors update only when the right bars complete.
* Fan-native trade management: Both entries and exits come from the fan structure itself (with a minimal ATR/EMA assist), keeping the method pure.
* Two entry archetypes: Breakout for momentum days; Bounce for range days—switchable without changing the core model.
* Manual mode: Lock a session’s bias by anchoring to a chosen swing (e.g., day’s first major low/high) and keep the fan constant all day.
Inputs (quick guide)
* Auto Anchor (Left/Right): pivot sensitivity. Higher values = fewer, stronger anchors.
* Re-anchor: refresh to newer pivots as they confirm.
* Manual Anchor Price / Bar Index: fixes the fan (turn Auto off).
* Scale 1×1 by ATR: on = adaptive; off = use ticks per bar.
* ATR Length / ATR Multiplier: controls adaptive slope; start around 14 / 0.25–0.35.
* Ticks per bar: exact fixed slope (match a hand-drawn fan by computing slope ÷ mintick).
* EMA Trend Filter: e.g., 50–100; trades only in EMA direction.
* Use Bounce: require touch + reverse across 1×1 (helps in chop).
* TP/SL at fan lines; Fallback RR for missing levels; ATR Trailing Stop optional.
* Transparency/Plot EMA: visual preferences.
Tips
* Range days: larger pivots (L/R 8–12), Bounce ON, ATR Multiplier \~0.30–0.40, EMA 100.
* Trend days: L/R 5–6, Breakout, Multiplier \~0.20–0.30, EMA 50, ATR trail 1.0–1.5.
* Match the TV Gann Fan drawing: turn ATR scale OFF, set ticks per bar = `(Δprice between anchor and 1×1 target) / (bars) / mintick`.
Repainting & testing notes
* Pivots require Right bars to confirm; anchors are set after confirmation (no look-ahead).
* Signals use the current bar close with TradingView strategy mechanics; real-time vs. bar-close can differ slightly, as with any strategy.
* Re-anchoring legitimately moves the structure when new pivots confirm—by design.
⚠️ Disclaimer
This script is provided for educational purposes only.
Past performance does not guarantee future results.
Trading involves risk, and users should exercise caution and use proper risk management when applying this strategy.

Advanced Range Analyzer ProAdvanced Range Analyzer Pro – Adaptive Range Detection & Breakout Forecasting
Overview
Advanced Range Analyzer Pro is a comprehensive trading tool designed to help traders identify consolidations, evaluate their strength, and forecast potential breakout direction. By combining volatility-adjusted thresholds, volume distribution analysis, and historical breakout behavior, the indicator builds an adaptive framework for navigating sideways price action. Instead of treating ranges as noise, this system transforms them into opportunities for mean reversion or breakout trading.
How It Works
The indicator continuously scans price action to identify active range environments. Ranges are defined by volatility compression, repeated boundary interactions, and clustering of volume near equilibrium. Once detected, the indicator assigns a strength score (0–100), which quantifies how well-defined and compressed the consolidation is.
Breakout probabilities are then calculated by factoring in:
Relative time spent near the upper vs. lower range boundaries
Historical breakout tendencies for similar structures
Volume distribution inside the range
Momentum alignment using auxiliary filters (RSI/MACD)
This creates a live probability forecast that updates as price evolves. The tool also supports range memory, allowing traders to analyze the last completed range after a breakout has occurred. A dynamic strength meter is displayed directly above each consolidation range, providing real-time insight into range compression and breakout potential.
Signals and Breakouts
Advanced Range Analyzer Pro includes a structured set of visual tools to highlight actionable conditions:
Range Zones – Gradient-filled boxes highlight active consolidations.
Strength Meter – A live score displayed in the dashboard quantifies compression.
Breakout Labels – Probability percentages show bias toward bullish or bearish continuation.
Breakout Highlights – When a breakout occurs, the range is marked with directional confirmation.
Dashboard Table – Displays current status, strength, live/last range mode, and probabilities.
These elements update in real time, ensuring that traders always see the current state of consolidation and breakout risk.
Interpretation
Range Strength : High scores (70–100) indicate strong consolidations likely to resolve explosively, while low scores suggest weak or choppy ranges prone to false signals.
Breakout Probability : Directional bias greater than 60% suggests meaningful breakout pressure. Equal probabilities indicate balanced compression, favoring mean-reversion strategies.
Market Context : Ranges aligned with higher timeframe trends often resolve in the dominant direction, while counter-trend ranges may lead to reversals or liquidity sweeps.
Volatility Insight : Tight ranges with low ATR imply imminent expansion; wide ranges signal extended consolidation or distribution phases.
Strategy Integration
Advanced Range Analyzer Pro can be applied across multiple trading styles:
Breakout Trading : Enter on probability shifts above 60% with confirmation of volume or momentum.
Mean Reversion : Trade inside ranges with high strength scores by fading boundaries and targeting equilibrium.
Trend Continuation : Focus on ranges that form mid-trend, anticipating continuation after consolidation.
Liquidity Sweeps : Use failed breakouts at boundaries to capture reversals.
Multi-Timeframe : Apply on higher timeframes to frame market context, then execute on lower timeframes.
Advanced Techniques
Combine with volume profiles to identify areas of institutional positioning within ranges.
Track sequences of strong consolidations for trend development or exhaustion signals.
Use breakout probability shifts in conjunction with order flow or momentum indicators to refine entries.
Monitor expanding/contracting range widths to anticipate volatility cycles.
Custom parameters allow fine-tuning sensitivity for different assets (crypto, forex, equities) and trading styles (scalping, intraday, swing).
Inputs and Customization
Range Detection Sensitivity : Controls how strictly ranges are defined.
Strength Score Settings : Adjust weighting of compression, volume, and breakout memory.
Probability Forecasting : Enable/disable directional bias and thresholds.
Gradient & Fill Options : Customize range visualization colors and opacity.
Dashboard Display : Toggle live vs last range, info table size, and position.
Breakout Highlighting : Choose border/zone emphasis on breakout events.
Why Use Advanced Range Analyzer Pro
This indicator provides a data-driven approach to trading consolidation phases, one of the most common yet underutilized market states. By quantifying range strength, mapping probability forecasts, and visually presenting risk zones, it transforms uncertainty into clarity.
Whether you’re trading breakouts, fading ranges, or mapping higher timeframe context, Advanced Range Analyzer Pro delivers a structured, adaptive framework that integrates seamlessly into multiple strategies.
