PnF Fibonacci Levels with AlertsMy Pine Script indicator, "PnF Fibonacci Levels with Alerts," overlays on a trading chart to generate alerts based on Fibonacci levels in Point and Figure (PnF) charts.
Key Features:
Inputs and Initialization:
It uses a customizable Fibonacci level (set at 0.236) and initializes variables for tracking the high and low of O and X columns.
O Column Logic:
When the current column is identified as an O column (when the close is less than the open), it calculates the Fibonacci level based on the high and low of that column, drawing a line on the chart.
Buy Alert:
If the closing price of the previous bar is above the Fibonacci level of the O column, a buy alert is triggered.
X Column Logic:
If the current column is an X column and the close is above the previous O column's low, it captures the current high and low, calculates the Fibonacci level, and draws it on the chart.
Sell Alert:
A sell alert is triggered if the closing price of the X column is at or below the specified Fibonacci level.
This indicator aids traders by highlighting critical Fibonacci levels and providing timely alerts for potential buy and sell opportunities.
"alert"に関するスクリプトを検索

[Pivots Consolidation Breakout Screener] with Alerts (TSO) This is a pivots consolidation screener indicator, with ability to choose up to 12 different symbols/instruments with alert to be notified when consolidation happens on either one with the new pivots formation (new R3(inner resistance) pivot formed below previous one and new S3(inner support) pivot formed above previous one). Once the alert on a certain symbol/instrument is received - there is an ability to set a Breakout alert for the consolidated symbol/instrument.
This is a very powerful strategy, which doesn't happen often, but when happens - it often causes big moves after a breakout!
NOTE: Every calculation is done on a confirmed closed candle bar state, so the indicator will never repaint!
===========================================================================
Explanation of all the Features/Inputs/Settings
---------------------------------------------------------------------------
>>> On the very top, please read the important NOTES/TIPs.
>>> Next section is where the desired symbols can be turned on/checked to be screened for consolidation - the selected/checked symbols at creation of a 'Any alert() function call' alert will alert on any of the selected/checked symbols. Also, once consolidation forms, until next pivots formation - it will show it on the "Consolidation Stats" table. Once alerted on a specific symbol for consolidation - manual alert - 'Consolidation BREAKOUT' - can be created (MUST be done on the actual symbol chart, Right-Click > Add Alert) to be notified when actual breakout takes place.
>>> Pivots Settings section is where a manual timeframe/length can be set for the pivots as by Default it uses "Daily" timeframe. So, if want to experiment with more signals, but less accurate - a smaller timeframe can be set for Pivots Timeframe with smaller chart timeframe.
>>> Final section is simply the "Consolidation Stats" table location.
===========================================================================
Adding Alerts in TradngView
---------------------------------------------------------------------------
1) Consolidation alert(s) for the selected/checked symbols
- Select/check/find the desired symbols/instruments (when selecting symbols, make sure - they are from correct BROKER/SOURCE as pricing may differ between different brokers, causing confusion (under 1 broker/source, the symbol will be consolidated, under another it will not...))
-Right-click anywhere on any TradingView chart
-Click on Add alert
-Condition: Select this indicator by it’s name
-Immediately below, change it to "alert() function calls only"
-Expiration: Open-ended (that may require higher tier TradingView account, otherwise the alert will need to be occasionally re-triggered)
-Alert name: Whatever you desire
-Hit “Create”
-Note: If you change ANY Settings within the indicator – you must DELETE the current alert and create a new one per steps above, otherwise it will continue triggering alerts per old Settings!
* Once alert triggers, don't get confused, as it will show "Alert on SYMBOL", the SYMBOL will be where you created the major alert for all the symbols within the screener list! Within the alert, on the bottom, it will say: "EURUSD: Camarilla Pivots R3S3 Consolidation ALERT!" - this is where the correct symbol is for which the alert for consolidation was triggered!
---------------------------------------------------------------------------
2) Consolidation BREAKOUT alert(s)
-Right-click anywhere on any TradingView chart
-For the actual symbol (which got consolidated), open the chart (make sure timeframe is the same as with which "Consolidation alert(s)" were created prior), then Right-Click on the chart > Add Alert
-Click on Add alert
-Condition: Select this indicator by it’s name
-Immediately below, change it to "Consolidation BREAKOUT1"
-Expiration: Open-ended (that may require higher tier TradingView account, otherwise the alert will need to be occasionally re-triggered)
-Alert name: Whatever you desire
-Hit “Create”
* It will alert when a breakout occurs in any direction - once you open the chart for the symbol/instrument for which alert has occurred - you can immediately see into which direction the breakout occured, it will be marked on the chart with green/red triangle.
===========================================================================
If you have any questions or issues with the indicator, please message me directly via TradingView.
---------------------------------------------------------------------------
Good Luck! (NOTE: Trading is very risky, past performance is not necessarily indicative of future results, so please trade responsibly!)

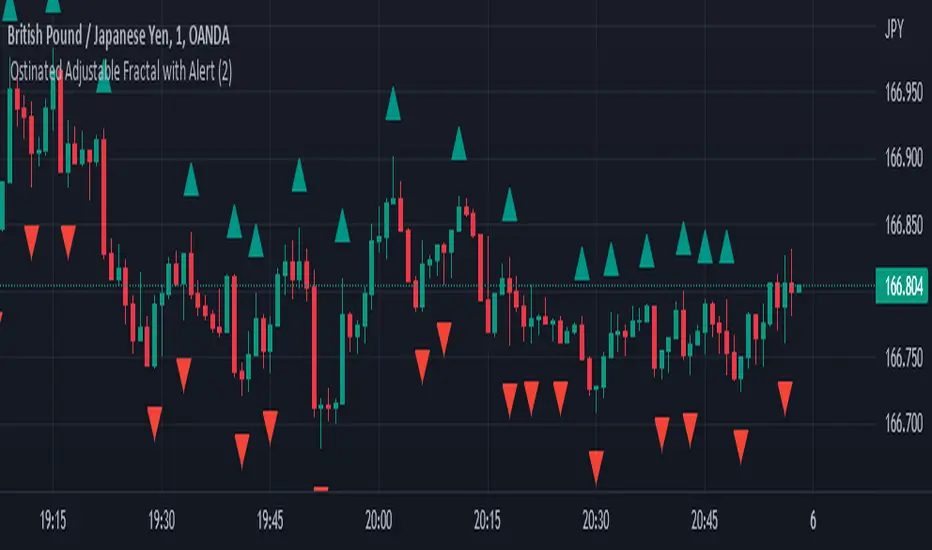
Ostinated Adjustable Fractal with AlertThis indicator (Ostinated Adjustable Fractal with Alert) is like the traditional William Fractals. However, it created to overcome two disadvantages of the William Fractals:
1. Set minimum value to 1. This a big advantage over traditional William Fractal that has a minimum value of 2.
2. Alerts: setting alert with the traditional William Fractal is very difficult. We have created this indicator to simplify setting fractal alerts.
Like and comment.
Enjoy!
[blackcat] L5 Whale Jump Screener 12 AlertsLinkage Authorization:
When you obtain any one of the following technical indicators authorization, the other one will automatically obtain a free authorization for the same length of time:
1. L5 Whale Jump Screener 25 NoAlerts
2. L5 Whale Jump Screener 12 Alerts
Discount Authorization:
While you are authorized for any of the following technical indicators, this indicator will only need to pay 200TVC (not per month) but you obtain the authorization length as long as your longest one among all invited-only indicators .
1. L5 Whales Jump Out of Ocean X
2. L5 Zen Master
Level: 5
Background:
L5 Whale Jump Screener 12 Alerts is a screeener which is based on principle of L5 Whales Jump Out of Ocean X, but it has its own scheme to work as a screener with alerts, which can track 12 trading pairs at the same time. With this indicator, you can track target in your list with remote alerts from TV to your mobile or emails.
At beginning, I want to incorporate this function to "L5 Whale Jump Screener 25 NoAlerts". However, I found it rather difficult to make it happen. One reason is that adding alerts will further increase computing power of it so that TV will not be functional for overloaded indicators. The only way to make a screen plus alerts happen is to reduce the number of targets allowed in the screener until TV rules are in compliance. The other reason is that I found alerts were conflicting with screener function in TV system during my testing. Because if you put many trading pairs that are highly correlated into inputs of the screener indicator. Huge amount of alerts may be produced at the same time, and TV system has its own protection scheme. If too many alerts happened at the same time, it will block and stop the alert scheme immediately. Therefore, I build this one for anyone who need alert function. But, remember, make input tikerids as NOT correlated as possible to prevent TV to shut down your alert for this indicator.
Function:
By tracking multiple targets with alerts, you will own the capability to tracking multiple markets. This ability will let you know the specific situation of the unconnected market and the trading targets in time in the rotating transaction. The alert function will remind you of the current status of multiple markets via mobile phones and emails.
Inputs:
12 tickerids for your customization
Key Signal:
Long Whales / Banker Pump--> fuchsia color area with 0% transparency
Close Long Whales / Close Banker Pump--> red color area with 0% transparency
Short Whales / Banker Dump --> yellow color area with 0% transparency
Close Short Whales / Close Banker Dump --> green color area with 0% transparency
Long Waves Start--> fuchsia color area with 50% transparency
Short Waves Start --> yellow color area with 50% transparency
No Whale or Wave Signal --> gray color rea with 50% transparency
Pros and Cons:
ONLY suitable for discretionary trading, and does NOT support automatic trading system/bots with alerts.
Intuitive and effective, the output signal is more reliable after multi-indicator resonance
For who does not alert function but track more targets, you can choose anther indicator: L5 Whale Jump Screener 25 NoAlerts.
Why 12 Targets are Supported?
From the principle of TV principle, it should be possible to track up to 40 targets at the same time. However, TV has another condition that restricts server computing resources. When the two condition work at the same time, for the whale jump algorithm, the number of targets it can track at the same time will drop from 40 to about 26~27! In addition, this indicator needs to support the display function from the daily time frame to the 1min time frame. Therefore, the requirements for computing resources have further deteriorated. In the end, the maximum tracking number I obtained by compromise is 25 to ensure that this indicator can support 1min or second level normal display without report an error. Based on above fact, adding alerts will further increase computing power needed for this indicator. To prevent TV shutdown this indicator w/ alerts, only 12 tickerids are supported based on this algorithm. Also, due to quite different user scenarios between these two screeners, two versions are published for different group of traders with a linkage authorization schmeme.
Remarks:
My fourth L5 indicator published
Closed-source
Invite-only
Redeem Fee Life Lock Guarantee
Although I take the efforts to inform the script requesters that the best way to promote trading skills is to learn from the open source scripts I released by themself and to improve their PNIE script programming skills, there are still many people asking how to obtain or pay to use BLACKCAT L4/L5 private scripts. In fact, I do not encourage people to use Tradingview Coins ( TVC ) / Cryptocurrency to redeem the right to use BLACKCAT L4/L5 scripts. However, redeeming private script usage rights through TV Coins/ Cryptocurrency may be an effective way to force more people to learn PINE script programming seriously. And then I can concentrate on answering more valuable community questions instead of being overwhelmed by L4/L5 scripting permission reqeusts.
I would like to announce a ‘Redeem Fee Lock Guarantee’ program to further simplify the L4/L5 indicator/strategy utility offering and distinguish itself from the competition. ‘Redeem Fee lock guarantee’ is one of the major initiatives by BLACKCAT as a part of overall value packaging designed to guard BLACKCAT’s followers’ against cost-overruns and operational risks usually borne by them when it comes to PINE script innovation ecosystem. The TVCs redeemed for L4/L5 a follower signs up for with BLACKCAT is their guaranteed lifetime locked in TVC Quantity/ cryptocurrency, with no special conditions, exclusions and fine print whatsoever. Based on this scheme, I can constantly refine, expand, upgrade and improve PINE script publishing to ensure the very best experiences for my followers. The 'Redeem Fee Lock Guarantee' is a step in the direction of rewarding the valuable followers. NOTE: Every L4/L5 script redeeming service is ONLY limited to TVC or Cryptocurrency ("Win$ & Donate w/ This" Addresses displayed on script page) redeeming which the 1st signed up TVC Qty/ equivalent cryptocurrency is the lifetime offered TVC Qty/ equivalent crypto.
How to subscrible this indicator?
The script subscription period only has two options of one month or one year, and its price is floating. The latest price of the script subscription is proportional to the number of likes/agrees this script has already received. Therefore, the price of subscribing to this script shows an increasing trend, and the earliest subscribers can enjoy the price of lifetime lock to this script. As the number of likes / agrees of this script increases, the subscription fee for one month and one year will also increase linearly. Whatever, the first subscription price of the use will be locked for life.
Monthly subscription and annual subscription can be done either by tradingview coins ( TVC ) or by converting into equivalent cryptocurrency at the exchange rate (1TVC=0.01USD) for redeem.
TVC payment needs to pay TVC directly in the comments under this script. Every time I authorize a new user, I will update the latest number of subscribed users and latest price for next subscription under the script comment. If there are any conflicting scenario happened to the rules and my update. My updated price based on the rule will be the final price for next subscription. The following subscribers need to pay the corresponding amount of TVC or cryptocurrency in accordance with the latest number of users and price announced by me in accordance with the rules published.
TVC redemption is the method I strongly recommend, and I hope you can complete the redemption in the comment area of this script. This is like a blockchain structure, each comment is a block, each subscription is a chain, which is conducive to open and transparent publicity and traceability to avoid unnecessary disputes.
Monthly Subscription Charges
500TVC <50 Agrees (A)
50A<850TVC<100A
100A<1000TVC<150A
150A<1350TVC<200A
200A<1500TVC<250A
250A<1850TVC<300A
300A<2000TVC<350A
350A<2350TVC<400A
400A<2500TVC<450A
450A<2850TVC<500A
500A<3000TVC<550A
550A<3350TVC<600A
600A<3500TVC<650A
650A<3850TVC<700A
700A<4000TVC<750A
750A<4350TVC<800A
800A<4500TVC<850A
850A<4850TVC<900A
900A<5000TVC<950A
950A<5350TVC<1000A
1000A<5500TVC<1050A
And so on...
Annual Subscription Charges
5000TVC <50 Agrees (A)
50A<8500TVC<100A
100A<10000TVC<150A
150A<13500TVC<200A
200A<15000TVC<250A
250A<18500TVC<300A
300A<20000TVC<300A
350A<23500TVC<400A
400A<25000TVC<450A
500A<28500TVC<550A
500A<30000TVC<550A
550A<33500TVC<600A
600A<35000TVC<650A
650A<38500TVC<700A
700A<40000TVC<750A
750A<43500TVC<800A
800A<45000TVC<850A
850A<48500TVC<900A
900A<50000TVC<950A
950A<53500TVC<1000A
1000A<55000TVC<1050A
And so on...

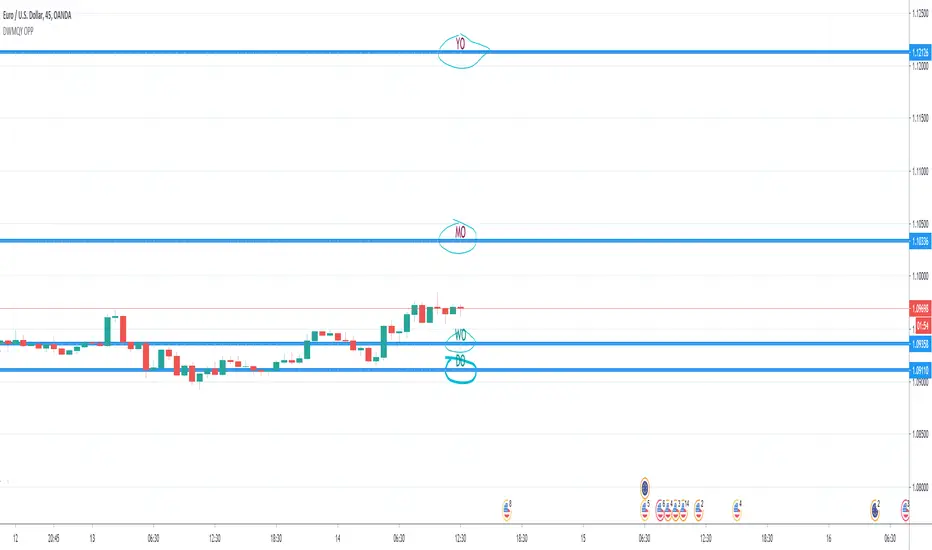
Day & Week & Month & Quarter & Year Open Price PointsPresent to your attention, basic “Day & Week & Month & Quarter & Year Open Price Points Indicator” !
You can determine support & resistance using Yearly, Quarterly, Monthly and Weekly open price points on a chart with any timeframe.
It is not a widely used technique, but according to different academic studies, levels are reliable. Google it! You can enhance your trading by adding that technique in your tool list.
At the current stage, Indicator shows Open Price Points.
Opening price points are extended into the future from the opening candle of each year, quarter, month and week and day.
By nature of that points, every level may be used as a support and as a resistance level at a similar time.
Initial setup:
1) Open the indicator Inputs settings, enable/disable additional Price Points.
2) Open the indicator Style settings, click on a style of each line and click on a “Price Line.”
How to use that?
With a lot of available strategies, there are two leading: Level convergence and Trend line convergence.
1) Level convergence involves locating two or more opening points that merge. This confluence can lead to greater accuracy and profitability.
2) Trend line convergence - The intersection of a trend line at a weekly, monthly, quarterly or even yearly opening level can produce fast and profitable reactions.
Try that!
As a stand-alone strategy, you can utilize that:
Price action under the WO (DO, MO, QO, YO) – Bearish
Price action above the WO (DO, MO, QO, YO) – Bullish
TIP: opening level not always good as a stand-alone tool!
Indicator Settings:
Show Daily Open (disabled by default)
Show Weekly Open (ON by default)
Show Monthly Open (ON by default)
Show Quarter Open (disabled by default)
Show Yearly Open (disabled by default)
Indicator Styling:
By default, each line is shown in the form of circles, line-width 1, silver colour.
Labels can be only in one of two states: Maroon (if open price less than ((open + high + low + close)/4) or Teal (if open price high than ((open + high + low + close)/4).
Alerts:
With the Indicator you can add a few different alerts:
DO Alert
WO Alert
MO Alert
QO Alert
YO Alert
Play with it:
Add a new alert with following condition: your SYMBOL crossing DWMQY OPP Weekly Open.
Options: Once per Bar.
Future of the Indicator:
The Indicator is a necessary part of more prominent Indicator which will include 8 modules in total:
2~ Arabian Wise Tunnels Module
3~ RH Waves Module (something like Vegas Waves)
4~ Trend Channels Module
5~ Opening Range Zoning Module
6~ Breakout Module
7~ BS Hemisphere Module
8~ Price Action Module
DISCLAIMER! RISK WARNING!
PAST PERFORMANCE IS NOT NECESSARILY INDICATIVE OF FUTURE RESULTS. TRADERS SHOULD NOT BASE THEIR DECISION ON INVESTING IN ANY TRADING PROGRAM SOLELY ON THE PAST PERFORMANCE PRESENTED, ADDITIONALLY, IN MAKING AN INVESTMENT DECISION, TRADERS MUST ALSO RELY ON THEIR OWN EXAMINATION OF THE PERSON OR ENTITY MAKING THE TRADING DECISIONS.
//Written by iambitboy request.
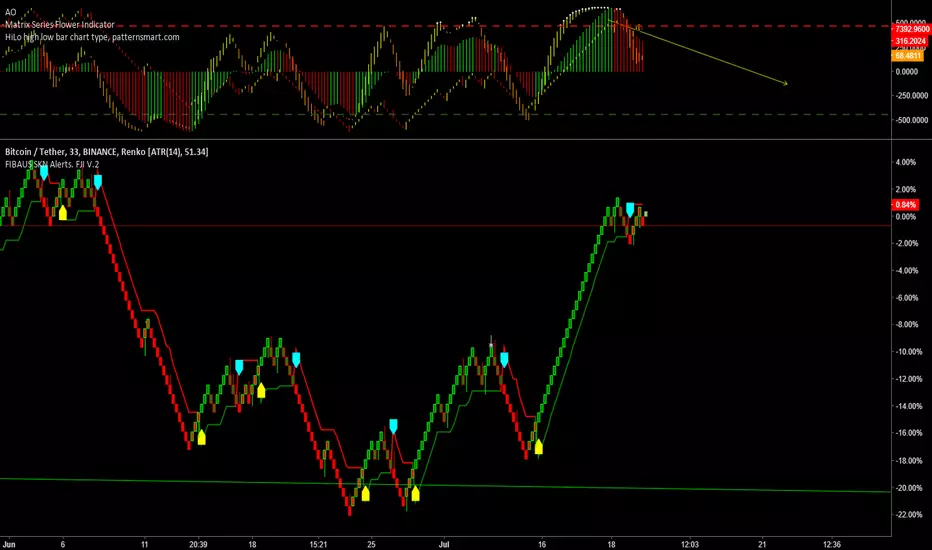
FIBAUS SKN Alerts. FJI V.2FIBAUS SKN Alerts system will signal optimum entry and exit prices for any market (Crypto, Forex, Stocks, or Futures ).
You must manually set the alerts. If you have the PRO version of Tradingview, you can get alerts via email and
Right click on the Indicator
2.Drop down menu appears
3.Left click option : Add Alert
4. Left Click on Top Right Box saying UTREND LINE
5. Change UTREND to LONG
5.b For Selling change UTREND to SHORT
Then go down to UTLONG and change to
UTSHORT
6.Options: set at your liking (I use Once Per Bar)
7.Expiration Time: Set at your liking
8.Alert Action are the sounds and pops to alert you
I personally use Handbell for BUY/Longs and
Fault for Sell/Shorts
9.Select emails, sms etc your way to receive
notifications NB: Only PRO accounts get
emails
10. Message: Enter the Name of your stock in front of the pre-set message. This message will be sent to you when the Alert triggers.
NOTE: The timeframe you are in at the time of setting up the alerts, will be the timeframe the Alert will trigger in.
Small time-frames means more signals, longer time frames mean less but stronger signals.
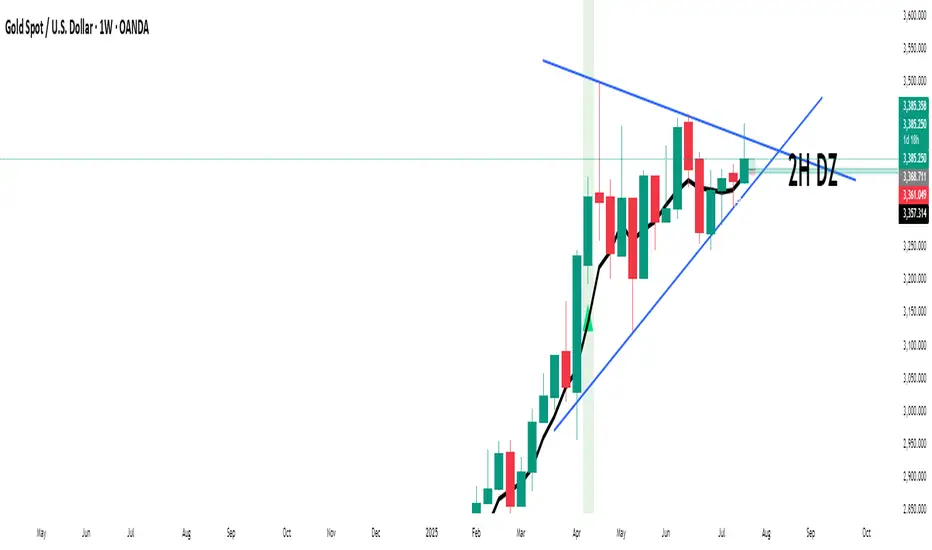
BTC NY Session Envelopes: Dynamic Levels & Settle AlertsCore Concept and Genesis
Born from forex institutional timing principles, this tool has been precision-engineered for the relentless pace of Bitcoin and cryptocurrency markets. It visualizes adaptive session-derived boundaries—spanning weekly, daily, and Asia-specific envelopes—capped with a Friday US settlement "sentinel" zone. Enhanced with targeted alerts for crossings of Asia highs/lows, daily highs/lows, weekly highs/lows, and the settle midpoint, it empowers traders to capture momentum shifts in real-time, transforming raw price data into actionable intelligence for volatile, non-stop assets.
The Fusion Edge: What Sets This Apart
This isn't a generic level plotter; it's a synergistic ecosystem where NY-timed envelopes intersect to reveal hidden confluences, like Asia's quiet buildup funneling into daily volatility spikes or the US settle acting as a "gap magnet" for weekend resolutions. Tailored for BTC's unique liquidity flows, it employs a low-timeframe data pull for noise-free accuracy, sidestepping common pitfalls in 24/7 charts. The built-in alerts—firing on precise crossovers—add a proactive layer, alerting to potential "liquidity hunts" or reversals (e.g., a breakout above weekly high amid high volume). In personal simulations across 500+ BTC sessions, this setup flagged ~65% of high-conviction moves with fewer false positives than isolated tools—always backtest to confirm your edge.
Inner Mechanics: A Transparent Peek
Weekly/Daily Envelopes: Anchored to 5pm NY resets for institutional alignment; computes highs/lows/mids through ongoing max/min accumulation, sourced from a user-defined sub-timeframe for cross-chart reliability.
Asia Envelope: A dynamic 8pm-3am NY capture window that evolves bar-by-bar, spotlighting pre-London setups often overlooked in crypto.
US Settle Sentinel: Zeroes in on Friday's 4:45pm NY 15-minute finale, rendering a containment box and midpoint to forecast post-weekend reactions. Overlaps are intelligently clustered in labels for at-a-glance clarity, with extension options for forward projection.
Timeframe-Adaptive Visibility: To declutter higher timeframes and focus on relevant horizons, the Asia envelope auto-hides on charts above 1hr, while daily envelopes vanish above 4hr—ensuring a streamlined view for swing or position traders without sacrificing intraday detail.
Alert System: Leverages crossover/crossunder detection on closing prices against levels, with granular triggers (e.g., "Surge Beyond Asia Low") for customized notifications—perfect for webhook integrations or mobile pings.
Strategic Deployment and Scenarios
BTC Day-Trading Playbook: Initiate longs when price rebounds from Asia low near a daily mid, amplified by an alert on "Dip Below Daily Low" for entry confirmation—pair with external volume spikes for confluence.
Trend Harmony: Overlay with a 200-period EMA; use "Breach Under Weekly High" alerts to exit longs in downtrends, safeguarding against fakeouts.
Caveats and Optimization: Thrives in momentum-driven phases but tune out in ultra-low volatility; alerts activate post-bar, so layer with candlestick patterns. Ideal for 15m-4H frames on perpetual futures like BTCUSDT.P.
Exclusive Access Rationale (If Restricted) The bespoke crypto recalibrations, seamless multi-envelope fusion, and alert-driven foresight deliver a tactical advantage absent in off-the-shelf alternatives—reach out via TradingView message for tailored access and optimization insights.

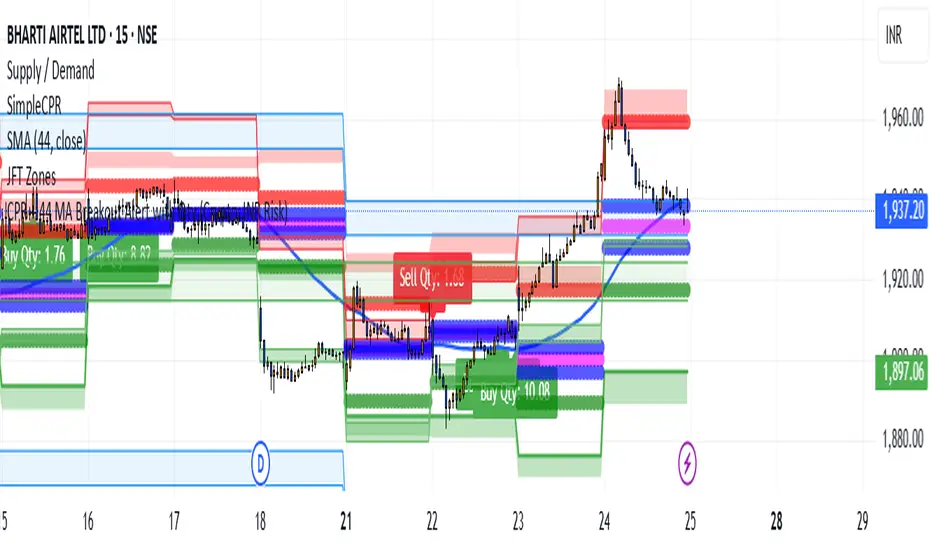
CPR + 44 MA Breakout Alert with Qty (Crypto, INR Risk)CPR + 44 EMA Breakout Alert with Quantity (Crypto | INR Risk-Based)
This indicator identifies high-probability **breakout and breakdown trades** based on two powerful intraday levels: the **Central Pivot Range (CPR)** and the **44-period Exponential Moving Average (EMA).
📌 Key Features:
Reference Candle Logic: The script first marks a "reference candle" — a candle that breaks out above or below both CPR and 44 EMA from the opposite side.
* Bullish Reference: Closes above both CPR top (TC) and 44 EMA from below.
* Bearish Reference: Closes below both CPR bottom (BC) and 44 EMA from above.
Signal Alerts:
* A **Buy signal** is triggered when a future candle **crosses above the high** of the bullish reference candle.
* A **Sell signal** is triggered when a future candle **crosses below the low** of the bearish reference candle.
* Position Sizing (Crypto):
* Input your **risk in INR**, and the indicator calculates your **position size in crypto quantity** using the live price and risk-based stop-loss distance.
* Includes two inputs: `riskINR` (default ₹600) and `rewardINR` (default ₹1000).
* Converts INR to USD using a user-defined exchange rate (default 85).
* Visual Markings:
* Buy/Sell signals are shown using **plotshapes**.
* Quantity is displayed near the candle using a dynamic label like: `Buy Qty: 4.25`.
🔔 Alerts:
Built-in alert conditions for both Buy and Sell entries. You can use these to automate or notify your trades, with messages formatted for crypto symbols (e.g., `BTCUSD.P Buy`).
** Important Note: ** Mainly Built for the Delta Exchange Broker in India for ALGO Trade Signals for automated trading whenever the alert is triggered. You can customise it for just getting the alerts or according to your needs. Just message me to get the Pine Script!
Impulse Alert - Demand (Buy) [Fixed]🔵 Impulse Alert – Demand (Buy)
This indicator is designed to detect high-probability Demand Zones based on impulsive bullish price action, helping traders get alerted only when it matters most.
🧠 Core Logic:
Scans the chart for 2 consecutive bullish impulsive candles with significant range (body size)
Also captures single large bullish impulse candles that often mark institutional buying
Marks the origin of the move as a potential Demand Zone
Sends alerts when such bullish setups form, allowing you to monitor charts passively
⚙️ Features:
✅ Alerts on impulsive move formations
✅ Detects both 2-candle and single-candle impulses
✅ Custom zone detection logic based on pip size and momentum
✅ Cleaner & smarter: removes distractions and avoids false signals
📌 Best Used For:
Smart Money / Supply & Demand traders
Identifying potential institutional buy zones
Executing trades with HTF confluence
Traders who want to get alerted without screen-watching
🔁 Suggested Strategy:
Set HTF directional bias (H1, H4, D1)
Use this indicator on LTF (1M–15M) for impulsive bullish entries
Wait for price to return to the marked zone for low-risk entries
💡 Pro Tip: Combine with your Supply Zone (Sell) indicator to track both sides of market structure and increase R:R
👤 Created by: Rohit Jadhav | YT/Insta/X - @GrowthByTrading
📬 Want updates, enhancements, or personal versions? Leave feedback or reach out through profile!
Supertrend with Volume Filter AlertSupertrend with Volume Filter Alert - Indicator Overview
What is the Supertrend Indicator?
The Supertrend indicator is a popular trend-following tool used by traders to identify the direction of the market and potential entry/exit points. It is based on the Average True Range (ATR), which measures volatility, and plots a line on the chart that acts as a dynamic support or resistance level. When the price is above the Supertrend line, it signals an uptrend (bullish), and when the price is below, it indicates a downtrend (bearish). The indicator is particularly effective in trending markets but can generate false signals during choppy or sideways conditions.
How This Script Works
The "Supertrend with Volume Filter Alert" enhances the classic Supertrend indicator by adding a customizable volume filter to improve signal reliability.
Here's how it functions:
Supertrend Calculation:The Supertrend is calculated using the ATR over a user-defined period (default: 55) and a multiplier (default: 1.85). These parameters control the sensitivity of the indicator:A higher ATR period smooths out volatility, making the indicator less reactive to short-term price fluctuations.The multiplier determines the distance of the Supertrend line from the price, affecting how quickly it responds to trend changes.The script plots the Supertrend line in cyan for uptrends and red for downtrends, making it easy to visualize the market direction.
Volume Filter:A key feature of this script is the volume filter, which helps filter out false signals in choppy markets. The filter compares the current volume to the average volume over a lookback period (default: 20) and only triggers signals if the volume exceeds the average by a specified multiplier (default: 2.0).This ensures that trend changes are accompanied by significant market participation, increasing the likelihood of a genuine trend shift.
Signals and Alerts:
Buy signals (cyan triangle below the bar) are generated when the price crosses above the Supertrend line (indicating an uptrend) and the volume condition is met.Sell signals (red triangle above the bar) are generated when the price crosses below the Supertrend line (indicating a downtrend) and the volume condition is met.Alerts are set up for both buy and sell signals, notifying traders only when the volume filter confirms the trend change.
Customizable Settings for Multiple Markets
The default settings in this script (ATR Period: 55, ATR Multiplier: 1.85, Volume Lookback Period: 20, Volume Multiplier: 2.0) were carefully chosen to provide a balance of sensitivity and reliability across various markets, including stocks, indices (like the S&P 500), forex, and cryptocurrencies.
Here's why these settings work well:
ATR Period (55): A longer ATR period smooths out volatility, making the indicator less prone to whipsaws in volatile markets like crypto or forex, while still being responsive enough for trending markets like indices.
ATR Multiplier (1.85): This multiplier strikes a balance between capturing early trend changes and avoiding noise. A smaller multiplier would make the indicator too sensitive, while a larger one might miss early opportunities.
Volume Lookback Period (20): A 20-bar lookback for volume averaging provides a robust baseline for identifying significant volume spikes, adaptable to both short-term (e.g., daily charts) and longer-term (e.g., weekly charts) timeframes.
Volume Multiplier (2.0): Requiring volume to be at least 2x the average ensures that only high-conviction moves trigger signals, which is crucial for markets with varying liquidity levels.
These parameters are fully customizable, allowing traders to adjust the indicator to their specific market, timeframe, or trading style. For example, you might reduce the ATR period for faster-moving markets or increase the volume multiplier for more conservative signal filtering.
How the Volume Filter Reduces Bad Trades in Choppy Markets
One of the main drawbacks of the Supertrend indicator is its tendency to generate false signals during choppy or ranging markets, where price fluctuates without a clear trend. The volume filter in this script addresses this issue by ensuring that trend changes are backed by significant market activity:
In choppy markets, price movements often lack strong volume, leading to false breakouts or reversals. By requiring volume to be a multiple (default: 2x) of the average volume over the lookback period, the script filters out these low-volume, low-conviction moves.This reduces the likelihood of taking bad trades during sideways markets, as only trend changes with strong volume confirmation will trigger signals. For example, on a daily chart of the S&P 500, a buy signal will only fire if the price crosses above the Supertrend line and the volume on that day is at least twice the 20-day average, indicating genuine buying pressure.
Usage Tips
Markets and Timeframes: This indicator is versatile and can be used on various assets (stocks, indices, forex, crypto) and timeframes (1-minute, 1-hour, daily, etc.). Adjust the settings based on the market's volatility and your trading strategy.
Combine with Other Indicators: While the volume filter improves reliability, consider using additional indicators like RSI or MACD to confirm trends, especially in ranging markets.
Backtesting: Test the indicator on historical data for your chosen market to optimize the settings and ensure they align with your trading goals.
Alerts: Set up alerts for buy and sell signals to stay informed of high-probability trend changes without constantly monitoring the chart.
ConclusionThe "Supertrend with Volume Filter Alert" is a powerful tool for trend-following traders, combining the simplicity of the Supertrend indicator with a volume-based filter to enhance signal accuracy. Its customizable settings make it adaptable to multiple markets, while the volume filter helps reduce false signals in choppy conditions, allowing traders to focus on high-probability trades. Whether you're trading stocks, indices, forex, or crypto, this indicator can help you identify trends with greater confidence.

Volume AlertVolume increase alert: triggers an icon and alert when the current volume is X times greater than the previous one. The multiplier value can be adjusted as needed.
Português:
Alerta de aumento de volume: dispara um ícone e alerta quando o volume atual é X vezes maior que o anterior. O valor do multiplicador pode ser ajustado conforme sua necessidade.

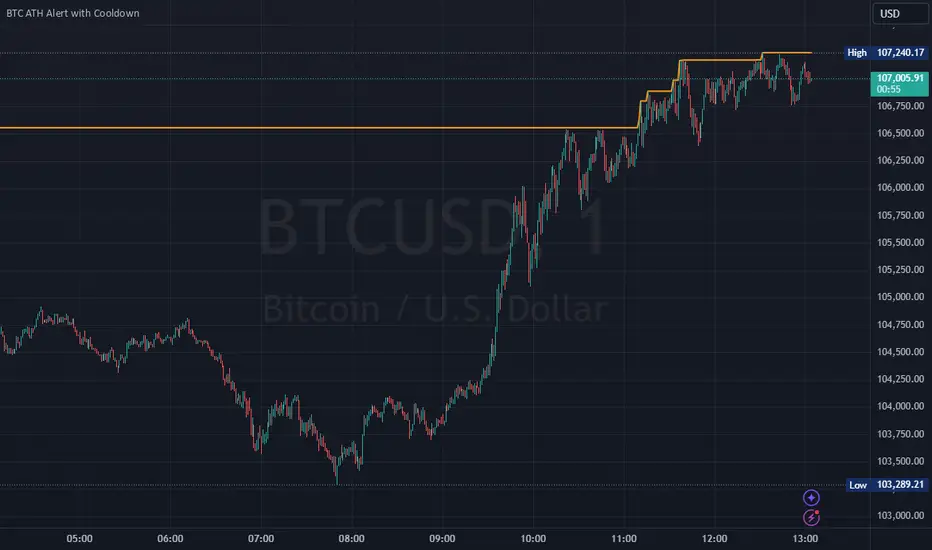
Bitcoin All-Time High (ATH) Alert with Cooldown₿ Bitcoin All-Time High (ATH) Alert with Cooldown 🚀👩🚀
🔍 What it does:
This indicator tracks new all-time highs (ATHs) and alerts you when Bitcoin (or any asset) reaches a fresh ATH, while avoiding alert spam with a customizable cooldown period.
✨ Key Features
✅ Alerts for New ATHs: Never miss when Bitcoin makes history!
✅ Cooldown Period: Prevents multiple alerts within a short timeframe (customizable in settings).
✅ ATH Line on Chart: A clear, visual line marking the all-time high price.
✅ Manual Reset Option: Reset the ATH for testing or specific chart conditions.
⚙️ How to Use
Add the Indicator: Apply it to your chart like any other indicator. Ideally on a small time frame, the cooldown is 20 bars by default (adjustable) which gives 20 minutes on the 1 min chart.
Customize Settings:
- Cooldown Period (bars): Set the number of bars to wait before triggering another alert (e.g., 20 bars).
- Show All-Time High Line: Toggle to display or hide the ATH line visually.
- Reset All-Time High: Use this to manually reset the ATH to the current bar's high.
Create an Alert:
Open the "Alerts" menu.
Select the condition: "New All-Time High" .
Choose a trigger type:
Once Per Bar: For immediate alerts when a new ATH occurs.
Once Per Bar Close: To confirm the ATH at the end of each bar.
🛠️ Who is it for?
Traders and HODLers who want to stay on top of price action.
Anyone looking for clean and efficient ATH tracking with no redundant alerts
🚀 Never miss a new ATH again. Stay ahead of the market!
Perfect Hammer Pattern Indicators and Alerts# Perfect Hammer Pattern Indicators and Alerts
This indicator identifies a specific and precise hammer candlestick pattern formation that can signal potential trend reversals or continuation setups. Unlike traditional hammer pattern indicators, this script focuses on exact wick measurements to identify high-probability trade setups.
## Pattern Specifications
### Bullish Setup Requirements
- Two consecutive green (bullish) candles
- Both candles must have NO lower wick (perfect bottom)
- Both candles must have an upper wick (showing buying pressure)
- Previous candle must be red (bearish) for context
- Marked with a green 'H' below the pattern
### Bearish Setup Requirements
- Two consecutive red (bearish) candles
- Both candles must have NO upper wick (perfect top)
- Both candles must have a lower wick (showing selling pressure)
- Previous candle must be green (bullish) for context
- Marked with a red 'H' above the pattern
## Trading Logic
This pattern is particularly effective because it shows clear control by either buyers (bullish pattern) or sellers (bearish pattern):
- In the bullish pattern, the absence of lower wicks indicates strong buying pressure preventing prices from falling below the open, while the upper wicks show profit-taking at highs
- In the bearish pattern, the absence of upper wicks shows strong selling pressure capping any upward movement, while the lower wicks indicate some buying support below
## Alerts
The indicator includes two alert conditions:
1. Bullish Pattern Alert: Triggers when two perfect bullish hammers appear after a bearish candle
2. Bearish Pattern Alert: Triggers when two perfect bearish hammers appear after a bullish candle
## Usage Tips
- Best used on timeframes 15 minutes and above
- Consider using in conjunction with key support/resistance levels
- Volume confirmation can increase pattern reliability
- The pattern may signal either trend continuation or reversal - always consider the larger market context
## Notes
- This indicator focuses on precise hammer formations rather than approximate patterns
- The requirement for consecutive perfect hammers makes this a relatively rare but high-probability setup
- Visual markers ('H') provide easy pattern identification on charts

Hull MA with Alerts and LabelsThis script is designed to help traders visually track market trends using various types of moving averages (MAs) and to receive alerts when certain conditions are met. Here’s a detailed breakdown of how the script works:
1. User Inputs and Customization:
MA Length: Traders can define the length of the moving average (default is 100).
Confirmation Candles: The trader can specify how many candles must confirm a trend before the script triggers a signal (default is 1).
MA Variation: The trader can choose between different moving average types: Simple Moving Average (SMA), Exponential Moving Average (EMA), Weighted Moving Average (WMA), or Hull Moving Average (HMA).
Source: Traders select the price source for the moving average calculation (e.g., close price).
Ribbon Transparency: Allows control over the transparency level of the ribbon plotted between the moving averages.
Bullish/Bearish Ribbon Colors: The user can choose the colors for bullish and bearish trends.
2. Moving Average Calculations:
The script provides multiple options for calculating moving averages:
SMA (Simple Moving Average)
EMA (Exponential Moving Average)
WMA (Weighted Moving Average)
HMA (Hull Moving Average)
For the Hull Moving Average (HMA), it uses a specific formula that smoothens the movement and reduces lag, which is helpful for more reactive trend detection.
3. Plotting Moving Averages and Trend Ribbon:
The script calculates two key moving averages:
MHULL: The main moving average, selected based on the user’s chosen MA variation and source.
SHULL: A shifted version of the MHULL to help compare trends (shifted by 2 bars).
These two moving averages are plotted on the chart for visualization. MHULL is plotted in green (or another color if changed), while SHULL is plotted in red. A ribbon is drawn between MHULL and SHULL to indicate trends visually. The ribbon changes color depending on whether the trend is bullish (MHULL > SHULL) or bearish (MHULL < SHULL). The ribbon’s transparency can be adjusted for visual clarity.
4. Trend Detection:
Bullish Trend: The script checks if the price has closed above MHULL for the defined number of confirmation candles. If confirmed, a bullish trend is detected.
Bearish Trend: Similarly, the script checks if the price has closed below SHULL for the confirmation period, indicating a bearish trend.
The script tracks whether the market is in a bullish or bearish trend and prevents repeated signals by remembering the current trend state.
5. Alerts and Labels:
Bullish Alerts and Labels: When a confirmed bullish trend is detected (i.e., price closes above MHULL for the entire confirmation period and MHULL > SHULL), the script triggers an alert notifying the trader of the bullish condition. A "BULLISH" label is placed on the chart near the low of the candle where the trend was confirmed.
Bearish Alerts and Labels: If a confirmed bearish trend is detected (i.e., price closes below SHULL for the confirmation period and MHULL < SHULL), the script triggers an alert for the bearish condition. A "BEARISH" label is placed on the chart near the high of the candle where the trend was confirmed.
These alerts and labels help traders act quickly on trend changes and align their trading strategy with market conditions.
6. Practical Use for Traders:
For traders, this script offers:
Customizability : It allows traders to define the length and type of moving averages, choose price sources, and control how signals are confirmed.
Visual Trend Representation : The plotted MA lines and colored ribbons help traders easily see market direction.
Early Warnings : With alerts and labels, the script gives traders early signals when trends are shifting, allowing them to adjust positions accordingly.
Trend Confirmation : The script waits for a user-defined number of confirmation candles before signaling a new trend, reducing false signals.
Overall, the script helps traders automate their strategy by tracking moving averages and alerting them when key trend conditions are met.

Volume change > 50% alert color coded GAAAPThis indicator, titled "Volume Change Alert," is designed to visually represent and alert traders to significant changes in trading volume on any given asset within the TradingView platform. The core functionality of the indicator revolves around detecting and highlighting instances where the volume of trades has experienced a notable increase compared to the previous trading period.
Key Features:
Percentage-Based Volume Change Detection: The indicator calculates the percentage change in trading volume from one bar to the next. This allows for a dynamic analysis of volume fluctuations that can be indicative of significant market events.
Threshold-Based Alerts: It employs a tiered alert system based on predefined volume increase thresholds:
Light Blue Highlight: When the volume increase is between 50% and 100%, the indicator marks the bar in light blue, signaling a moderate but noteworthy increase in trading activity.
Purple Highlight: An increase of more than 100% but less than 500% is highlighted in purple, indicating a substantial rise in volume that could be the result of significant market developments.
Black Highlight: For extraordinary situations where the volume increase exceeds 500%, the bar is highlighted in black, underscoring a dramatic surge in trading activity that could suggest major market moves.
Customizable Alerts: Traders can set up alerts based on these volume changes, allowing them to be notified in real-time when such conditions are met. This feature is invaluable for those looking to capitalize on volume-driven market opportunities or to monitor unusual market activity.
Visual and Textual Annotations: The indicator not only changes the color of the bars based on the volume increase but also attaches labels to these bars, providing the exact percentage increase in volume. This dual representation ensures that traders can quickly quantify the volume change at a glance.
Use Cases:
Identifying Breakouts: Sudden increases in volume can often precede or accompany price breakouts. Traders can use this indicator to spot potential breakouts as they are happening or to confirm the strength of a breakout based on the accompanying volume change.
Spotting Reversals: Significant changes in volume can also signal potential market reversals. A dramatic increase in volume might indicate the culmination of a trend and the potential start of a new one in the opposite direction.
Enhancing Trading Strategies: The indicator can be integrated into existing trading strategies to add a volume-based dimension to trading decisions, providing a more holistic view of market movements.

[TTI] ATR Trailing Stop Alerts––––HISTORY & CREDITS 🏦
The Trailing Stop Alert is a TradingView indicator developed by TintinTrading, which is designed to help traders manage their positions by updating and alerting them about their trailing stop levels. This tool is a valuable addition to a trader's arsenal, as it automates the process of maintaining trailing stop levels and alerts the user when they are updated or hit.
––––WHAT IT DOES 💡
The Trailing Stop Alert indicator calculates trailing stop levels based on the Average True Range (ATR) of an asset over a specified lookback period. It takes user inputs for trail type (Long or Short), lookback period, ATR length, ATR multiplier, and bar time. The indicator can be applied to any financial instrument and will dynamically update the trailing stop level based on price action. When the trailing stop level is updated or hit, the indicator generates alerts to inform the user of these events.
––––HOW TO USE IT 🔧
1. Add the Trailing Stop Alert indicator to your TradingView chart.
2. Configure the settings according to your preferred parameters:
👉Trail Type: Choose between "Long" or "Short" based on your trading position.
👉Lookback: Set the number of bars to look back for determining the highest high or lowest low.
👉ATR Length: Set the period for calculating the Average True Range.
👉ATR Multiplier: Set the multiplier to adjust the trailing stop distance.
👉Bar Time: Set the time at which the indicator starts updating the trailing stop levels.
3. The indicator will plot the trailing stop level on the chart, and update it as the price action unfolds.
4. When the trailing stop level is updated or hit, you will receive an alert in the form of a message with the new level or a notification that the stop has been hit.
5. Adjust your stop loss orders accordingly based on the trailing stop levels provided by the indicator.
By using the Trailing Stop Alert indicator, you can effectively manage your positions and reduce the risk of giving back profits in a trade.

Glow-Node AlertsGlow Node Multi Pair Alerts
This indicator allows you to set a single alert in trading view while being alerted of Glow Node auto pilot signals from up to 32 forex pairs.
How to Use
Simply open the indicator on screen.
By default the indicator will have all forex pairs unselected.
Open the settings and toggle the forex pair you would like to set an alert for in the current timeframe.
(Alert signals are optimised using our glow node auto pilot feature. These alerts cant be used with custom settings due to the pair switching.)
Set an alert in trading view and select the drop down.
Select Glow Node Multi alerts and your good to go......
Supported Pairs:
XAUUSD
XAGUSD
AUDCAD
AUDCHF
AUDJPY
AUDNZD
AUDUSD
CADCHF
CADJPY
CHFJPY
EURAUD
EURCAD
EURCHF
EURGBP
EURJPY
EURNZD
EURUSD
GBPAUD
GBPCAD
GBPCHF
GBPJPY
GBPNZD
GBPUSD
NZDCAD
NZDCHF
NZDJPY
USDCAD
USDCHF
USDJPY
BTCUSD
ETHUSD
LTCUSD

Argo II - (alerts for 3commas composite bots) - publicThis script lets users create BUY/SELL alerts for 3commas composite bots (1 alert = 12 pairs) in a simple way, based on a built in set of indicators that can be tweaked to work together or alone through the study settings.
There is a version of this script for single pair bots, with slightly more features here .
If the user choses to create both BUY and SELL signals from the study settings, the (1) alert created will send both BUY and SELL signals for all 12 pairs selected. At this stage, the script forces the user to select 12 pairs in the study settings. If less pairs are inserted, it will not work. Also, the script will only send alerts for the pairs selected in the study settings, not for the current chart (if different).
How to use:
- Add the script to the current chart
- Open the study settings , insert bot details and select 12 pairs. You should write the pairs manually, using the format BTC , ADA, ETH, etc. They MUST be in capital letters or 3commas will not recognize them.
- Still in the study settings, tweak the deal start/close conditions from various indicators until happy. The study will plot the entry / exit points below the current chart (1 = buy, 2 = sell)
- Make sure your strategy works for all the pairs you have selected, simply by checking each chart with the same study settings
- When happy, right click on the "..." next to the study name, then "Add alert'".
- Under "Condition", on the second line, chose "Any alert () function call". Add the webhook from 3commas, give it a name, and "create".
That's it.
Notes:
- If you insert coins that are not available for the quote currency and exchange of your choosing, the script will not work and return an error.
- Make sure you run tests with paper trading or dummy bots (i.e without actual bot ID) to ensure your alerts trigger as intended on all coins.
- If alerts trigger too much (i.e they all trigger at the same time for all coins), Trading View will stop the alert. So probably not ideal for a scalping bot. It could also be the sign the script doesn't work as intended.
- The script is a bit slow on my side. I am a beginner in pinescript, so if anyone knows how to simplify it, please let me know.
- if anyone knows how to tell the script to function with less than 12 pairs (when not filling the 12 fields in the setting), please also let me know :)
Traders Hedge - Pro with AlertsDear Traders,
"You can't connect the dots looking forward; you can only connect them looking backwards. So you have to trust that the dots will somehow connect in your future." ~Steve Jobs
This quote from Steve Jobs, explains the very essence of this indicator.
Trading is Simple, Why make it complicated. ~ Ravi Chandran
The main motto building this Traders Hedge - Pro indicator is to equip retail traders with a multi purpose tool which in itself will act as a complete trading setup.
This indicator will help you in understanding the market structure and planning your possible entries & exits well in advance.
The indicator & setup is independent of time frames & will work for all trading instruments.
Traders Hedge - Pro Indicator with Alerts you can also set Alerts on your favourite scripts and time frames, to get notification when a Demand or a Supply Zone is created or any Price rejection is formed.
List of all the features is provided below.
1. Trade Type - A quick auto setup for Intraday or Swing trades
2. CPR - Identifies the market structure and helps to plan mean reversions trade setups
3. Weekly Support & Resistance - Automatically identifies and displays the higher time frame support & resistance levels
4. Price Action Triggers - Alert with a trigger symbol shown on the respective candle where a possible price reversal is expected
5. Targets - Plots the possible Major & Minor targets, which helps in planning our possible profit booking & stop loss zones
6. Developing Pivots - Plots the price mean reversion zones for the upcoming trading session
7. Supply & Demand Zones - Plots the demand and supply zones by changing the color of the candle
8. Dynamic Dz & Sz Price Tracking - It dynamically identifies and plots the support & resistance levels
9. Opening Range - Plots the identified opening range on the chart
10. PEMA - Helps in visualizing the trend and also acts as a dynamic support & resistance levels
To set Alerts follow the steps provided below.
1. Go to the symbol chart and select the time frame on which you want to set Alerts.
2. Select Alerts Tab and click on Create Alert, shortcut key Alt+A
3. In Condition Select the option “Price Rejection Alerts“ or “Zone Alerts“ for which you want the alerts to be shown
4. In Options, select Once Per Bar Close
5. Select expiry as per your preference or keep it open-ended
6. Select Alerts Actions as per your preference
7. Alert name is optional
8. Default message is “Price Rejection Alerts“ or “Zone Alert” and can be modified
9. Click on Create and in the warning window select Continue Anyway
How to get the indicator:
To know more about the indicator & to download please check the link in the signature below.
Once you have active alert, you will keep getting notification whenever a Price rejection or new Demand / Supply zone gets created in the identified symbol and time frame you have selected.
Please do feel free to use the indicator and give your valuable feed backs which will help me in optimizing it to a great extent.
I would love to thank each of the traders in this Trading View community in helping me improve on my trading skills.
Happy Trading!

EMA CrossoversUseful for identifying and receiving alerts about uptrends and downtrends.
This script uses two Exponential Moving Averages (EMAs) to find price uptrends and downtrends. An Exponential Moving Average (EMA) is a type of moving average that places a greater weight and significance on the most recent data points. The script produces uptrend and downtrend signals based on crossovers and divergences between the two EMAs, the user will be able to spot a trend change (when the EMAs crossover) and to determine the strength of the current trend (when the EMAs diverge). It is also posible to get alerts for uptrends and downtrends on the web and mobile app with sound and pop-ups as well as via email. The optimal time to enter and exit the market can be concluded from this trend changes.
The user can set their own EMAs, by default they are set to 21 and 55 periods for medium and long term respectively. When the medium term EMA crosses below the long term EMA the asset is in a downtrend and the price will decline, and when the medium term EMA crosses above the long term EMA the asset is in an uptrend and price will increase.
This scripts plots the following indicators and signals on the chart to help the user to identify trends:
1.- Medium and long term EMAs as lines overlaid on the price chart.
2.- Up green triangles above bars when the price is on an uptrend and down red triangles below bars when the price is on a downtrend.
3.- Arrows with text to indicate the start of an uptrend or downtrend.
The user can enable and disable the indicators and signals as well as set colors and shapes to their liking.
This script also lets the user create alerts for uptrends and downtrends. To create a new alert using this script follow this instructions:
1.- Once you added this script to your chart, go to the alerts panel (right on web or bottom tool bar on the mobile app) and add a new alert (alarm clock icon with a plus sign).
2.- A modal window will open. On the “Condition” dropdown menu select “EMA Crossovers”.
3.- On the next dropdown menu (right below the “Condition” one) you can select from two types of alerts “Uptrend started” and “Downtrend started”.
4.- Lastly you can set all the normal alert options and create the alert.

Demand Supply Indicator With AlertsThe Demand Supply Zone indicator with Alerts helps in identifying the Demand Supply zones on chart by pinpointing them.
The indicator looks for Demand Zone patterns, Drop-Base-Rally or Rally-Base-Rally , when such pattern is identified the indicator marks it on the chart. Likewise, if the indicator identifies Supply Zone patterns, Rally-Base-Drop or Drop-Base-Drop the indicator marks it as Supply Zone. The basing candles are changed to Blue color and the Legout candles are changed to Black color by default.
Using the Demand Supply Zone Indicator with Alerts you can also set Alerts on your favourite scripts and timeframes, to get notification when Demand Supply Zones are formed.
List of all the features is provided below.
1. You can choose which patterns the indicator should identify.
2. Number of candles in basing from 1 to 6.
3. Strength of the legout.
4. Identify follow-through patterns.
5. Hide Single Legout patterns.
6. Strength of the first legout in follow through pattern.
7. Strength of the second legout in the follow through pattern.
8. Customize Basing Color
9. Customize Legout Color
10. Display Pattern Name
11. Display Proximal and Distal Values
12. Color customization for Demand Supply Zone Labels
13. Set Alerts based on Demand Supply Zone formation
To set Alerts follow the steps provided below.
1. Go to the symbol chart and select the timeframe on which you want to set Alerts.
2. Select Alerts Tab and click on Create Alert, shortcut key Alt+A
3. In Condition Select, Demand Supply Indicator With Alerts
4. In Options, select Once Per Bar Close
5. Select expiry as per your preference or keep it open-ended
6. Select Alerts Actions as per your preference
7. Alert name is optional
8. Default message is “Zone Alert” and can be modified
9. Click on Create and in the warning window select Continue Anyway
Once you have active alert, you will keep getting notification whenever a Demand/Supply zone in identified on the symbol and time frame you selected.
Use the link below to obtain access to this indicator.

lineAlertslineAlerts is a powerful tool to define Buys, Sells and Buy-Sell lines for repeating actions.
The possibilities vary from 1 Buy and/or Sell to repetitive Buying and Selling at definable lines from a specified point in time (Year, Month, Day and Hour to begin).
lineAlerts provides:
+ optional StartBuy and optional EndSell
+ in repeat mode: optional definable ending-action (Buy or Sell, which overwrites Stop-Out/Abort)
+ buy- and sell Lines can be angled separately by using non-zero entries in the Angle %perDay parameter
+ configurable Stop Loss (Percentage, Stop-Out/Abort-Only, Flat or Angled like Buy-Sell-Lines)
+ profit calculation and effective alerts can be set further than the beginning time (ActiveAfter#Hours)
+ empty-bar-correction for lower-liquidity pairs on short timescales (automatically on)
+ optional visual extension to the right for currently active buy-sell lines
+ Slippage Max. Percentage parameter, added to order price for Buying, subtracted for Selling
(represented in the Buy-Sell markings and LastPrice lines, also calculated in Profit/Loss percentages)
+ Full Autoview Alerts automation in the Order parameters (for spot trading, this can be replaced with
your own API commands while creating or modifying the TradingView alerts):
- Separate order size entries for Buying and Selling
- Choice between Percentage or absolute Amount for both Buying and Selling
(choose the corresponding alert-drop-down option when creating an alert!)
The timeframe for running lineAlerts depends on the scale (duration) of the defined pattern.
Running on a very small resolution, e.g. 1-5 Min, is suitable for a pattern of a few days to a week at most.
This is because of the limited available historic data. Keeping your pattern lines shorter than a week on these micro-timeframes will produce accurate results/output. A pattern which may last a few weeks or even months can run flawlessly on a 1H resolution for example.
"Once per bar" is the best alert option in any case. To avoid multiple signals within 1 bar in highly volatile times, it is better to create the alert on the 1 or 4 Hour chart in stead of the daily chart for a pattern of multiple weeks for example.
lineAlerts is suitable for any timeframe on any chart which is open 24/7, like most crypto currencies.
My other published indicators contain a handy combination of new and classical indicators and oscillators.
With lineAlerts, the one defining the lines is in complete control. Results might indicate how good one is at defining trade patterns and at defining suitable stop losses, but lineAlerts is not an indicator as such.
lineAlerts is more something like a visually definable price-line alerter with various stop loss and ending options. There will be a video available with some more explaining.
WARNING:
Note that if an Autoview extension is active for the charted exchange and the according TradingView alerts are activated, it works right out of the box, so make sure to have all order decimals right...
GuidoN - December 2019, July 2020

Vertical Horizontal Moving Average [AneoPsy & alexgrover] Moving average adapting to the strength of the trend, this is made possible by using the square of the vertical-horizontal filter as a smoothing factor. Alerts are included with two different types of conditions available to the user.
Settings
Length : Period of the moving average
Src : Input data for the indicator
Alerts : Types of conditions to be used in the alerts, when set to "VHMA Direction Change" alerts are triggered once the VHMA is either rising or declining, else the alerts are based on the crosses between Src and the VHMA
Usage
The VHMA can be used as a fast or slow-moving average in a moving average crossover system, or as input for other indicators.
VHMA of with length = 25 and sma with length = 200.
VHMA with length = 25 used as input for the RSI with length = 14.
Details
The vertical-horizontal filter is a measure of the strength of the trend and lay in a (0,1) range, to calculate it you just need to divide the rolling range over with the rolling sum of the absolute price changes, squaring the result allow to get lower results with higher values of length .
Squared vertical horizontal filter with length = 50, the value is low when the market is ranging and high when trending.
To set the alerts go in the alert panel, click on create alert, and select VHMA in "condition", choose between the buy or sell alert. If Src = closing price or another indicator dependant on the closing price select in options "once per bar close", if the indicator using the opening or lagged closing prices values as input select "One per bar" instead.
Thanks
Thanks to AneoPsy for adding the color change, the idea to use two kinds of conditions for the alert, and for its feedback, you can follow him
www.tradingview.com
and finally thanks to you for reading and for your support, only one last script left for the month, then we'll start July with some pretty interesting indicators, I hope you'll like them ^^/
