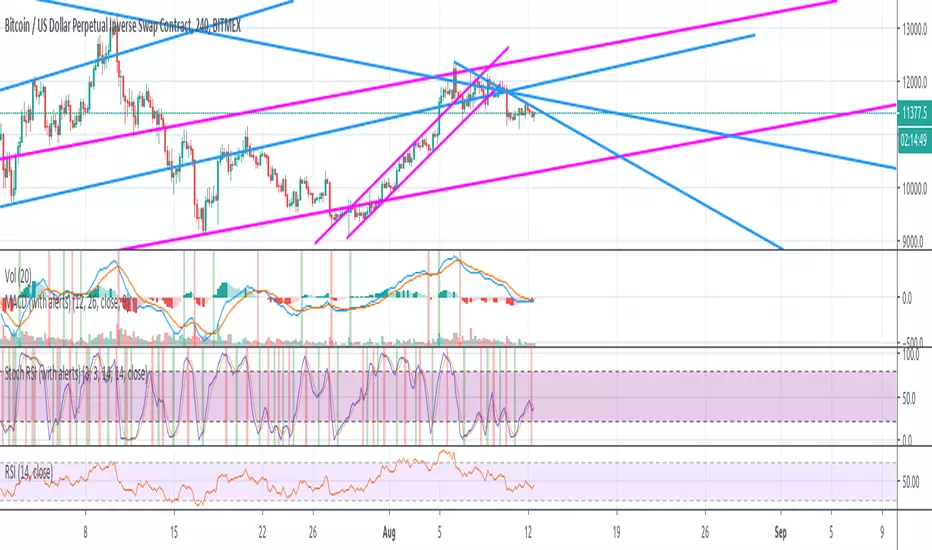
Stochastic RSI (with alerts)This is a modification of original Stochastic RSI oscillator, but with addition of highlighted death and golden crosses. It also allows you to receive alerts: "Stochastic RSI: Death cross on 4hours"
"alert"に関するスクリプトを検索
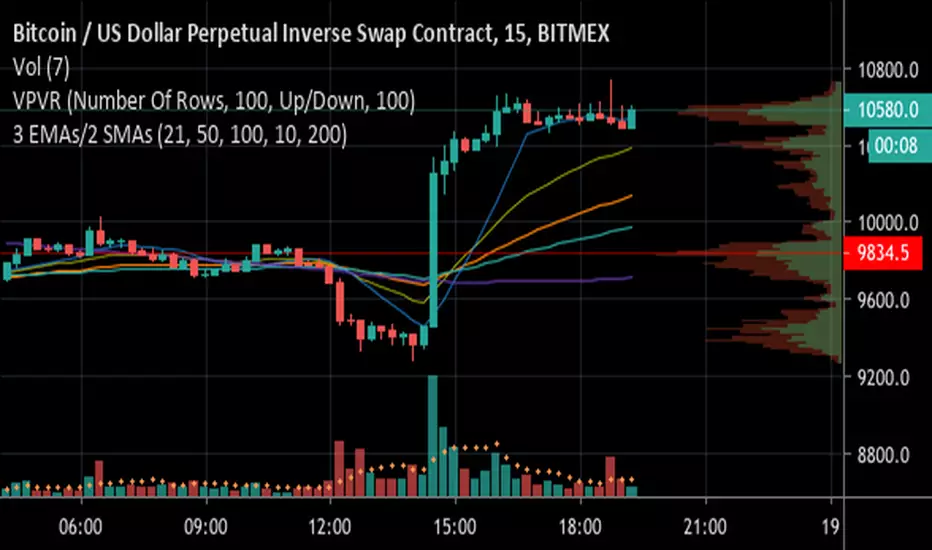
3 EMAs with Crossing Alerts & 2 SMAsHi all,
This is a simple indicator that plots 3 EMA lines and 2MAs of your choice to the screen and has built in alert triggers.
Features:
1) Alerts are triggered when EMAs 1 (Signal line) and 2 (Baseline) cross - a Long signal is called if the cross is above EMA 3 ( Trendline ), a short if the cross is below EMA3
2) Signals are represented visually as a triangle on the chart, below the candles is a long, above is a short
3) TradingView Alerts can be easily set as I have labelled the signals clearly as many other Indicators like this aren’t easy to work out if trying to create alerts to trigger a 3commas bot, for example!
Each EMA is fully customisable and if you wish to take advantage of the alerts, only a few simple rules need to be followed:
EMA1 needs to be less than EMA2.
EMA2 needs to be the same or greater than EMA3
That’s it, happy trading!
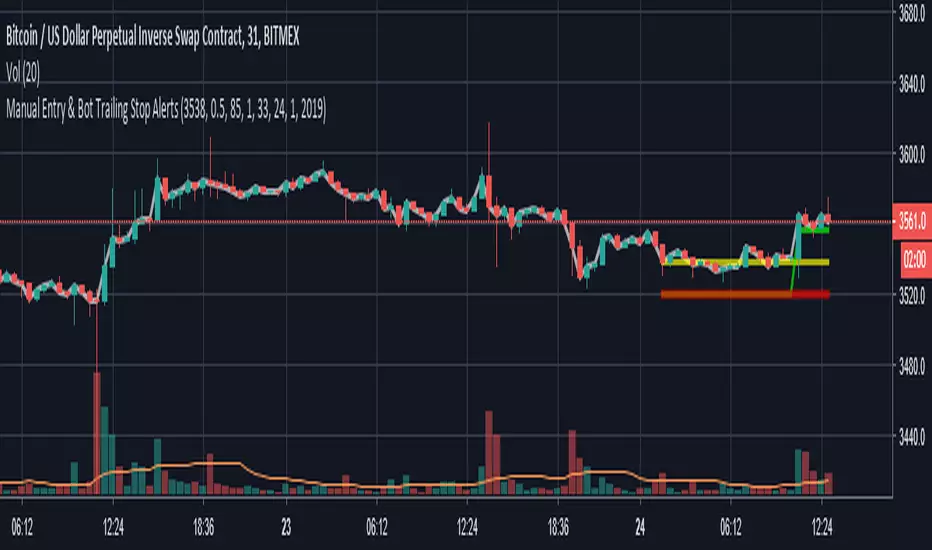
Manual Entry & Bot Trailing Stop AlertsHello all,
Another useful script & indicator with alerts enabled for trailing stoploss in your toolbox!
If you manually start a deal on a bot or even manual trade, you can set your chart time frame, enter the price and the time and date of your entry, then configure an Alert to fire using the “Close Long”/“Close Short” alert trigger.
This indicator features:
Definable Hard Stoploss by % - if price drops to hit this value, immediately trigger a close
Definable “Trail” value using Ticks (one Tick = lowest tradeable unit for your chart)
Supports Longs and Shorts!
Ideal for connecting to your 3commas BitMEX bots for EthUSD or XbtUSD
The indicator plots onto the chart various signals, Red is the Hard Stoploss value, Yellow is your Entry price, Green is the Trailing Stop and White is the live Price Tracker.
Please Note: When you add this indicator to your chart you need to click the Cog/Settings icon to configure it!
Let me know what you think!
Thanks,
Chris
Block Sale Transaction Alert!Understanding Block Transactions
Block transactions are transactions that are of a significantly high value. This can be a transaction of any
security that is large enough to have an impact on the market price and cause a flow-on effect of
investment that will ensue.
Block transactions are significant because the party who initiated the transaction is likely to be more
confident than the retail investor. Confidence can be assumed by the value of the transaction and the
source can be either,
a) an institutional fund with access to detailed and reliable information
or
b) a party with secret, insider knowledge that is currently undisclosed to the market.
For these reasons, being aware of block transactions is extremely important for anyone looking for a
new investment opportunity or risk management of current holdings.
Block Transaction Utility
This indicator is compatible with instant E-mail and SMS notifications so that the investor will be well
informed of institutional activity and make trading decisions quickly.
If a block transaction occurs, the user will be able to visualize whether it was a purchase or sale as it will
be textualized above or below the current bar if used with the Block Transaction Buy Alert found here:
Input Values
The visual representation of the transactions are customizable as you can adjust the shape, color, and
location by clicking “ Format ” at the top left of your chart, next to the indicator label.
Setting up Text message or E-mail Notifications
In order to receive the text message and/or email alerts, you will need to make sure the correct contact
information is saved in your TradingView® account settings.
For more information on this indicator, and setting up alerts, view this PDF: www.kenzing.com

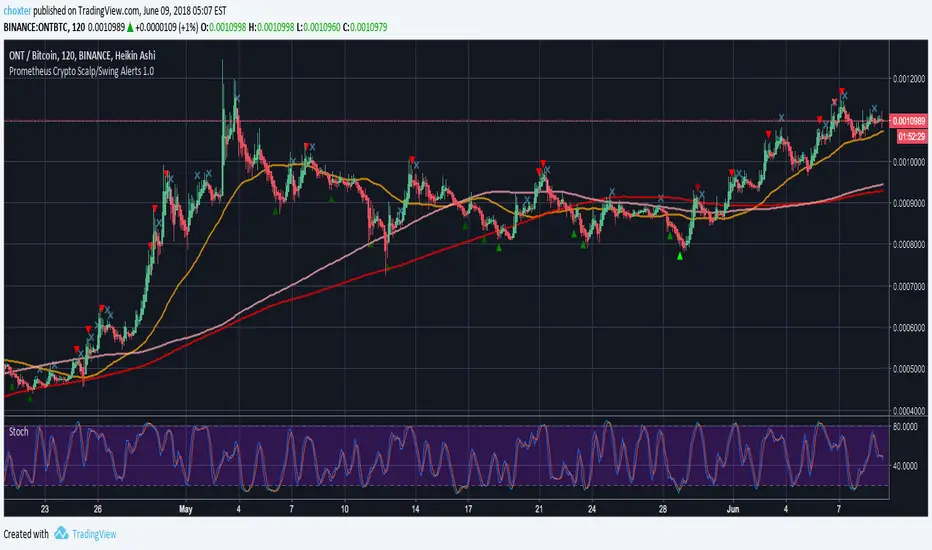
Prometheus Crypto Scalp/Swing Alerts 1.0Prometheus Crypto Scalp/Swing Alerts was built for scalp/swing crypto traders but you probably got that figured out by yourself. It offers high quality entries and exits which can be manually adjusted to suit your trading style. It performs great on any timeframe but scalp traders will love it for it’s ability to offer many entry points followed by quick exits, giving you opportunity to earn a few % within a few hours.
It has built in BUY/SELL alerts that can be connected to Autoview for automated trading.
How it works?
No drama, no complicated numbers - you only need to set the Alert strength indicator value (5-50) and according to that you will get the kind of alerts you like most. Choosing higher quality alerts will result in smaller quantity of those while picking out just the best entry and exit points and removing less interesting ones. You can always experiment and see what suits your trading style best.
Did we get your attention? If you wish to buy our script, shoot us a PM.
OBV Divergence Alerts (BETA)This Script uses the original code from the 'PPO Divergence alerts' by Scarf
Only difference is the OBV Ocilator by lazybear is used as the input instead.
Adjust the smoothing setting as required to change sensitivity for alerts.
Feel free to contact me if you would like more info.
RSI Divergence Alerts (BETA)This Script uses the original code from the 'PPO Divergence alerts' by Scarf
Only difference is the RSI is used as the input instead.
Adjust the smoothing setting as required to change sensitivity for alerts.
Feel free to contact me if you would like more info.

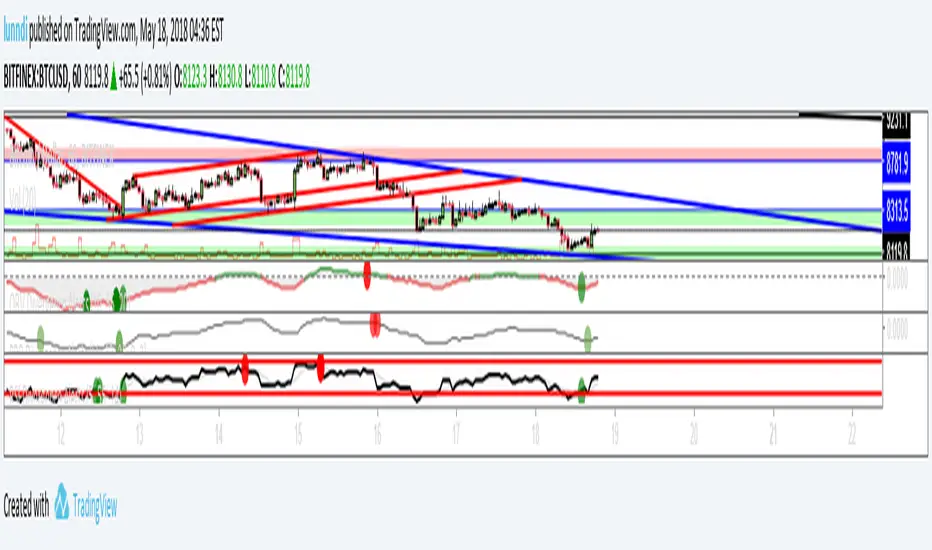
Vdub FX SniperVX3 / Strategy Alerts BetaThis is nothing other than a simple alert script I created for Vdub FX Sniper VX3 / Strategy by Vdubus
Thank you to WillowGoLightly for coming to me with the idea.
Change Log:
Removed plots & layover
Added a simple alert indicator to match original
Be sure to give Vdubus a big thanks!
Original Sniper Script by Vdubus:
Disclaimer: I have never used this indicator or alert script. There may be several unknown bugs. If found, please feel free to comment below and I will attempt to fix them. Use at your own risk.

SuperTrend Multi Time Frame with Alerts V.1SuperTrend Multi Time Frame with Alerts.
You can add long and short alerts for all supertrend viewed on the graph.
The script plot 5min, 1H and D Supertrend.
Enjoy!

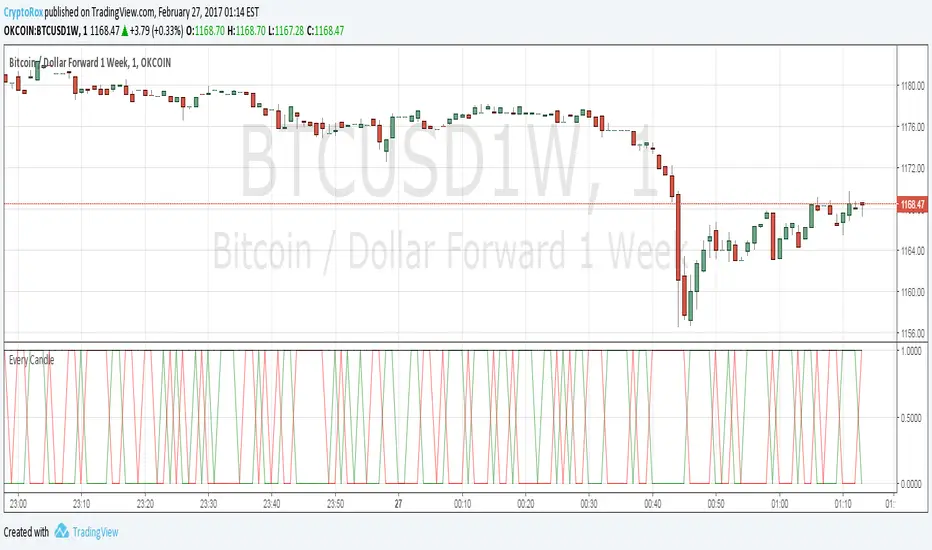
[Autoview] Every Candle Alert ScriptThis script is designed specifically for firing an alert every candle. It can also be used to just fire an alert on a green candle, or a red candle to slow it down a bit.
This is a script we use to close all of our orders or positions on any of the integrated exchanges.
You can use a fire once alert with greater than on condition and the alert will typically fire within seconds. You can also use this to place orders for you without having to navigate away from TradingView to your exchange/brokerage site.
If you would like a better understanding of how to create an alert for automation, please visit the article this strategy is being published for.
use.autoview.with.pink
SuperTrend V.1 AlertThis script is to use with "SuperTrend V1.0 - Buy or Sell Signal" by Rajandran.r
Use it with original Strategy for add TradingView Alert.
Enjoy!

Cumulative Price Change AlertCumulative Price Change Alert
Version: 1.0
Author: QCodeTrader 🚀
Overview 🔍
The Cumulative Price Change Alert indicator analyzes the percentage change between the current and previous open prices and sums these changes over a user-defined number of bars. It then generates visual buy and sell signals using arrows and labels on the chart, helping traders spot cumulative price momentum and potential trading opportunities.
Key Features ⚙️
Customizable Timeframe 🕒:
Use a custom timeframe or default to the chart's timeframe for price data.
User-Defined Summation 🔢:
Specify the number of bars to sum, allowing you to analyze cumulative price changes.
Custom Buy & Sell Conditions 🔔:
Set individual percentage change thresholds and cumulative sum thresholds to tailor signals for
your strategy.
Visual Alerts 🚀:
Displays green upward arrows for buy signals and red downward arrows for sell signals directly
on the chart.
Informative Labels 📝:
Provides labels with formatted percentage change and cumulative sum details for the analyzed
bars.
Versatile Application 📊:
Suitable for stocks, forex, crypto, commodities, and more.
How It Works ⚡
Price Change Calculation ➗:
The indicator calculates the percentage change between the current bar's open price and the
previous bar's open price.
Cumulative Sum ➕:
It then sums these percentage changes over the last N bars (as specified by the user).
Signal Generation 🚦:
Buy Signal 🟢: When both the individual percentage change and the cumulative sum exceed
their respective buy thresholds, a green arrow and label are displayed.
Sell Signal 🔴: Conversely, if the individual change and cumulative sum fall below the sell
thresholds, a red arrow and label are shown.
How to Use 💡
Add the Indicator ➕:
Apply the indicator to your chart.
Customize Settings ⚙️:
Set a custom timeframe if desired.
Define the number of bars to sum.
Adjust the buy/sell percentage change and cumulative sum thresholds to match your trading
strategy.
Interpret Visual Cues 👀:
Monitor the chart for green or red arrows and corresponding labels that signal potential buy or
sell opportunities based on cumulative price movements.
Settings Explained 🛠️
Custom Timeframe:
Select an alternative timeframe for analysis, or leave empty to use the current chart's timeframe.
Number of Last Bars to Sum:
Determines how many bars are used to compute the cumulative percentage change.
Buy Condition - Min % Change:
The minimum individual percentage change required to consider a buy signal.
Buy Condition - Min Sum of Bars:
The minimum cumulative percentage change over the defined bars needed for a buy signal.
Sell Condition - Max % Change:
The maximum individual percentage change threshold for a sell signal.
Sell Condition - Max Sum of Bars:
The maximum cumulative percentage change over the defined bars for triggering a sell signal.
Best Use Cases 🎯
Momentum Identification 📈:
Quickly spot strong cumulative price movements and momentum shifts.
Entry/Exit Signals 🚪:
Use the visual signals to determine potential entry and exit points in your trading.
Versatile Strategy Application 🔄:
Effective for scalping, swing trading, and longer-term analysis across various markets.
UPD: uncheck labels for better performance

Heikin-Ashi Trend AlertThis script:
Adds a Heikin-Ashi line to the chart (EMA-based).
Provides alerts triggered when the color goes from green to red and vice versa.
Just add the indicator to the chart, create an alert and select " Heikin-Ashi Trend Alert " from the dropdown. Profit.

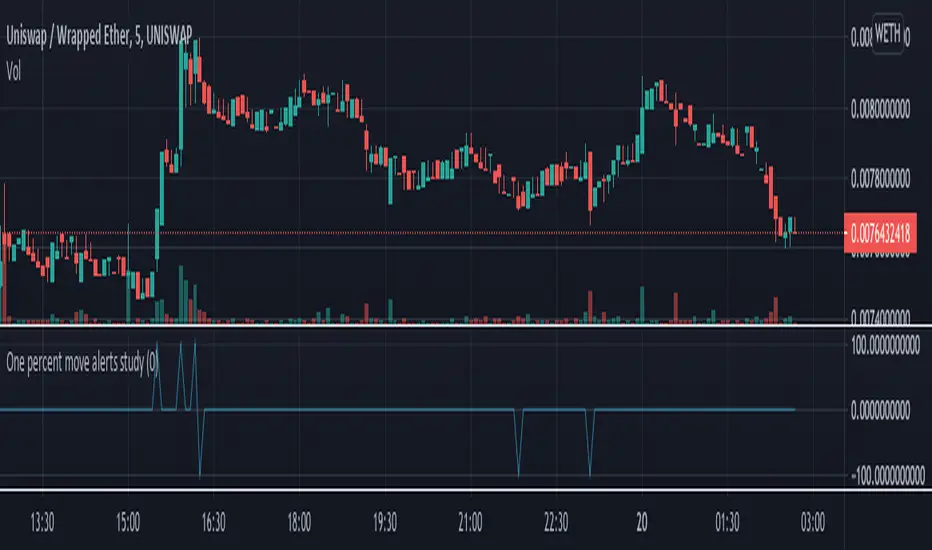
One Percent Move Study (For your Alerts)This is a simple script that can be used to alerts. The signal1 variable goes to 100 if there is a 1% up move in a tick, and goes to -100 if there is a 1% down move in a tick for an asset. This is best on a 1 minute or 5 minute chart.
This example shows this on the DeFi exchange Uniswap for the UNI/ETH pair
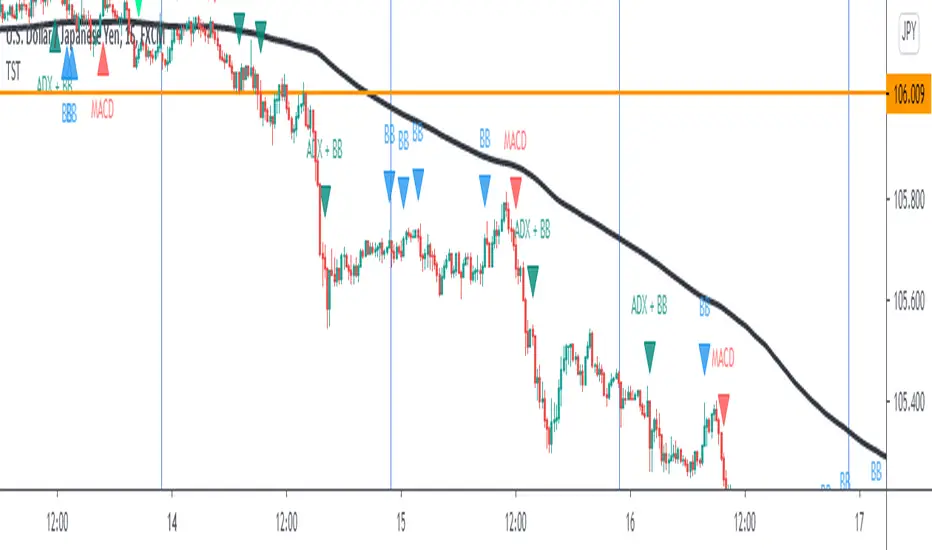
TST Signals & AlertsThis is an unofficial script for strategies tested on Trading Strategy Testing Youtube channel. Over time, most successful strategies will be added with an option to set strategy-specific alerts . TST Signals & Alerts will draw signals on the chart when the entry conditions are met. You can also opt for displaying indicators .
My script is meant for beginners but can be used by veterans too. Just pick one or two strategies, you don't want to flood your chart with conflicting signals. You may want to support your trades with a proper analysis. Is the market trending? Is there a fundament around the corner?
If a new signal occurs when there is still an open position, you are not supposed to take another.
The current version includes MACD and ADX + BB and BB strategies.
MACD strategy:
►Buy, when MACD crosses below the signal line when it is negative. The price must also be above 200 EMA.
►Sell, when MACD crosses above the signal line when it is positive. The price must also be below 200 EMA.
►This strategy was tested on 15-minute charts of EURUSD with reward-to-risk ratio 1,5 and win rate of 61% over 100 trades.
►►►MACD has to be added to your chart separately because it needs a new window. Ticking display indicators will not add MACD to your chart.
►►►MACD was also tested by a different channel I made a script for. You can view the results and the script here:
ADX + BB strategy:
►Buy, when the price is above 200 EMA and ADX becomes higher than 25.
►Sell, when the price is below 200 EMA and ADX becomes higher than 25.
►Stop-loss is either 200 EMA or Bollinger Bands level. Check the channel for more information.
►This strategy was tested on 5-minute charts of EURUSD, USDJPY, AUDUSD with reward-to-risk ratio 1,2 and win rate of 56% over 100 trades in total.
BB strategy:
►Buy, when the price is above 200 EMA and candle's low is below the lower Bollinger Band.
►Sell, when the price is below 200 EMA and candle's high is above the upper Bollinger Band.
►This strategy was tested on 15-minute charts of EURUSD with reward-to-risk ratio 1,5 and win rate of 52% over 100 trades in total.
►►►Due to the relatively low win rate of this strategy, you need to filter out potentially harmful signals with a proper analysis.
Bear in mind that backtesting performance doesn't guarantee future profitability. • Most systematic strategies are not suitable for each timeframe - if you use the different timeframe than the one it was tested on, the result can differ significantly. • You should perform your own backtest to base your trades on more data & to establish confidence in the selected strategy. • This script is not a replacement for proper analysis.
New strategies will be added when I have time. If I see multiple people asking for the same feature, I might agree to release it with a new version. I am not going to add input options in this script, it could come as a separate script though. I am in no way affiliated with the Youtube channel, so if you find the script helpful, shot me a message or send me some TradingView coins >)
If you encounter any bug, you can report it in a message or in comments. Support it with screenshot and relevant information such as a time when it occurred and what options were on etc.
PROFIT+ V3 ALERTThis is an alert indicator for PROFIT+ V3 strategy .
Add it to your chart with the strategy and create alerts to
receive notifications when Buy and Sell signals are generated.
To receive access for the strategy and this indicator, please pm me or contact
me at telegram from the link below.
----------------------------------------------------------------------------
Это алерт индикатор к стратегии PROFIT+ V3 .
Используйте индикатор со стратегией и создавайте алерты
для получения уведомлений когда генерируются сигналы
на покупку и продажу.
Для получения доступа к стратегии и к данному индикатору,
пожалуйста, напишите мне в лс или в телеграм через ссылку ниже.

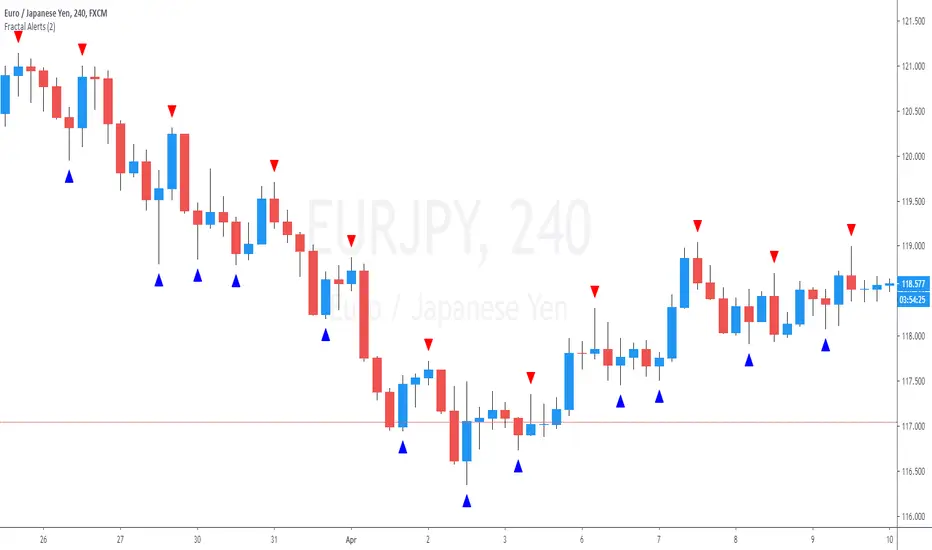
Fractals With Alerts For SwingsThis is a Fractals script with the capacity to provide alerts when two candles have completed after the swing point.
The alert can be placed after the swing point has been identified on a 3 candle formation and alerts when the a 5 candle formation is complete, ie; two closed candles after the swing point
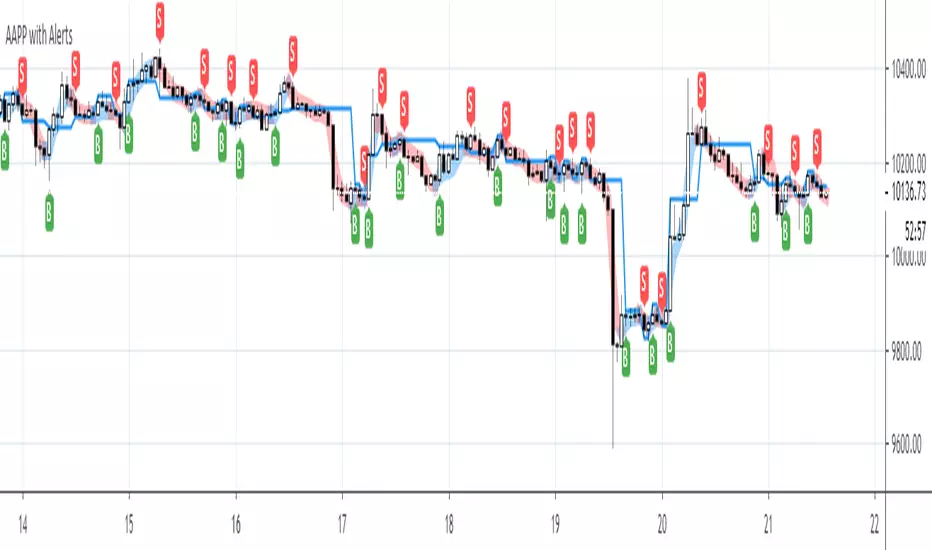
Pump AlertsMy very first indicator in Pine Script with two alert conditions for trading bots.
It's based on " Pump Catcher " by @ joepegler
I modified some parts, hopefully improved the usability and enabled alerts, so you can use it to trigger bots like 3commas via webhooks.
Pump Alerts 🚀 attempts to "detect moments of abnormal and accelerating increase in volume" AKA "pumps". Small and big pumps.
I recommend using it on small timeframes like 1 to 15 min and tinkering with the lookback period as well as threshold values.
Other than that it's pretty self-explanatory and beginner-friendly.
Free and Open Source. Let me know how you use it!

Day Trading Alert 01 by silenThunderrWorks on 1m TF or Tick Data
// Alert Condition for the Script are as follow :-
// EMA 10 crosses EMA 20 from bottom
// Close Price above VWAP
// Close price above Supertrend & +ve
// RSI > 60
For going LONG on Stocks when ALL conditions satisfy
Have to manually activate on each stocks on which Alerts is required.

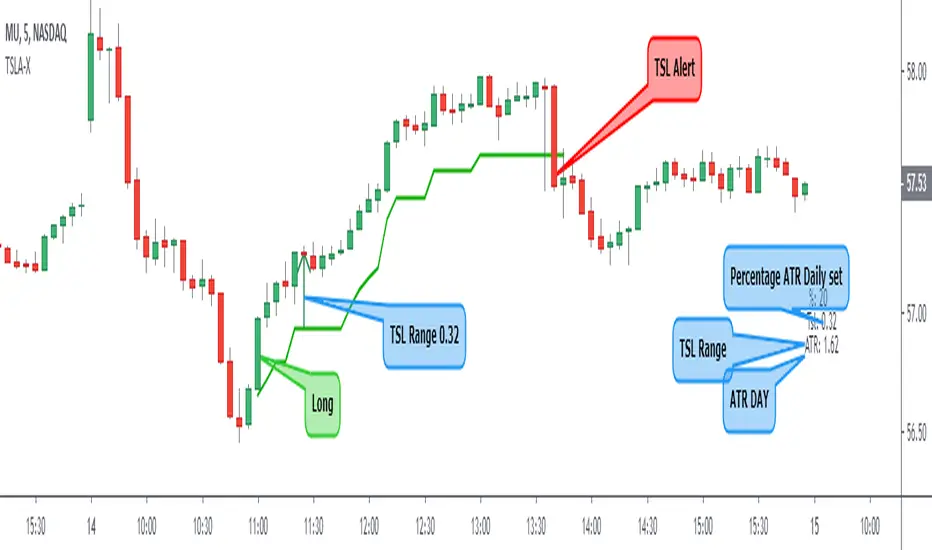
Trailing Stop Loss ATR + AlertI share this TSL indicator with alert (I use it only for Stocks), the configuration is very simple, you must select if it is a Short or Long operation, time at which the operation was opened,% of the daily ATR for TSL. It also contains:
- Alert
- Panel Info
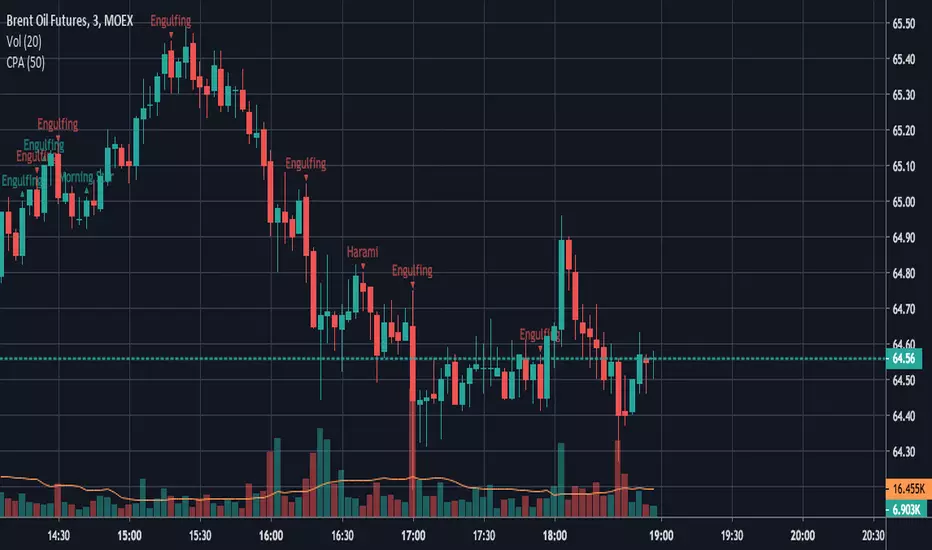
Candle Patterns AlertCandlestick pattern alerts for strategies "Candle Patterns Strategy" and "Candle Patterns Strategy - 2".
In order not to receive unnecessary signals, in the "Manage alerts" option should be selected "Once per bar close".
Elgrand - MACD crossover overlay with alertVisualize MACD bullish and bearish crossovers on your chart as an overlay. This way you won't necessarily have to add the MACD script and check manually at which point on your chart the MACD crossed. Optionally you can set alerts on the MACD crossovers in case you would like to trade from this after the signal occured.
