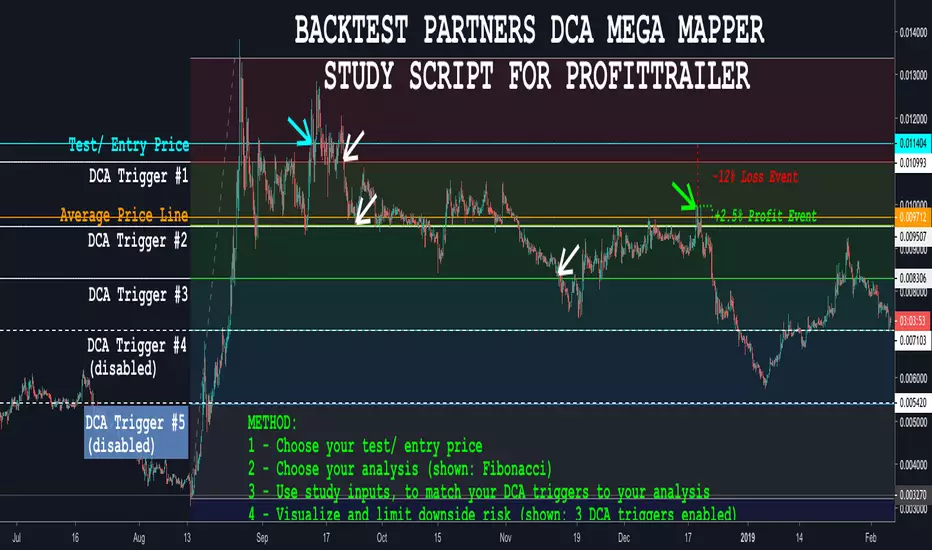
BACKTEST PARTNERS DCA MEGA MAPPER STUDY SCRIPT FOR PROFITTRAILERBacktest Partners Mega Mapper (BPMM) is an advanced DCA analysis script, allowing cryptocurrency traders to sync their ProfitTrailer trading bot buy levels, triggers and order sizes with their technical analysis charting results in TradingView.
For a complete functional demo, and to learn more about subscribing to this invite-only script, please visit us at backtest.partners
"backtest"に関するスクリプトを検索
Backtest strategy Iris V0.3Backtesting strategy win 2 filters EMA and RSI on diffrent time frames
Recommanded for scalping only (1m Tile frame)

BACKTEST SCRIPT 0.999 ALPHATRADINGVIEW BACKTEST SCRIPT by Lionshare (c) 2015
THS IS A REAL ALTERNATIVE FOR LONG AWAITED TV NATIVE BACKTEST ENGINE.
READY FOR USE JUST RIGHT NOW.
For user provided trading strategy, executes the trades on pricedata history and continues to make it over live datafeed.
Calculates and (plots on premise) the next performance statistics:
profit - i.e. gross profit/loss.
profit_max - maximum value of gross profit/loss.
profit_per_trade - each trade's profit/loss.
profit_per_stop_trade - profit/loss per "stop order" trade.
profit_stop - gross profit/loss caused by stop orders.
profit_stop_p - percentage of "stop orders" profit/loss in gross profit/loss.
security_if_bought_back - size of security portfolio if bought back.
trades_count_conseq_profit - consecutive gain from profitable series.
trades_count_conseq_profit_max - maxmimum gain from consecutive profitable series achieved.
trades_count_conseq_loss - same as for profit, but for loss.
trades_count_conseq_loss_max - same as for profit, but for loss.
trades_count_conseq_won - number of trades, that were won consecutively.
trades_count_conseq_won_max - maximum number of trades, won consecutively.
trades_count_conseq_lost - same as for won trades, but for lost.
trades_count_conseq_lost_max - same as for won trades, but for lost.
drawdown - difference between local equity highs and lows.
profit_factor - profit-t-loss ratio.
profit_factor_r - profit(without biggest winning trade)-to-loss ratio.
recovery_factor - equity-to-drawdown ratio.
expected_value - median gain value of all wins and loss.
zscore - shows how much your seriality of consecutive wins/loss diverges from the one of normal distributed process. valued in sigmas. zscore of +3 or -3 sigmas means nonrandom realitonship of wins series-to-loss series.
confidence_limit - the limit of confidence in zscore result. values under 0.95 are considered inconclusive.
sharpe - sharpe ratio - shows the level of strategy stability. basically it is how the profit/loss is deviated around the expected value.
sortino - the same as sharpe, but is calculated over the negative gains.
k - Kelly criterion value, means the percentage of your portfolio, you can trade the scripted strategy for optimal risk management.
k_margin - Kelly criterion recalculated to be meant as optimal margin value.
DISCLAIMER :
The SCRIPT is in ALPHA stage. So there could be some hidden bugs.
Though the basic functionality seems to work fine.
Initial documentation is not detailed. There could be english grammar mistakes also.
NOW Working hard on optimizing the script. Seems, some heavier strategies (especially those using the multiple SECURITY functions) call TV processing power limitation errors.
Docs are here:
docs.google.com

Backtest Larry Williams 9.1 ( exemplo) - JBBacktest simples para compra no rompimento do topo do primeiro candle que abre abaixo e fecha acima da ema de 9 periodos e venda no rompimento do fundo do primeiro candle que fecha abaixo da ema de 9

BackTestLibLibrary "BackTestLib"
Allows backtesting indicator performance. Tracks typical metrics such as won/loss, profit factor, draw down, etc. Trading View strategy library provides similar (and more comprehensive)
functionality but only works with strategies. This libary was created to address performance tracking within indicators.
Two primary outputs are generated:
1. Summary Table: Displays overall performance metrics for the indicator over the chart's loaded timeframe and history
2. Details Table: Displays a table of individual trade entries and exits. This table can grow larger than the available chart space. It does have a max number of rows supported. I haven't
found a way to add scroll bars or scroll bar equivalents yet.
f_init(data, _defaultStopLoss, _defaultTakeProfit, _useTrailingStop, _useTraingStopToBreakEven, _trailingStopActivation, _trailingStopOffset)
f_init Initialize the backtest data type. Called prior to using the backtester functions
Parameters:
data (backtesterData) : backtesterData to initialize
_defaultStopLoss (float) : Default trade stop loss to apply
_defaultTakeProfit (float) : Default trade take profit to apply
_useTrailingStop (bool) : Trailing stop enabled
_useTraingStopToBreakEven (bool) : When trailing stop active, trailing stop will increase no further than the entry price
_trailingStopActivation (int) : When trailing stop active, trailing will begin once price exceeds base stop loss by this number of points
_trailingStopOffset (int) : When trailing stop active, it will trail the max price achieved by this number of points
Returns: Initialized data set
f_buildResultStr(_resultType, _price, _resultPoints, _numWins, _pointsWon, _numLoss, _pointsLost)
f_buildResultStr Helper function to construct a string of resutling data for exit tooltip labels
Parameters:
_resultType (string)
_price (float)
_resultPoints (float)
_numWins (int)
_pointsWon (float)
_numLoss (int)
_pointsLost (float)
f_buildResultLabel(data, labelVertical, labelOffset, long)
f_buildResultLabel Helper function to construct an Exit label for display on the chart
Parameters:
data (backtesterData)
labelVertical (bool)
labelOffset (int)
long (bool)
f_updateTrailingStop(_entryPrice, _curPrice, _sl, _tp, trailingStopActivationInput, trailingStopOffsetInput, useTrailingStopToBreakEven)
f_updateTrailingStop Helper function to advance the trailing stop as price action dictates
Parameters:
_entryPrice (float)
_curPrice (float)
_sl (float)
_tp (float)
trailingStopActivationInput (float)
trailingStopOffsetInput (float)
useTrailingStopToBreakEven (bool)
Returns: Updated stop loss for current price action
f_enterShort(data, entryPrice, fixedStopLoss)
f_enterShort Helper function to enter a short and collect data necessary for tracking the trade entry
Parameters:
data (backtesterData)
entryPrice (float)
fixedStopLoss (float)
Returns: Updated backtest data
f_enterLong(data, entryPrice, fixedStopLoss)
f_enterLong Helper function to enter a long and collect data necessary for tracking the trade entry
Parameters:
data (backtesterData)
entryPrice (float)
fixedStopLoss (float)
Returns: Updated backtest data
f_exitTrade(data)
f_enterLong Helper function to exit a trade and update/reset tracking data
Parameters:
data (backtesterData)
Returns: Updated backtest data
f_checkTradeConditionForExit(data, condition, curPrice, enableRealTime)
f_checkTradeConditionForExit Helper function to determine if provided condition indicates an exit
Parameters:
data (backtesterData)
condition (bool) : When true trade will exit
curPrice (float)
enableRealTime (bool) : When true trade will evaluate if barstate is relatime or barstate is confirmed; otherwise just checks on is confirmed
Returns: Updated backtest data
f_checkTrade(data, curPrice, curLow, curHigh, enableRealTime)
f_checkTrade Helper function to determine if current price action dictates stop loss or take profit exit
Parameters:
data (backtesterData)
curPrice (float)
curLow (float)
curHigh (float)
enableRealTime (bool) : When true trade will evaluate if barstate is relatime or barstate is confirmed; otherwise just checks on is confirmed
Returns: Updated backtest data
f_fillCell(_table, _column, _row, _title, _value, _bgcolor, _txtcolor, _text_size)
f_fillCell Helper function to construct result table cells
Parameters:
_table (table)
_column (int)
_row (int)
_title (string)
_value (string)
_bgcolor (color)
_txtcolor (color)
_text_size (string)
Returns: Table cell
f_prepareStatsTable(data, drawTesterSummary, drawTesterDetails, summaryTableTextSize, detailsTableTextSize, displayRowZero, summaryTableLocation, detailsTableLocation)
f_fillCell Helper function to populate result table
Parameters:
data (backtesterData)
drawTesterSummary (bool)
drawTesterDetails (bool)
summaryTableTextSize (string)
detailsTableTextSize (string)
displayRowZero (bool)
summaryTableLocation (string)
detailsTableLocation (string)
Returns: Updated backtest data
backtesterData
backtesterData - container for backtest performance metrics
Fields:
tradesArray (array) : Array of strings with entries for each individual trade and its results
pointsBalance (series float) : Running sum of backtest points won/loss results
drawDown (series float) : Running sum of backtest total draw down points
maxDrawDown (series float) : Running sum of backtest total draw down points
maxRunup (series float) : Running sum of max points won over the backtest
numWins (series int) : Number of wins of current backtes set
numLoss (series int) : Number of losses of current backtes set
pointsWon (series float) : Running sum of points won to date
pointsLost (series float) : Running sum of points lost to date
entrySide (series string) : Current entry long/short
tradeActive (series bool) : Indicates if a trade is currently active
tradeComplete (series bool) : Indicates if a trade just exited (due to stop loss or take profit)
entryPrice (series float) : Current trade entry price
entryTime (series int) : Current trade entry time
sl (series float) : Current trade stop loss
tp (series float) : Current trade take profit
defaultStopLoss (series float) : Default trade stop loss to apply
defaultTakeProfit (series float) : Default trade take profit to apply
useTrailingStop (series bool) : Trailing stop enabled
useTrailingStopToBreakEven (series bool) : When trailing stop active, trailing stop will increase no further than the entry price
trailingStopActivation (series int) : When trailing stop active, trailing will begin once price exceeds base stop loss by this number of points
trailingStopOffset (series int) : When trailing stop active, it will trail the max price achieved by this number of points
resultType (series string) : Current trade won/lost
exitPrice (series float) : Current trade exit price
resultPoints (series float) : Current trade points won/lost
summaryTable (series table) : Table to deisplay summary info
tradesTable (series table) : Table to display per trade info

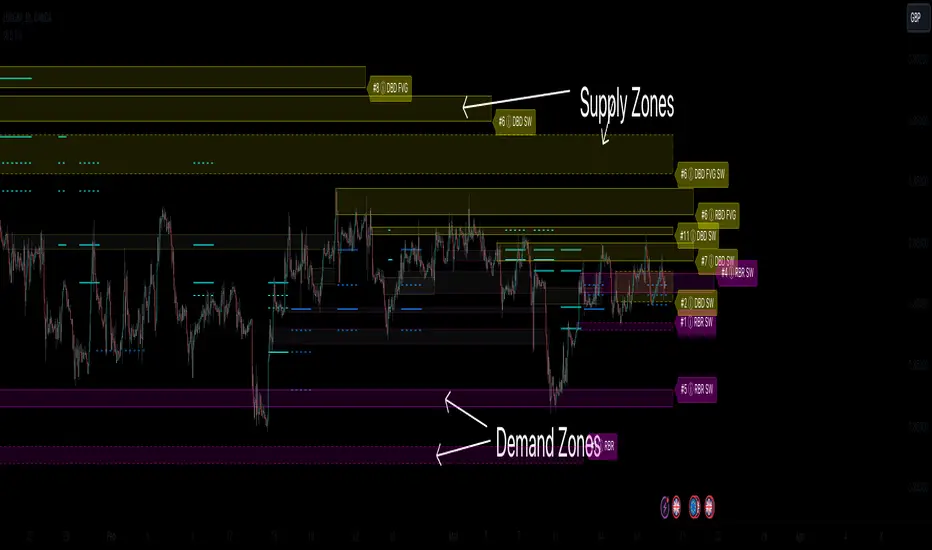
Supply & Demand Zones (Order Block) Pro [BacktestBot]Supply & Demand Zones (Order Block) Pro with DBD/RBR/RBD/DBR/FVG
This indicator helps to identify large price moves driven by banks and institutions. It can be used for any asset type (FOREX, crypto, commodities, indices) and any timeframe.
How to use this indicator
Message me to gain access. I try to reply within 24 hours.
Consider this as more of a visual aid to add to your confluences.
Use a side by side chart layout with different timeframes to see more zones.
(See example of use at the bottom)
Pullback trades are popular with zones.
⭑⭑⭑ Zones ⭑⭑⭑
How are zones created?
Supply zones are created when the price drops quickly, so are found above the price action.
Demand zones are created when the price rallies quickly, so are found below the price action.
The script uses a combination of quick price movements and user defined minimum price % changes. All user defined settings have default settings which vary depending on asset type and timeframe.
What is a strong zone?
The zones boxes have either a dashed border or a solid border. A solid border represents a strong zone which is when
the price has moved very quickly from it, or
the price has bounced off the zone multiple times.
What is a deactivated zone?
When the price has gone through the zone by a certain %, the zone is deactivated and displayed in a more transparant colour.
How are deactivated zones used for switch zones?
When a new zone is created, it is checked to see if it overlaps a recently deactivated zone.
e.g. If a new demand zone overlaps a recently deactivated supply zone, then the zone has switched from supply to demand. This might mean the new zone could be a strong one and the number of hits on the previous zone (also a potential indicator of strength) is displayed in the zone label tooltip.
Zone information
Basic zone information can be found in the zone label.
Users can choose what information is displayed in the label including the number of hits and prices.
More detailed information can be found in the zone label tooltip.
Hovering over the label will display more information including the zone start time and height %.
DBD/RBR/RBD/DBR/FVG
Zones are defined as drop base drop, rally base rally, rally base drop, drop base rally, and fair value gap.
Zone height
Users have the option of choosing
Wick to wick, or
Wick to body
The indicator does its best to meet the user preference but sometimes it is not possible. The information in the label tooltip will show if the preference was matched.
Minimum and maximum height default settings help to prevent zone boxes which might fill the whole chart.
⭑⭑⭑ Lines of Interest ⭑⭑⭑
Lines of interest are displayed as an added bonus.
Long wick
Long wicks might show areas of support or resistance. Very long and long wicks are defined by the % change in the wicks.
Very long wick lines are always displayed, and long wicks are displayed if they are not near a zone.
Possible Support / Resistance
After a big rally or drop, lines are displayed to show where the price might pullback to. These lines can act as possible support or resistance, and
are taken from recently deactivated zones. A solid line respresents a strong deactivated zone.
⭑⭑⭑ Alerts ⭑⭑⭑
Limit the number of alerts to the recommended ones. Consider this as more of a visual aid to add to your confluences.
Alert types
Early alerts happen immediately.
Bar end alerts happen when the bar closes.
Alert display
Alerts can be displayed on the chart with symbols. The most recent symbols have a tooltip which allow alert information to be displayed when hovering over them.
It is recommended to turn the alert display off, as it can clutter up the chart. The alerts will continue to work with the display off.
⭑⭑⭑ Example of use ⭑⭑⭑
Side by side chart with different timeframes
⭑⭑⭑ Disclaimer ⭑⭑⭑
Trading is very high risk. All content, tools and scripts provided by BacktestBot are for informational & educational purposes only. Past performance does not guarantee future results.
Backtest Strategy Optimizer AdapterBacktest Strategy Optimizer Adapter
With this library, you will be able to run one or multiple backtests with different variables (combinations). For example, you can run 100 backtests of Supertrend at once with an increment factor of 0.1. This way, you can easily fetch the most profitable settings and apply them to your strategy.
To get a better understanding of the code, you can check the code below.
Single backtest results
= backtest.results(date_start, date_end, long_entry, long_exit, take_profit_percentage, stop_loss_percentage, atr_length, initial_capital, order_size, commission)
Add backtest results to a table
backtest.table(initial_capital, profit_and_loss, open_balance, winrate, entries, exits, wins, losses, backtest_table_position, backtest_table_margin, backtest_table_transparency, backtest_table_cell_color, backtest_table_title_cell_color, backtest_table_text_color)
Backtest result without chart labels
= backtest.run(date_start, date_end, long_entry, long_exit, take_profit_percentage, stop_loss_percentage, atr_length, initial_capital, order_size, commission)
Backtest result profit
profit = backtest.profit(date_start, date_end, long_entry, long_exit, take_profit_percentage, stop_loss_percentage, atr_length, initial_capital, order_size, commission)
Backtest result winrate
winrate = backtest.winrate(date_start, date_end, long_entry, long_exit, take_profit_percentage, stop_loss_percentage, atr_length, initial_capital, order_size, commission)
Start Date
You can set the start date either by using a timestamp or a number that refers to the number of bars back.
Stop Loss / Take Profit Issue
Unfortunately, I did not manage to achieve 100% accuracy for the take profit and stop loss. The original TradingView backtest can stop at the correct position within a bar using the strategy.exit stop and limit variables. However, it seems unachievable with a crossunder/crossover function in PineScript unless it is calculated on every tick (which would make the backtesting results invalid). So far, I have not found a workaround, and I would be grateful if someone could solve this issue, if it is even possible. If you have any solutions or fixes, please let me know!
Multiple Backtest Results / Optimizer
You can run multiple backtests in a single strategy or indicator, but there are certain requirements for placing the correct code in the right way. To view examples of running multiple backtests, you can refer to the links provided in the updates I posted below. In the samples I have also explained how you can auto-generate code for your backtest strategy.

Backtesting & Trading Engine [PineCoders]The PineCoders Backtesting and Trading Engine is a sophisticated framework with hybrid code that can run as a study to generate alerts for automated or discretionary trading while simultaneously providing backtest results. It can also easily be converted to a TradingView strategy in order to run TV backtesting. The Engine comes with many built-in strats for entries, filters, stops and exits, but you can also add you own.
If, like any self-respecting strategy modeler should, you spend a reasonable amount of time constantly researching new strategies and tinkering, our hope is that the Engine will become your inseparable go-to tool to test the validity of your creations, as once your tests are conclusive, you will be able to run this code as a study to generate the alerts required to put it in real-world use, whether for discretionary trading or to interface with an execution bot/app. You may also find the backtesting results the Engine produces in study mode enough for your needs and spend most of your time there, only occasionally converting to strategy mode in order to backtest using TV backtesting.
As you will quickly grasp when you bring up this script’s Settings, this is a complex tool. While you will be able to see results very quickly by just putting it on a chart and using its built-in strategies, in order to reap the full benefits of the PineCoders Engine, you will need to invest the time required to understand the subtleties involved in putting all its potential into play.
Disclaimer: use the Engine at your own risk.
Before we delve in more detail, here’s a bird’s eye view of the Engine’s features:
More than 40 built-in strategies,
Customizable components,
Coupling with your own external indicator,
Simple conversion from Study to Strategy modes,
Post-Exit analysis to search for alternate trade outcomes,
Use of the Data Window to show detailed bar by bar trade information and global statistics, including some not provided by TV backtesting,
Plotting of reminders and generation of alerts on in-trade events.
By combining your own strats to the built-in strats supplied with the Engine, and then tuning the numerous options and parameters in the Inputs dialog box, you will be able to play what-if scenarios from an infinite number of permutations.
USE CASES
You have written an indicator that provides an entry strat but it’s missing other components like a filter and a stop strategy. You add a plot in your indicator that respects the Engine’s External Signal Protocol, connect it to the Engine by simply selecting your indicator’s plot name in the Engine’s Settings/Inputs and then run tests on different combinations of entry stops, in-trade stops and profit taking strats to find out which one produces the best results with your entry strat.
You are building a complex strategy that you will want to run as an indicator generating alerts to be sent to a third-party execution bot. You insert your code in the Engine’s modules and leverage its trade management code to quickly move your strategy into production.
You have many different filters and want to explore results using them separately or in combination. Integrate the filter code in the Engine and run through different permutations or hook up your filtering through the external input and control your filter combos from your indicator.
You are tweaking the parameters of your entry, filter or stop strat. You integrate it in the Engine and evaluate its performance using the Engine’s statistics.
You always wondered what results a random entry strat would yield on your markets. You use the Engine’s built-in random entry strat and test it using different combinations of filters, stop and exit strats.
You want to evaluate the impact of fees and slippage on your strategy. You use the Engine’s inputs to play with different values and get immediate feedback in the detailed numbers provided in the Data Window.
You just want to inspect the individual trades your strategy generates. You include it in the Engine and then inspect trades visually on your charts, looking at the numbers in the Data Window as you move your cursor around.
You have never written a production-grade strategy and you want to learn how. Inspect the code in the Engine; you will find essential components typical of what is being used in actual trading systems.
You have run your system for a while and have compiled actual slippage information and your broker/exchange has updated his fees schedule. You enter the information in the Engine and run it on your markets to see the impact this has on your results.
FEATURES
Before going into the detail of the Inputs and the Data Window numbers, here’s a more detailed overview of the Engine’s features.
Built-in strats
The engine comes with more than 40 pre-coded strategies for the following standard system components:
Entries,
Filters,
Entry stops,
2 stage in-trade stops with kick-in rules,
Pyramiding rules,
Hard exits.
While some of the filter and stop strats provided may be useful in production-quality systems, you will not devise crazy profit-generating systems using only the entry strats supplied; that part is still up to you, as will be finding the elusive combination of components that makes winning systems. The Engine will, however, provide you with a solid foundation where all the trade management nitty-gritty is handled for you. By binding your custom strats to the Engine, you will be able to build reliable systems of the best quality currently allowed on the TV platform.
On-chart trade information
As you move over the bars in a trade, you will see trade numbers in the Data Window change at each bar. The engine calculates the P&L at every bar, including slippage and fees that would be incurred were the trade exited at that bar’s close. If the trade includes pyramided entries, those will be taken into account as well, although for those, final fees and slippage are only calculated at the trade’s exit.
You can also see on-chart markers for the entry level, stop positions, in-trade special events and entries/exits (you will want to disable these when using the Engine in strategy mode to see TV backtesting results).
Customization
You can couple your own strats to the Engine in two ways:
1. By inserting your own code in the Engine’s different modules. The modular design should enable you to do so with minimal effort by following the instructions in the code.
2. By linking an external indicator to the engine. After making the proper selections in the engine’s Settings and providing values respecting the engine’s protocol, your external indicator can, when the Engine is used in Indicator mode only:
Tell the engine when to enter long or short trades, but let the engine’s in-trade stop and exit strats manage the exits,
Signal both entries and exits,
Provide an entry stop along with your entry signal,
Filter other entry signals generated by any of the engine’s entry strats.
Conversion from strategy to study
TradingView strategies are required to backtest using the TradingView backtesting feature, but if you want to generate alerts with your script, whether for automated trading or just to trigger alerts that you will use in discretionary trading, your code has to run as a study since, for the time being, strategies can’t generate alerts. From hereon we will use indicator as a synonym for study.
Unless you want to maintain two code bases, you will need hybrid code that easily flips between strategy and indicator modes, and your code will need to restrict its use of strategy() calls and their arguments if it’s going to be able to run both as an indicator and a strategy using the same trade logic. That’s one of the benefits of using this Engine. Once you will have entered your own strats in the Engine, it will be a matter of commenting/uncommenting only four lines of code to flip between indicator and strategy modes in a matter of seconds.
Additionally, even when running in Indicator mode, the Engine will still provide you with precious numbers on your individual trades and global results, some of which are not available with normal TradingView backtesting.
Post-Exit Analysis for alternate outcomes (PEA)
While typical backtesting shows results of trade outcomes, PEA focuses on what could have happened after the exit. The intention is to help traders get an idea of the opportunity/risk in the bars following the trade in order to evaluate if their exit strategies are too aggressive or conservative.
After a trade is exited, the Engine’s PEA module continues analyzing outcomes for a user-defined quantity of bars. It identifies the maximum opportunity and risk available in that space, and calculates the drawdown required to reach the highest opportunity level post-exit, while recording the number of bars to that point.
Typically, if you can’t find opportunity greater than 1X past your trade using a few different reasonable lengths of PEA, your strategy is doing pretty good at capturing opportunity. Remember that 100% of opportunity is never capturable. If, however, PEA was finding post-trade maximum opportunity of 3 or 4X with average drawdowns of 0.3 to those areas, this could be a clue revealing your system is exiting trades prematurely. To analyze PEA numbers, you can uncomment complete sets of plots in the Plot module to reveal detailed global and individual PEA numbers.
Statistics
The Engine provides stats on your trades that TV backtesting does not provide, such as:
Average Profitability Per Trade (APPT), aka statistical expectancy, a crucial value.
APPT per bar,
Average stop size,
Traded volume .
It also shows you on a trade-by-trade basis, on-going individual trade results and data.
In-trade events
In-trade events can plot reminders and trigger alerts when they occur. The built-in events are:
Price approaching stop,
Possible tops/bottoms,
Large stop movement (for discretionary trading where stop is moved manually),
Large price movements.
Slippage and Fees
Even when running in indicator mode, the Engine allows for slippage and fees to be included in the logic and test results.
Alerts
The alert creation mechanism allows you to configure alerts on any combination of the normal or pyramided entries, exits and in-trade events.
Backtesting results
A few words on the numbers calculated in the Engine. Priority is given to numbers not shown in TV backtesting, as you can readily convert the script to a strategy if you need them.
We have chosen to focus on numbers expressing results relative to X (the trade’s risk) rather than in absolute currency numbers or in other more conventional but less useful ways. For example, most of the individual trade results are not shown in percentages, as this unit of measure is often less meaningful than those expressed in units of risk (X). A trade that closes with a +25% result, for example, is a poor outcome if it was entered with a -50% stop. Expressed in X, this trade’s P&L becomes 0.5, which provides much better insight into the trade’s outcome. A trade that closes with a P&L of +2X has earned twice the risk incurred upon entry, which would represent a pre-trade risk:reward ratio of 2.
The way to go about it when you think in X’s and that you adopt the sound risk management policy to risk a fixed percentage of your account on each trade is to equate a currency value to a unit of X. E.g. your account is 10K USD and you decide you will risk a maximum of 1% of it on each trade. That means your unit of X for each trade is worth 100 USD. If your APPT is 2X, this means every time you risk 100 USD in a trade, you can expect to make, on average, 200 USD.
By presenting results this way, we hope that the Engine’s statistics will appeal to those cognisant of sound risk management strategies, while gently leading traders who aren’t, towards them.
We trade to turn in tangible profits of course, so at some point currency must come into play. Accordingly, some values such as equity, P&L, slippage and fees are expressed in currency.
Many of the usual numbers shown in TV backtests are nonetheless available, but they have been commented out in the Engine’s Plot module.
Position sizing and risk management
All good system designers understand that optimal risk management is at the very heart of all winning strategies. The risk in a trade is defined by the fraction of current equity represented by the amplitude of the stop, so in order to manage risk optimally on each trade, position size should adjust to the stop’s amplitude. Systems that enter trades with a fixed stop amplitude can get away with calculating position size as a fixed percentage of current equity. In the context of a test run where equity varies, what represents a fixed amount of risk translates into different currency values.
Dynamically adjusting position size throughout a system’s life is optimal in many ways. First, as position sizing will vary with current equity, it reproduces a behavioral pattern common to experienced traders, who will dial down risk when confronted to poor performance and increase it when performance improves. Second, limiting risk confers more predictability to statistical test results. Third, position sizing isn’t just about managing risk, it’s also about maximizing opportunity. By using the maximum leverage (no reference to trading on margin here) into the trade that your risk management strategy allows, a dynamic position size allows you to capture maximal opportunity.
To calculate position sizes using the fixed risk method, we use the following formula: Position = Account * MaxRisk% / Stop% [, which calculates a position size taking into account the trade’s entry stop so that if the trade is stopped out, 100 USD will be lost. For someone who manages risk this way, common instructions to invest a certain percentage of your account in a position are simply worthless, as they do not take into account the risk incurred in the trade.
The Engine lets you select either the fixed risk or fixed percentage of equity position sizing methods. The closest thing to dynamic position sizing that can currently be done with alerts is to use a bot that allows syntax to specify position size as a percentage of equity which, while being dynamic in the sense that it will adapt to current equity when the trade is entered, does not allow us to modulate position size using the stop’s amplitude. Changes to alerts are on the way which should solve this problem.
In order for you to simulate performance with the constraint of fixed position sizing, the Engine also offers a third, less preferable option, where position size is defined as a fixed percentage of initial capital so that it is constant throughout the test and will thus represent a varying proportion of current equity.
Let’s recap. The three position sizing methods the Engine offers are:
1. By specifying the maximum percentage of risk to incur on your remaining equity, so the Engine will dynamically adjust position size for each trade so that, combining the stop’s amplitude with position size will yield a fixed percentage of risk incurred on current equity,
2. By specifying a fixed percentage of remaining equity. Note that unless your system has a fixed stop at entry, this method will not provide maximal risk control, as risk will vary with the amplitude of the stop for every trade. This method, as the first, does however have the advantage of automatically adjusting position size to equity. It is the Engine’s default method because it has an equivalent in TV backtesting, so when flipping between indicator and strategy mode, test results will more or less correspond.
3. By specifying a fixed percentage of the Initial Capital. While this is the least preferable method, it nonetheless reflects the reality confronted by most system designers on TradingView today. In this case, risk varies both because the fixed position size in initial capital currency represents a varying percentage of remaining equity, and because the trade’s stop amplitude may vary, adding another variability vector to risk.
Note that the Engine cannot display equity results for strategies entering trades for a fixed amount of shares/contracts at a variable price.
SETTINGS/INPUTS
Because the initial text first published with a script cannot be edited later and because there are just too many options, the Engine’s Inputs will not be covered in minute detail, as they will most certainly evolve. We will go over them with broad strokes; you should be able to figure the rest out. If you have questions, just ask them here or in the PineCoders Telegram group.
Display
The display header’s checkbox does nothing.
For the moment, only one exit strategy uses a take profit level, so only that one will show information when checking “Show Take Profit Level”.
Entries
You can activate two simultaneous entry strats, each selected from the same set of strats contained in the Engine. If you select two and they fire simultaneously, the main strat’s signal will be used.
The random strat in each list uses a different seed, so you will get different results from each.
The “Filter transitions” and “Filter states” strats delegate signal generation to the selected filter(s). “Filter transitions” signals will only fire when the filter transitions into bull/bear state, so after a trade is stopped out, the next entry may take some time to trigger if the filter’s state does not change quickly. When you choose “Filter states”, then a new trade will be entered immediately after an exit in the direction the filter allows.
If you select “External Indicator”, your indicator will need to generate a +2/-2 (or a positive/negative stop value) to enter a long/short position, providing the selected filters allow for it. If you wish to use the Engine’s capacity to also derive the entry stop level from your indicator’s signal, then you must explicitly choose this option in the Entry Stops section.
Filters
You can activate as many filters as you wish; they are additive. The “Maximum stop allowed on entry” is an important component of proper risk management. If your system has an average 3% stop size and you need to trade using fixed position sizes because of alert/execution bot limitations, you must use this filter because if your system was to enter a trade with a 15% stop, that trade would incur 5 times the normal risk, and its result would account for an abnormally high proportion in your system’s performance.
Remember that any filter can also be used as an entry signal, either when it changes states, or whenever no trade is active and the filter is in a bull or bear mode.
Entry Stops
An entry stop must be selected in the Engine, as it requires a stop level before the in-trade stop is calculated. Until the selected in-trade stop strat generates a stop that comes closer to price than the entry stop (or respects another one of the in-trade stops kick in strats), the entry stop level is used.
It is here that you must select “External Indicator” if your indicator supplies a +price/-price value to be used as the entry stop. A +price is expected for a long entry and a -price value will enter a short with a stop at price. Note that the price is the absolute price, not an offset to the current price level.
In-Trade Stops
The Engine comes with many built-in in-trade stop strats. Note that some of them share the “Length” and “Multiple” field, so when you swap between them, be sure that the length and multiple in use correspond to what you want for that stop strat. Suggested defaults appear with the name of each strat in the dropdown.
In addition to the strat you wish to use, you must also determine when it kicks in to replace the initial entry’s stop, which is determined using different strats. For strats where you can define a positive or negative multiple of X, percentage or fixed value for a kick-in strat, a positive value is above the trade’s entry fill and a negative one below. A value of zero represents breakeven.
Pyramiding
What you specify in this section are the rules that allow pyramiding to happen. By themselves, these rules will not generate pyramiding entries. For those to happen, entry signals must be issued by one of the active entry strats, and conform to the pyramiding rules which act as a filter for them. The “Filter must allow entry” selection must be chosen if you want the usual system’s filters to act as additional filtering criteria for your pyramided entries.
Hard Exits
You can choose from a variety of hard exit strats. Hard exits are exit strategies which signal trade exits on specific events, as opposed to price breaching a stop level in In-Trade Stops strategies. They are self-explanatory. The last one labelled When Take Profit Level (multiple of X) is reached is the only one that uses a level, but contrary to stops, it is above price and while it is relative because it is expressed as a multiple of X, it does not move during the trade. This is the level called Take Profit that is show when the “Show Take Profit Level” checkbox is checked in the Display section.
While stops focus on managing risk, hard exit strategies try to put the emphasis on capturing opportunity.
Slippage
You can define it as a percentage or a fixed value, with different settings for entries and exits. The entry and exit markers on the chart show the impact of slippage on the entry price (the fill).
Fees
Fees, whether expressed as a percentage of position size in and out of the trade or as a fixed value per in and out, are in the same units of currency as the capital defined in the Position Sizing section. Fees being deducted from your Capital, they do not have an impact on the chart marker positions.
In-Trade Events
These events will only trigger during trades. They can be helpful to act as reminders for traders using the Engine as assistance to discretionary trading.
Post-Exit Analysis
It is normally on. Some of its results will show in the Global Numbers section of the Data Window. Only a few of the statistics generated are shown; many more are available, but commented out in the Plot module.
Date Range Filtering
Note that you don’t have to change the dates to enable/diable filtering. When you are done with a specific date range, just uncheck “Date Range Filtering” to disable date filtering.
Alert Triggers
Each selection corresponds to one condition. Conditions can be combined into a single alert as you please. Just be sure you have selected the ones you want to trigger the alert before you create the alert. For example, if you trade in both directions and you want a single alert to trigger on both types of exits, you must select both “Long Exit” and “Short Exit” before creating your alert.
Once the alert is triggered, these settings no longer have relevance as they have been saved with the alert.
When viewing charts where an alert has just triggered, if your alert triggers on more than one condition, you will need the appropriate markers active on your chart to figure out which condition triggered the alert, since plotting of markers is independent of alert management.
Position sizing
You have 3 options to determine position size:
1. Proportional to Stop -> Variable, with a cap on size.
2. Percentage of equity -> Variable.
3. Percentage of Initial Capital -> Fixed.
External Indicator
This is where you connect your indicator’s plot that will generate the signals the Engine will act upon. Remember this only works in Indicator mode.
DATA WINDOW INFORMATION
The top part of the window contains global numbers while the individual trade information appears in the bottom part. The different types of units used to express values are:
curr: denotes the currency used in the Position Sizing section of Inputs for the Initial Capital value.
quote: denotes quote currency, i.e. the value the instrument is expressed in, or the right side of the market pair (USD in EURUSD ).
X: the stop’s amplitude, itself expressed in quote currency, which we use to express a trade’s P&L, so that a trade with P&L=2X has made twice the stop’s amplitude in profit. This is sometimes referred to as R, since it represents one unit of risk. It is also the unit of measure used in the APPT, which denotes expected reward per unit of risk.
X%: is also the stop’s amplitude, but expressed as a percentage of the Entry Fill.
The numbers appearing in the Data Window are all prefixed:
“ALL:” the number is the average for all first entries and pyramided entries.
”1ST:” the number is for first entries only.
”PYR:” the number is for pyramided entries only.
”PEA:” the number is for Post-Exit Analyses
Global Numbers
Numbers in this section represent the results of all trades up to the cursor on the chart.
Average Profitability Per Trade (X): This value is the most important gauge of your strat’s worthiness. It represents the returns that can be expected from your strat for each unit of risk incurred. E.g.: your APPT is 2.0, thus for every unit of currency you invest in a trade, you can on average expect to obtain 2 after the trade. APPT is also referred to as “statistical expectancy”. If it is negative, your strategy is losing, even if your win rate is very good (it means your winning trades aren’t winning enough, or your losing trades lose too much, or both). Its counterpart in currency is also shown, as is the APPT/bar, which can be a useful gauge in deciding between rivalling systems.
Profit Factor: Gross of winning trades/Gross of losing trades. Strategy is profitable when >1. Not as useful as the APPT because it doesn’t take into account the win rate and the average win/loss per trade. It is calculated from the total winning/losing results of this particular backtest and has less predictive value than the APPT. A good profit factor together with a poor APPT means you just found a chart where your system outperformed. Relying too much on the profit factor is a bit like a poker player who would think going all in with two’s against aces is optimal because he just won a hand that way.
Win Rate: Percentage of winning trades out of all trades. Taken alone, it doesn’t have much to do with strategy profitability. You can have a win rate of 99% but if that one trade in 100 ruins you because of poor risk management, 99% doesn’t look so good anymore. This number speaks more of the system’s profile than its worthiness. Still, it can be useful to gauge if the system fits your personality. It can also be useful to traders intending to sell their systems, as low win rate systems are more difficult to sell and require more handholding of worried customers.
Equity (curr): This the sum of initial capital and the P&L of your system’s trades, including fees and slippage.
Return on Capital is the equivalent of TV’s Net Profit figure, i.e. the variation on your initial capital.
Maximum drawdown is the maximal drawdown from the highest equity point until the drop . There is also a close to close (meaning it doesn’t take into account in-trade variations) maximum drawdown value commented out in the code.
The next values are self-explanatory, until:
PYR: Avg Profitability Per Entry (X): this is the APPT for all pyramided entries.
PEA: Avg Max Opp . Available (X): the average maximal opportunity found in the Post-Exit Analyses.
PEA: Avg Drawdown to Max Opp . (X): this represents the maximum drawdown (incurred from the close at the beginning of the PEA analysis) required to reach the maximal opportunity point.
Trade Information
Numbers in this section concern only the current trade under the cursor. Most of them are self-explanatory. Use the description’s prefix to determine what the values applies to.
PYR: Avg Profitability Per Entry (X): While this value includes the impact of all current pyramided entries (and only those) and updates when you move your cursor around, P&L only reflects fees at the trade’s last bar.
PEA: Max Opp . Available (X): It’s the most profitable close reached post-trade, measured from the trade’s Exit Fill, expressed in the X value of the trade the PEA follows.
PEA: Drawdown to Max Opp . (X): This is the maximum drawdown from the trade’s Exit Fill that needs to be sustained in order to reach the maximum opportunity point, also expressed in X. Note that PEA numbers do not include slippage and fees.
EXTERNAL SIGNAL PROTOCOL
Only one external indicator can be connected to a script; in order to leverage its use to the fullest, the engine provides options to use it as either an entry signal, an entry/exit signal or a filter. When used as an entry signal, you can also use the signal to provide the entry’s stop. Here’s how this works:
For filter state: supply +1 for bull (long entries allowed), -1 for bear (short entries allowed).
For entry signals: supply +2 for long, -2 for short.
For exit signals: supply +3 for exit from long, -3 for exit from short.
To send an entry stop level with an entry signal: Send positive stop level for long entry (e.g. 103.33 to enter a long with a stop at 103.33), negative stop level for short entry (e.g. -103.33 to enter a short with a stop at 103.33). If you use this feature, your indicator will have to check for exact stop levels of 1.0, 2.0 or 3.0 and their negative counterparts, and fudge them with a tick in order to avoid confusion with other signals in the protocol.
Remember that mere generation of the values by your indicator will have no effect until you explicitly allow their use in the appropriate sections of the Engine’s Settings/Inputs.
An example of a script issuing a signal for the Engine is published by PineCoders.
RECOMMENDATIONS TO ASPIRING SYSTEM DESIGNERS
Stick to higher timeframes. On progressively lower timeframes, margins decrease and fees and slippage take a proportionally larger portion of profits, to the point where they can very easily turn a profitable strategy into a losing one. Additionally, your margin for error shrinks as the equilibrium of your system’s profitability becomes more fragile with the tight numbers involved in the shorter time frames. Avoid <1H time frames.
Know and calculate fees and slippage. To avoid market shock, backtest using conservative fees and slippage parameters. Systems rarely show unexpectedly good returns when they are confronted to the markets, so put all chances on your side by being outrageously conservative—or a the very least, realistic. Test results that do not include fees and slippage are worthless. Slippage is there for a reason, and that’s because our interventions in the market change the market. It is easier to find alpha in illiquid markets such as cryptos because not many large players participate in them. If your backtesting results are based on moving large positions and you don’t also add the inevitable slippage that will occur when you enter/exit thin markets, your backtesting will produce unrealistic results. Even if you do include large slippage in your settings, the Engine can only do so much as it will not let slippage push fills past the high or low of the entry bar, but the gap may be much larger in illiquid markets.
Never test and optimize your system on the same dataset , as that is the perfect recipe for overfitting or data dredging, which is trying to find one precise set of rules/parameters that works only on one dataset. These setups are the most fragile and often get destroyed when they meet the real world.
Try to find datasets yielding more than 100 trades. Less than that and results are not as reliable.
Consider all backtesting results with suspicion. If you never entertained sceptic tendencies, now is the time to begin. If your backtest results look really good, assume they are flawed, either because of your methodology, the data you’re using or the software doing the testing. Always assume the worse and learn proper backtesting techniques such as monte carlo simulations and walk forward analysis to avoid the traps and biases that unchecked greed will set for you. If you are not familiar with concepts such as survivor bias, lookahead bias and confirmation bias, learn about them.
Stick to simple bars or candles when designing systems. Other types of bars often do not yield reliable results, whether by design (Heikin Ashi) or because of the way they are implemented on TV (Renko bars).
Know that you don’t know and use that knowledge to learn more about systems and how to properly test them, about your biases, and about yourself.
Manage risk first , then capture opportunity.
Respect the inherent uncertainty of the future. Cleanse yourself of the sad arrogance and unchecked greed common to newcomers to trading. Strive for rationality. Respect the fact that while backtest results may look promising, there is no guarantee they will repeat in the future (there is actually a high probability they won’t!), because the future is fundamentally unknowable. If you develop a system that looks promising, don’t oversell it to others whose greed may lead them to entertain unreasonable expectations.
Have a plan. Understand what king of trading system you are trying to build. Have a clear picture or where entries, exits and other important levels will be in the sort of trade you are trying to create with your system. This stated direction will help you discard more efficiently many of the inevitably useless ideas that will pop up during system design.
Be wary of complexity. Experienced systems engineers understand how rapidly complexity builds when you assemble components together—however simple each one may be. The more complex your system, the more difficult it will be to manage.
Play! . Allow yourself time to play around when you design your systems. While much comes about from working with a purpose, great ideas sometimes come out of just trying things with no set goal, when you are stuck and don’t know how to move ahead. Have fun!
@LucF
NOTES
While the engine’s code can supply multiple consecutive entries of longs or shorts in order to scale positions (pyramid), all exits currently assume the execution bot will exit the totality of the position. No partial exits are currently possible with the Engine.
Because the Engine is literally crippled by the limitations on the number of plots a script can output on TV; it can only show a fraction of all the information it calculates in the Data Window. You will find in the Plot Module vast amounts of commented out lines that you can activate if you also disable an equivalent number of other plots. This may be useful to explore certain characteristics of your system in more detail.
When backtesting using the TV backtesting feature, you will need to provide the strategy parameters you wish to use through either Settings/Properties or by changing the default values in the code’s header. These values are defined in variables and used not only in the strategy() statement, but also as defaults in the Engine’s relevant Inputs.
If you want to test using pyramiding, then both the strategy’s Setting/Properties and the Engine’s Settings/Inputs need to allow pyramiding.
If you find any bugs in the Engine, please let us know.
THANKS
To @glaz for allowing the use of his unpublished MA Squize in the filters.
To @everget for his Chandelier stop code, which is also used as a filter in the Engine.
To @RicardoSantos for his pseudo-random generator, and because it’s from him that I first read in the Pine chat about the idea of using an external indicator as input into another. In the PineCoders group, @theheirophant then mentioned the idea of using it as a buy/sell signal and @simpelyfe showed a piece of code implementing the idea. That’s the tortuous story behind the use of the external indicator in the Engine.
To @admin for the Volatility stop’s original code and for the donchian function lifted from Ichimoku .
To @BobHoward21 for the v3 version of Volatility Stop .
To @scarf and @midtownsk8rguy for the color tuning.
To many other scripters who provided encouragement and suggestions for improvement during the long process of writing and testing this piece of code.
To J. Welles Wilder Jr. for ATR, used extensively throughout the Engine.
To TradingView for graciously making an account available to PineCoders.
And finally, to all fellow PineCoders for the constant intellectual stimulation; it is a privilege to share ideas with you all. The Engine is for all TradingView PineCoders, of course—but especially for you.
Look first. Then leap.

Study Backtester [MS]Backtest your study like a strategy with our Study Backtester. Visualize your script's performance directly on the chart.
Simple to use, copy-paste a few lines of code (shown below) into your script, then set your script as input to the Study Backtester.
Visualize how your script performs against buy-and-hold over time, and get a nice print out of stats.
Settings
Set your buy and sell signal inputs
Add a stop loss
Choose normal or trailing stop loss
Choose the start date and time for backtesting
Set trading commissions
Use leverage or not
Set carry cost for leveraged trades
Version 1
Only supports buy-sell-buy-sell alternating signals. Any non-alternating signals will be ignored.
Testing begins with 1 share of the asset at your first buy signal.
Things To Note
This cannot enter or exit mid-candle. With the exception of the stop loss feature, which will calculate exits at the exact stop price.
Stops are not treated as stop-orders, but as market-exists at the stop (or trailing stop) price.
This DOES NOT take into account any loss of funds due to liquidation if price goes against you in a margin position.
Short positions are not currently supported.
Only `study` scripts are supported
How To Use
1) Add the following to the bottom your study's code.
//------------------------------------------------------------------------------
// FOR BACKTESTER
plot(buy ? 1 : sell ? -1 : na, title="Signals", display=display.none, editable=false)
2) Make sure `buy` and `sell` variables are assigned appropriately according to your strategy.
3) Add both your study and this script to your chart.
4) Set the "Signals Plot" setting of this script to: : Signals
5) Adjust this script's settings (start date, commission, stoploss, etc) as necessary.
PM us with any questions about this script.

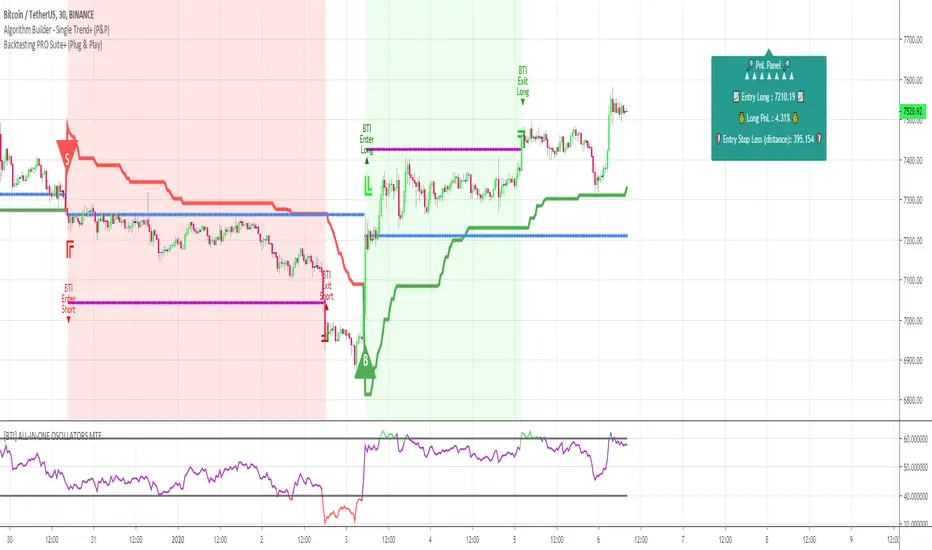
Backtest PRO Suite+ (Plug & Play)Hello traders
I. SCRIPTS ACCESS AND TRIALS
1. For the trial request access, they have to be done through my website .
2. My website URL is in this script signature at the very bottom (you'll have to scroll down a bit and going past the long description) and in my profile status available here : Daveatt
Due to the new scripts publishing house rules, I won't mention the URL here directly. As I value my partnership with TradingView very much, I prefer showing you the way for finding them :)
3. Many video tutorials explaining clearly how all our indicators work are available on your website > guides section.
4. You may also contact me directly for more information
II. Backtest PRO Suite+ (Plug & Play)
2.1 Forewords
This indicator is available only to our PRO 12 months users. YES! I said indicator, and not strategy or backtest for an excellent reason.
We wanted to make it as generic as possible and allow anyone to connect any indicator of his/her choice in a few clicks only.
This is NOT possible (in TradingView) with a strategy/backtest, but only with an indicator - that's why we worked on recoding the whole backtest logic as an indicator.
The PRO edition does not handle any pyramiding/re-entry - as such enters only once per trend by design. This feature is reserved for our PREMIUM users.
2.2 🔎 Concept 🔎
This is an indicator that I saw on TradingView and was introduced by the @Pinecoders account on TradingView.
I inspired myself from his Backtest Engine to offer a version more adapted to my vision - The benefits of connecting yourself any indicator to our Backtest engine are amazing and huge.
The concept can't be more simple. Imagine using any indicator and connecting to a backtest system in a single click.
You may connect your Algorithm Builder also to this complete backtesting system in a single click.
What's better between paying thousands for a backtest, or connecting yourself your indicator to your backtest with a click?
That was a rhetoric question, but you can still share your answer with me if you want to :)
III. The amazing benefits of our🔌&🕹️ (Plug&Play) system
Issue #1 💲 A BACKTEST SYSTEM IS COSTLY 💲
Hiring a developer to code a custom indicator is costly. For a custom backtest it's even more expensive as those scripts are very often way more complicated.
Now imagine, that now that you see your idea live on a chart, you'll realize you'll have to finance another backtest system, as the one you have is not compatible with your new idea.
Solution #1 💲💲 YOU COULD BE SAVING SOME MONEY 💲💲
just because it won't be needed to hire someone else for each of your trading idea.
We will never guarantee your success on the market, but THIS I stand by it any day any hour.
You can connect any indicator or your choice by updating your indicator slightly and connecting it to our Backtest engine. We send the tutorial for doing it to all our customers.
Issue #2 🕔 IT'S TIME-CONSUMING 🕔
Even if someone is doing all the coding for you, it might require days/weeks depending on your overall trading strategy/idea.
Without even counting the time for you to test/validate the work done and all the back-and-forth to fix all the issues.
Solution #2 SAVING TIME MIGHT EQUATES TO SAVING MONEY : 🕔 = 💲💲💲
I wish it could be as easy as going from weeks of coding to "1 single click" :)
I did the heavy-lifting, but you'll have to make the last effort the cross the finishing line. I made it easy for you to play with it and find a configuration that makes sense to YOU and for your strategy/asset/timeframe
Issue #3 ❌ IT'S COMPLICATED ❌
Someone did a backtest code for you, but... you can't update it because you either :
- don't know anything in programming
- ... and don't have time to learn (most of us have a job/family/...life)
- The system you have is way too specific for one of your previous idea, but can't be updated easily for your next trading ideas. I see a lot of traders nodding right now thinking "that's soooooo true !!!!"
Solution #3 🎉 WE MADE IT EASY AND FUN 🎉
Our goal is to externalize the technical stuff that you don't want to take care of - so that you can finally focus on your trading and optimizing your ideas. #bold #statement
In case you're wondering, no we're not reading your mind :), but we're also traders who didn't know how to code before and had to hire external programmers to do the heavy work for us.
You can be sure that most of the frustrations (trading, technical, ...) you have/had, we had them also and that's why we created this backtest indicator.
III. 🔌&🕹️
Hope you're ready to be impressed. Because, what I'm about to introduce, is my best-seller feature - and available across many of my indicators.
In TradingView, there is a feature called "Indicator on Indicator" meaning you can use an external indicator as a data source for another indicator.
I'm using that feature to connect any external indicator to our Backtest PRO Suite+ (Plug & Play) - hence the plug and play name. Please don't make it a plug and pray :) it's supposed to help you out, not to stress you even more
Let's assume you want to connect your Algorithm Builder Single Trend+ to your Backtest PRO Suite+
I mentioned an Algorithm Builder but you may connect any oscillator (MACD, On balance volume, stochastic RSI, True Strenght index, and many more..) or non-oscillator (divergence, trendline break, higher highs/lower lows, candlesticks pattern, price action, harmonic patterns, ...) indicators.
THE SKY IS (or more likely your imagination) is the limit :)
Fear no more. The Plug&Play technology allows you to connect it and use it the backtest calculations.
This is not magic, neither is sorcery, but certainly is way beyond the most awesome thing I've ever developed on TradingView (even across all brokers I know). #bolder #statement
TradingView is the best trading platform by far and I'm very grateful to offer my indicators on their website.
To connect your external indicator to ours, we're using a native TradingView feature, which is not available for all users.
It depends on your TradingView subscription plan ( More info here )
If you intend to use our Algorithm Plug&Play indicator, and/or our Backtest Plug&Play suites, then you must upgrade your TradingView account to enjoy those features.
We value our relationship with our customers seriously, and that's why we're warning you that a compatible TradingView account type is required - at least PRO+ or PREMIUM to add more than 1 Plug&Play indicator per account.
We go in-depth on our website why the Plug&Play is an untapped opportunity for many traders out there - URL available on my profile status and signature
IV. 📊 Make it nice! 📊
Now we're getting right into the fun stuff.
Let's explore briefly each display option (symbolized by a 👁️🗨️ in the Backtest UI) :
- Color Traded Background : Color the chart background is green when in a BUY trade, in red when in a SELL trade. If the Backtest is not in a trade, then the background won't be colored.
- Show Entry/Exit Markers : Displays the entries (Enter Long/Enter Short), and exits (Exit Long/Exit Short) labels.
- Show Entry Level :Displays a blue level line to easily identify the entry price of a trade.
- Show Take Profit Level : Display a purple line to visualize where the Take Profit level is (we'll explain below how to set it up).
- Show In-Trade Stops : Display the stop-loss
V. Backtesting filters
A backtest should have some filters helping the traders testing a few hypotheses. Well.... we included a ton of them - even for the PRO version
Once again, thank you @Pinecoders for the help and support you gave me
5.1 ▄ █ Position sizing █ ▄
- 1. % of Equity: If selected, the position size used is the input to the right of 1. % of Equity.
Example: The trader starts with a capital of 100K. After a winning trade, your total capital is $103K - for the next trade the position size will be 3% of $103K
- 2. % of Capital: If selected, the position size used is the input to the right of 2. % of Capital.
In other words, the position size will always be the same position size as calculated on the initial capital.
Example: The trader starts with a capital of 100K. After a winning trade, your total capital is $103K - for the next trade the position size will be 5% of $100K. (As 100K is the initial capital used in our dummy example)
5.2⛔ Entry Stops and In-Trade Stops ⛔
We didn't reinvent the wheel here. Any good backtest should offer an entry stop-loss and an in-trade stop-loss.
Giving only here also an example among all the use cases. For instance, the trader sets a stop-loss 2% at the time of entry on your trade, but once the trade moves in the desired direction, the trader might want a trailing stop-loss using a 4% input.
Example: A trader goes LONG on only 1 "ABC" stock evaluated $10 per share.
1) The entry-stop loss will be 2% away so set at $8
2) A candle
3) The trailing stop will activate, and move the stop-loss from the entry stop-loss level (=$8) to $8.32 (=4% move up from $8) - and so on, and so forth for each time the price moves 4% up
The entry and in-trade stop losses can absolutely be identicals. There is no universal rule, and as always you know the drill - all depends on your backtest, and indicator configurations as a whole.
Last, but not the least, selecting an Entry stop-loss is mandatory, but the in-trade stop-loss is not. Up to you to decide if the in-trade SL is needed for your Backtest strategy.
5.3 ❌ Hard Exits ❌
We included the MACD hard exit indicator in the backtest - as we did also for the Algorithm Builders.
The hard exit (or invalidation) is a fundamental part of my trading method.
I explained numerous times on TradingView, our website, and social media channels why I "love" this concept so much, and how it saved my trading account numerous times from getting savagely wrecked by the market.
5.4 💲💲 Take Profit 💲💲
We only included 1 level of Take Profit so far. We'll work on adding at least one more soon.
You can set your Take Profit level based on either a:
1- Fixed value
2 - Percentage value
5.5 📆 Date Range Filtering 📆
If enabled, the backtest only uses the data between the starting and the ending dates of the defined range.
5.6 ❗❗ Fees and Slippage ❗❗
Too often completely ignored by many traders, the fees can eat gains out quickly/deepen one's capital faster than expected.
⚠️The fees vary between brokers, and asset traded - it could be recommended to check on your broker page what are the fees for the asset on your chart, and insert that percentage number.
Another cost ignored, even more, is the Slippage.
i.e. think about a Stop-Loss being hit, and we're so confused because we see on the chart that NEVER the price came even close to your SL level, but... it got hit anyway.
Yes! we know how frustrating it is, but that's the game we're playing, and trading should never be about blaming the game, but only blaming the players/traders/ourselves.
Blaming the game constantly is likely to not end with good performance results, but accounting for this "risk", and being able to quantify it is an incredible hedge. #bold #statement #level #10000
5.7 🔔 Alerts 🔔
By design, the alerts aren't available for strategy scripts. But this script is an... indicator so why should we not enjoy all the cards in our hands the fullest.
We enabled the alerts on those Backtest Entry/Exit signals. You're welcome :)
VI. 📝 Where are the backtest results? 📝
Answer: in the Data Window section of your TradingView
Now the cherry on the cake if we might say so. A backtest is cool, but visualizing results is actually the end goal here.
The Data Window is dynamic - it means whenever you'll mouseover at a give time on your chart, the data on that panel automatically updates.
Let's assume you're backtesting your idea between Sept 1st, 2019, and Oct 1st, 2019.
If your mouse cursor is located (or hovered) at a candle on Sept 14th, 2019 (data chosen randomly for this example), then the data displayed only includes the results between Sept 1st, and Sept 14th.
More info available on our website with a nice tutorial video. Data window metrics and filters explained on our website
Here's what the data window looks like: imgur.com
If you have any doubt or question, please hit me up directly or ask in the comments section of this script.
I'll never claim I have the best trading methodology or the best indicators.
You only will judge and I'll appreciate all the questions and feedback you're sending my way.
They help me a ton to develop indicators based on all the requests I received.
Kind regards,
Dave
Backtest - Strategy Builder [AlgoAlpha]🟠 OVERVIEW
This script by AlgoAlpha is a modular Strategy Builder designed to let traders test custom trade entry and exit logic on TradingView without writing their own Pine code. It acts as a framework where users can connect multiple external signals, chain them in sequences, and run backtests with built-in leverage, margin, and risk controls. Its main strength is flexibility—you can define up to five sequential steps for entry and exit conditions on both long and short sides, with logic connectors (AND/OR) controlling how conditions combine. This lets you test complex multi-step confirmation workflows in a controlled, visual backtesting environment.
🟠 CONCEPTS
The system works by linking external signals —these can be values from other indicators, and/or custom sources—to conditional checks like “greater than,” “less than,” or “crossover.” You can stack these checks into steps , where all conditions in a step must pass before the sequence moves to the next. This creates a chain of logic that must be completed before a trade triggers. On execution, the strategy sizes positions according to your chosen leverage mode ( Cross or Isolated ) and allocation method ( Percent of equity or absolute USD value]). Liquidation prices are simulated for both modes, allowing realistic margin behaviour in testing. The script also tracks performance metrics like Sharpe, Sortino, profit factor, drawdown, and win rate in real time.
🟠 FEATURES
Up to 5 sequential steps for both long and short entries, each with multiple conditions linked by AND/OR logic.
Two leverage modes ( Cross and Isolated ) with independent long/short leverage multipliers.
Separate multi-step exit triggers for longs and shorts, with optional TP/SL levels or opposite-side triggers for flipping positions.
Position sizing by equity percent or fixed USD amount, applied before leverage.
Realistic liquidation price simulation for margin testing.
Built-in trade gating and validation—prevents trades if configuration rules aren’t met (e.g., no exit defined for an active side).
Full performance dashboard table showing live strategy status, warnings, and metrics.
Configurable bar coloring based on position side and TP/SL level drawing on chart.
Integration with TradingView's strategy backtester, allowing users to view more detailed metrics and test the strategy over custom time horizons.
🟠 USAGE
Add the strategy to your chart. In the settings, under Master Settings , enable longs/shorts, select leverage mode, set leverage multipliers, and define position sizing. Then, configure your Long Trigger and Short Trigger groups: turn on conditions, pick which external signal they reference, choose the comparison type, and assign them to a sequence step. For exits, use the corresponding Exit Long Trigger and Exit Short Trigger groups, with the option to link exits to opposite-side entries for auto-flips. You can also enable TP and/or SL exits with custom sources for the TP/SL levels. Once set, the strategy will simulate trades, show performance stats in the on-chart table, and highlight any configuration issues before execution. This makes it suitable for testing both simple single-signal systems and complex, multi-filtered strategies under realistic leverage and margin constraints.
🟠 EXAMPLE
The backtester on its own does not contain any indicator calculation; it requires input from external indicators to function. In this example, we'll be using AlgoAlpha's Smart Signals Assistant indicator to demonstrate how to build a strategy using this script.
We first define the conditions beforehand:
Entry :
Longs – SSA Bullish signal (strong OR weak)
Shorts – SSA Bearish signal (strong OR weak)
Exit
Longs/Shorts: (TP/SL hit OR opposing signal fires)
Other Parameters (⚠️Example only, tune this based on proper risk management and settings)
Long Leverage: default (3x)
Short Leverage: default (3x)
Position Size: default (10% of equity)
Steps
Load up the required indicators (in this example, the Smart Signals Assistant).
Ensure the required plots are being output by the indicator properly (signals and TP/SL levels are being plotted).
Open the Strategy Builder settings and scroll down to "CONDITION SETUP"; input the signals from the external indicator.
Configure the exit conditions, add in the TP/SL levels from the external indicator, and add an additional exit condition → {{Opposite Direction}} Entry Trigger.
After configuring the entry and exit conditions, the strategy should now be running. You can view information on the strategy in TradingView's backtesting report and also in the Strategy Builder's information table (default top right corner).
It is important to note that the strategy provided above is just an example, and the complexity of possible strategies stretches beyond what was shown in this short demonstration. Always incorporate proper risk management and ensure thorough testing before trading with live capital.

Backtesting- IndicatorFor anyone interested, Here is an example of how to put backtesting results into an Indicator. This calculates the same values as you find in the Summary Screen of the built in Strategy backtester. This will use the same result size as the standard backtester i.e. 5 minute chart grabs roughly 1 month of data, 1 minute chart grabs 1 week of data, etc... I tried to keep this as self-contained as possible so I put most of the code for the results in the bottom of the Indicator. The results stop at the last completed trade signal i.e. a Buy has a Sell to it. This is the same indicator I posted earlier with the PCT Trailing StopLoss so you will see that code in here as well. As said in my previous posting, the indicator is just a simple EMA crossover to give it something to do and I would not recommend using this indicator on its own, but instead copy the code to your own indicator if you find it useful. I also left the code in so that you can switch back to a Strategy if you want to verify the results.
Additional Notes:
- The results are within an acceptable margin of error due to the fact that the Indicator is having to calculate based on when the Buy and Sell Signal occur as opposed to when actual trades occur like in the Strategy Backtester
- I was trying to find a way to set the number of Buy Signals to use i.e. show me the results from the past 100 trades but couldn't sort out the logic. I am open to suggestions. Also keep in mind I am not a coder by profession so if you have any ideas on that front, please explain it to me as though I am a 5 year old child and provide code examples if possible :)
- I included the Strategy results in the Screen Shots so that you can see where the results line up.
Additional Additional Note:
This is not financial advice. Use at your own risk.

Backtest HelperAre you tired of being able to see the future while you're backtesting? Have you ever clicked to a higher timeframe in bar replay, only to realize you've just seen everything that's going to happen before you've had a chance to test it? If you've had this problem, Backtest Helper is here for YOU.
All you have to do is set a start date and time, then set your desired timeframe in minutes, then you're off to the races.
For example, if you're a scalper that uses the 15 minute as their higher timeframe, set your start time at the 14th minute of the session you're testing and set your line spacing at 15 minutes. This will mark off every 14th minute on the charts. Now you know the exact moment you can go up to the 15 minute timeframe!
On our 1 minute timeframe, this is how we'd look with the above settings. The Backtest Helper has marked off the 14th, 29th, 44th and 59th minute.
When we go up to our 15 minute, there's no issues. We're seeing the candle we want to see and not the next 15 minute candle.
You can use this for any timeframe. Just make sure you set your start time to at least 1 minute before the close of the candle and your line spacing to the higher timeframe (in minutes) you want to target.
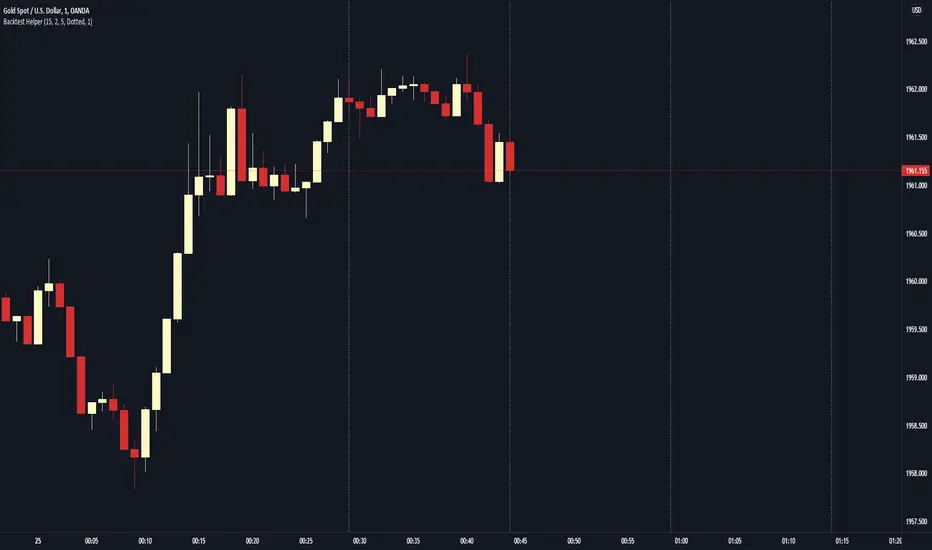
Backtest Service Program (BASE) [FAF-Software-Solutions]{Deutsche Beschreibung folgt der englischen Beschreibung}
█ OVERVIEW
With BASE you can quick and easy create, test or optimize seasonal trading strategies. Seasonality is a strong, if not the strongest, trading approach to making money in the capital markets over the long term. Whether individually or in combination with other strategies, seasonality is a tool for your trading that should not be underestimated.
We have packed this script with everything you need for a meaningful seasonal analysis. Define entry and exit times according to day of the week, day of the month and the month itself, very easily via the settings window. Determine the period to be evaluated and, if desired, add a stop loss and / or a take profit to add a healthy risk and money management to your strategy. Since this is a pine strategy script, the usual trading view strategy parameters such as account size, commission, slippage, etc. are also available and you can set up your backtest even more realistically and therefore more truthfully.
Would you like to evaluate the behavior of a certain share over the turn of the year, would you like to find out which day of the week in gold has been the most profitable over the past 50 years or just check the "Sell in May" effect? This is exactly what we created this script for. With just a few clicks you can evaluate approaches such as the "Sell in May" effect or the "Santa Claus Rally", you can check which day of the week, which day of the month or which month is the strongest in an instrument and develop individual strategy systems from this.
█ FEATURES
The script input window has the following setting options:
• Backtest start / Backtest end: Set your Backtast Range here.
• Trade direction: Decide whether your strategy should open buy or sell positions.
• Pyramiding Indicates how many positions can be open at the same time (maximum 10 positions)
• Stop Loss / Take Profit: In order to optimize your strategy, you have the option of adding profit and loss levels (visible in the chart) to your open positions.
This enables you to adapt your trading system to your risk and money management. The stop and take profit levels are freely selectable.
• Entrys / Exits: Divided into days of the week, days of month and months itself, you can individually choose when you want to open and close a position.
• Advanced Filter: Seasonally, the 4-year election cycle of the US presidential election has a strong impact on the markets.
In order to be able to develop analyzes in connection with this cycle, there is an advanced filter to be able to filter the different election years.
█ HOW TO USE
After the script has been added to the chart, the input window opens immediately and you can easily select your strategy parameters. After confirming your selection, all trades will be added to the chart and you will find the key metrics for your system in the Tradingview Strategy Tester. If you have added a stop or profit level, you can also see this graphically in the chart and thus analyze every trade in the chart very precisely.
The entry and exit fields can be selected individually to be activated. If no selection is made, e.g. no selection for the weekday entry, then there is no longer any filtering and entry / exit is possible on any weekday. As soon as a selection is made under the entry / exit parameters, the system filters according to the criteria made during the selection. A position is always opened / closed at the closing price (close) of the candle, at which all selected criteria match.
█ LIMITATIONS
This script is just a tool for your trading. You dont receive any finished trading strategy or backtest, but a program with which you can create and optimize your own seasonal trading strategies without any programming knowledge.
This script was developed for seasonal back tests over a long history and therefore works best in a time resolution greater than or equal to the daily chart (1D).
█ IMPORTANT
The strategy results shown here were made with the default script settings in the SPX symbol. In order to test the pure seasonality, no slippage and commission are included in the default inputs. By default, 100% of the capital is used to open a position. These settings allow a quick check of seasonality without the distortion from commissions, slippage or margin calls, but to get a real strategy you need to add these things later. If you have identified a seasonal phase and want to build a trading strategy from it, you have to add realistic commission and slippage and adjust the positionsize. The backtesting results shown here are chosen randomly and are not a real strategy. The strategy key metrics are therefore not relevant and the chart is only used to illustrate the script design
Use the link below to get more information
═════════════════════════════════════════════════════════════════════════
█ ÜBERSICHT
Mit der BASE kannst Du schnell und unkompliziert saisonale Handelsstrategien erstellen, testen oder optimieren. Die Saisonalität ist ein starker, wenn nicht sogar der stärkste Handelsansatz, um langfristig Geld an den Kapitalmärkten zu verdienen. Ob nun einzeln oder in Kombination mit anderen Strategien, die Saisonalität ist ein nicht zu unterschätzendes Hilfsmittel für deinen Handel.
Dieses Skript haben wir mit allem vollgepackt was du für eine aussagekräftige saisonale Auswertung benötigst. Definiere Ein- und Ausstiegszeitpunkte nach Wochentag, Tag des Monats und dem Monat selbst, ganz einfach über das Einstellungsfenster. Bestimme den auszuwertenden Zeitraum und ergänze wenn gewünscht einen Stop Loss und/oder einen Take Profit um deiner Strategie ein gesundes Risiko- und Moneymanagement hinzuzufügen. Da es sich hierbei um ein Pine-Strategieskript handelt stehen Dir die üblichen Tradingview Strategieparameter wie Kontogröße, Kommission, Slippage usw. ebenfalls zur Verfügung und Du kannst deinen Backtest noch realistischer und damit auch wahrheitsgemäßer aufstellen.
Du möchtest das Verhalten einer bestimmten Aktie über den Jahreswechsel auswerten, möchtest herausfinden welcher Wochentag in Gold über die letzten 50 Jahre der profitabelste war oder einfach mal eben den "Sell in May" Ansatz überprüfen? Genau hierfür haben wir dieses Skript erstellt. Mit wenigen Klicks kannst Du Ansätze wie den "Sell in May" Effekt oder die "Santa Claus Rally" auswerten, kannst prüfen welcher Wochentag, welcher Tag des Monats oder welcher Monat der stärkste in einem Instrument ist und daraus ganz individuelle Strategie-Systeme entwickeln.
█ EIGENSCHAFTEN
Das Eingabefenster des Skripts hat folgende Einstellungsmöglichkeiten:
• Backtest start / Backtest end: Hier legst Du fest für welchen Zeitraum dein Backtest erstellt werden soll.
• Trade direction: In diesem Feld wird bestimmt ob die Positionen in Long- oder Short-Richtung eröffnet werden sollen.
• Pyramiding Gibt an wie viele Positionen zu selben Zeit offen stehen können (maximal 10 Positionen möglich)
• Stop Loss / Take Profit: Um deine Strategie optimieren zu können hast Du die Möglichkeit Gewinn- und Verlustlevel (sichtbar im Chart) zu deinen offenen Positionen hinzuzufügen.
Dadurch ist es Dir möglich dein Handelssystem an dein Risiko- und Moneymanagement anzupassen. Die Stop Loss und Take Profit Level sind frei wählbar.
• Entrys / Exits: Unterteilt in Wochentage, Kalendertage und Monate kannst Du hier ganz individuell auswählen zu welchem Zeitpunkt Du eine Position eröffnen und schließen möchtest.
• Advanced Filter: Saisonal betrachtet beeinflusst der 4-jährige Wahlzyklus der US-Präsidentschaftswahlen die Märkte stark.
Um Analysen im Zusammenhang mit diesem Zyklus entwickeln zu können gibt es hierfür einen erweiterten Filter um die verschiedenen Wahljahre filtern zu können.
█ ANWENDUNG
Nachdem das Skript auf den Chart aufgerufen wurde öffnet sich sofort das Eingabefenster in welchem Du deine Strategieparameter auswählen kannst. Nach dem Bestätigen der Auswahl kannst du sofort deine Trades auf dem Chart erkennen und hast über den Tradingview Strategie-Tester die Auswertung zu deinem System vorliegen. Wenn du ein Stop Loss oder Take Profit Level hinzugefügt hast kannst Du auch dieses grafisch auf dem Chart erkennen und so jeden Trade im Chart ganz genau analysieren.
Die Entry und Exit Felder können einzeln angewählt und somit aktiviert werden. Ist in einer Reihe wie beispielsweise den Wochentagen keiner der Tage ausgewählt so wird nicht mehr nach den Wochentagen gefiltert und ein Einstieg/ Ausstieg ist zu jedem Wochentag möglich. Sobald unter den Entry/ Exit Parametern eine Auswahl getroffen wird filtert das System nach den in der Auswahl getroffenen Kriterien. Es wird immer zum Schlusskurs (Close) der Kerze eingestiegen bei der alle ausgewählten Kriterien übereinstimmen.
█ EINSCHRÄNKUNGEN
Dieses Skript stellt ausschließlich ein Hilfsmittel für deinen Handel dar. Du erhältst keine fertigen Handelsstrategien oder Backtests sondern ein Tool mit welchem Du ohne Programmierkenntnisse in der Lage bist eigene saisonale Handelsstrategien zu erstellen und zu optimieren.
Das Skript wurde für saisonale Backtests über eine lange Historie entwickelt und arbeitet daher am besten in den Zeitfenstern größer oder gleich dem Tageschart (1D).
█ WICHTIG
Die hier gezeigten Strategieergebnisse wurden mit den Standard-Skripteinstellungen im SPX-Symbol erstellt. Um die reine Saisonalität zu testen, sind in den Standardeingaben keine Slippage und Provision enthalten. Standardmäßig wird 100% des Kapitals verwendet, um eine Position zu eröffnen. Diese Einstellungen ermöglichen eine schnelle Prüfung der Saisonalität ohne Verzerrungen durch Provisionen, Slippage oder Margin Calls. Um eine handelbare Strategie zu erhalten müssen die Angaben zu Slippage, Kommission und Positionsgröße aber später unbedingt ergänzt werden. Die hier gezeigten Backtesting-Ergebnisse wurden zufällig ausgewählt und sind keine echte Strategie. Die Strategiekennzahlen sind daher nicht relevant und das Chartbild dient nur zur Veranschaulichung des Skriptdesigns
Verwende den untenstehenden Link für mehr Informationen
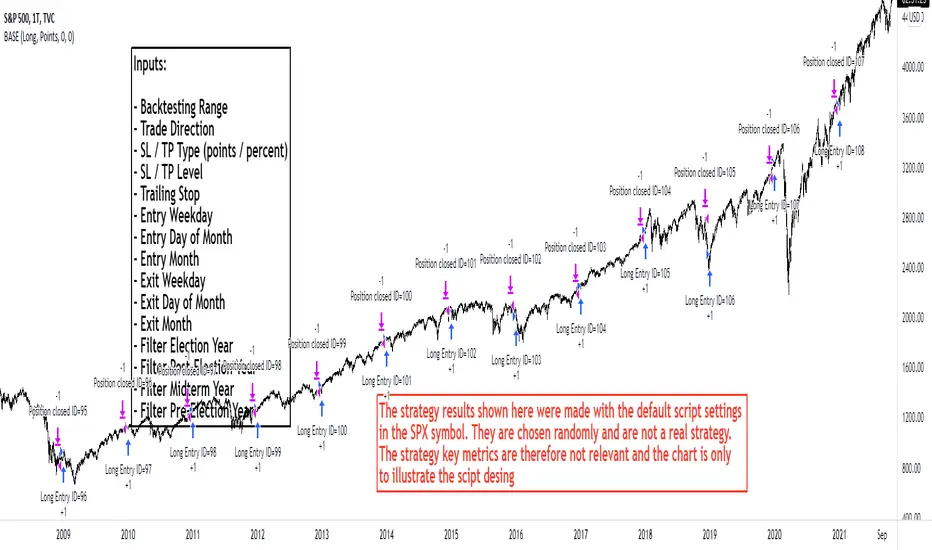
Backtest PREMIUM Suite+ (Plug & Play)Hello traders
I. 💎 SCRIPTS ACCESS AND TRIALS 💎
1. For the trial request access, they have to be done through my website .
2. My website URL is in this script signature at the very bottom (you'll have to scroll down a bit and going past the long description) and in my profile status available here : Daveatt
Due to the new scripts publishing house rules, I won't mention the URL here directly. As I value my partnership with TradingView very much, I prefer showing you the way for finding them :)
3. Many video tutorials explaining clearly how all our indicators work are available on our website > guides section.
4. You may also contact me directly for more information
II. 🔎 Backtest PREMIUM Suite+ (Plug & Play) 🔎
2.1 Forewords
This indicator is available only to our PREMIUM 12 months users. YES! I said indicator, and not strategy or backtest for an excellent reason.
We wanted to make it as generic as possible and allow anyone to connect any indicator of his/her choice in a few clicks only.
This is NOT possible (in TradingView) with a strategy/backtest, but only with an indicator - that's why we worked on recoding the whole backtest logic as an indicator.
The PRO edition does not handle any pyramiding/re-entry - as such enters only once per trend by design. This feature is reserved for our PREMIUM users.
2.2 Concept
This is an indicator that I saw on TradingView and was introduced by the @Pinecoders account on TradingView.
I inspired myself from his Backtest Engine to offer a version more adapted to my vision - The benefits of connecting yourself any indicator to our Backtest engine are amazing and huge.
The concept can't be more simple. Imagine using any indicator and connecting to a backtest system in a single click.
You may connect your Algorithm Builder also to this complete backtesting system in a single click.
What's better between paying thousands for each backtest, or connecting yourself your indicators to your backtest with a click?
That was a rhetoric question, but you can still share your answer with me if you want to :)
III. The amazing benefits of our🔌&🕹️ (Plug&Play) system
Issue #1 💲 A BACKTEST SYSTEM IS COSTLY 💲
Hiring a developer to code a custom indicator is costly. For a custom backtest it's even more expensive as those scripts are very often way more complicated.
Now imagine, that now that you see your idea live on a chart, you'll realize you'll have to finance another backtest system, as the one you have is not compatible with your new idea.
Solution #1 💲💲 YOU COULD BE SAVING SOME MONEY 💲💲
just because it won't be needed to hire someone else for each of your trading idea.
We will never guarantee your success on the market, but THIS I stand by it any day any hour.
You can connect any indicator or your choice by updating your indicator slightly and connecting it to our Backtest engine. We send the tutorial for doing it to all our customers.
Issue #2 🕔 IT'S TIME-CONSUMING 🕔
Even if someone is doing all the coding for you, it might require days/weeks depending on your overall trading strategy/idea.
Without even counting the time for you to test/validate the work done and all the back-and-forth to fix all the issues.
Solution #2 SAVING TIME MIGHT EQUATES TO SAVING MONEY : 🕔 = 💲💲💲
I wish it could be as easy as going from weeks of coding to "1 single click" :)
I did the heavy-lifting, but you'll have to make the last effort the cross the finishing line. I made it easy for you to play with it and find a configuration that makes sense to YOU and for your strategy/asset/timeframe
Issue #3 ❌ IT'S COMPLICATED ❌
Someone did a backtest code for you, but... you can't update it because you either :
- don't know anything in programming
- ... and don't have time to learn (most of us have a job/family/...life)
- The system you have is way too specific for one of your previous idea, but can't be updated easily for your next trading ideas. I see a lot of traders nodding right now thinking "that's soooooo true !!!!"
Solution #3 🎉 WE MADE IT EASY AND FUN 🎉
Our goal is to externalize the technical stuff that you don't want to take care of - so that you can finally focus on your trading and optimizing your ideas. #bold #statement
In case you're wondering, no we're not reading your mind :), but we're also traders who didn't know how to code before and had to hire external programmers to do the heavy work for us.
You can be sure that most of the frustrations (trading, technical, ...) you have/had, we had them also and that's why we created this backtest indicator.
III. 🔌&🕹️
Hope you're ready to be impressed. Because, what I'm about to introduce, is my best-seller feature - and available across many of my indicators.
In TradingView, there is a feature called "Indicator on Indicator" meaning you can use an external indicator as a data source for another indicator.
I'm using that feature to connect any external indicator to our Backtest PREMIUM Suite+ (Plug & Play) - hence the plug and play name. Please don't make it a plug and pray :) it's supposed to help you out, not to stress you even more
Let's assume you want to connect your Algorithm Builder Multiple Trends+ to your Backtest PREMIUM Suite+
I mentioned an Algorithm Builder but you may connect any oscillator (MACD, On balance volume, stochastic RSI, True Strenght index, and many more..) or non-oscillator (divergence, trendline break, higher highs/lower lows, candlesticks pattern, price action, harmonic patterns, ...) indicators.
THE SKY IS (or more likely your imagination) is the limit :)
Fear no more. The Plug&Play technology allows you to connect it and use it the backtest calculations.
This is not magic, neither is sorcery, but certainly is way beyond the most awesome thing I've ever developed on TradingView (even across all brokers I know). #bolder #statement
TradingView is the best trading platform by far and I'm very grateful to offer my indicators on their website.
To connect your external indicator to ours, we're using a native TradingView feature, which is not available for all users.
It depends on your TradingView subscription plan ( More info here )
If you intend to use our Algorithm Plug&Play indicator, and/or our Backtest Plug&Play suites, then you must upgrade your TradingView account to enjoy those features.
We value our relationship with our customers seriously, and that's why we're warning you that a compatible TradingView account type is required - at least PRO+ or PREMIUM to add more than 1 Plug&Play indicator per account.
We go in-depth on our website why the Plug&Play is an untapped opportunity for many traders out there - URL available on my profile status and signature
IV. 📊 Make it nice! 📊
Now we're getting right into the fun stuff.
Let's explore briefly each display option (symbolized by an 👁️🗨️ in the Backtest UI) :
- Color Traded Background : Color the chart background is green when in a BUY trade, in red when in a SELL trade. If the Backtest is not in a trade, then the background won't be colored.
- Show Entry/Exit Markers : Displays the entries (Enter Long/Enter Short), and exits (Exit Long/Exit Short) labels.
- Show Entry Level : Displays a blue level line to easily identify the entry price of a trade.
- Show Take Profit Level : Display a purple line to visualize where the Take Profit level is (we'll explain below how to set it up).
- Show In-Trade Stops : Display the stop-loss
V. Backtesting filters
A backtest should have some filters helping the traders testing a few hypotheses. Well.... we included a ton of them.
Once again, thank you @Pinecoders for the help and support you gave me
5.1 ↑ Trade Direction ↓
- Both: The backtest takes the BUY, and SELL trades.
- Longs only/Short only: To be used if the trader wants to take the trades in a unique direction only
5.2 ▲🔷Pyramiding🔷▼
The Backtest PRO allows 1 entry per identified trend
Pyramiding has many names such as Re-entry, secondary trend, Additional entry, ...
Basically, it refers to entering multiple times in the same trend.
Maximum Number of Pyramiding Entries: Literally the max number of re-entries in the same trend.
For instance, if set to 2, then depending on the signals, you'll get at most 2 re-entries in the same trade direction.
- Position Size Multiple of Original Entry Position: Option to add X multiples of the original position size for the re-entries.
Example: Position size multiple = 2, and First entry size is $100. Then, the re-entries position sizes will be ($100 X 2 = $200).
5.3 ▄ █ Position sizing █ ▄
- 1. % of Equity: If selected, the position size used is the input to the right of 1. % of Equity.
Example: The trader starts with a capital of 100K. After a winning trade, your total capital is $103K - for the next trade the position size will be 3% of $103K
- 2. % of Capital: If selected, the position size used is the input to the right of 2. % of Capital.
In other words, the position size will always be the same position size as calculated on the initial capital.
Example: The trader starts with a capital of 100K. After a winning trade, your total capital is $103K - for the next trade the position size will be 5% of $100K. (As 100K is the initial capital used in our dummy example)
5.4⛔ Entry Stops and In-Trade Stops ⛔
We didn't reinvent the wheel here. Any good backtest should offer an entry stop-loss and an in-trade stop-loss.
Giving only here also an example among all the use cases. For instance, the trader sets a stop-loss 2% at the time of entry on your trade, but once the trade moves in the desired direction, the trader might want a trailing stop-loss using a 4% input.
Example: A trader goes LONG on only 1 "ABC" stock evaluated $10 per share.
1) The entry-stop loss will be 2% away so set at $8
2) A candle
3) The trailing stop will activate, and move the stop-loss from the entry stop-loss level (=$8) to $8.32 (=4% move up from $8) - and so on, and so forth for each time the price moves 4% up
The entry and in-trade stop losses can absolutely be identicals. There is no universal rule, and as always you know the drill - all depends on your backtest, and trading strategy as a whole.
5.5 ❌ Hard Exits ❌
⚠️The Backtest PRO Suite offers the hard exit on MACD only.
Our Backtest PREMIUM Suite offers 2 more indicators to invalidate your trades on :
1. MACD
2. Trend Direction
3. RSI divergence (Regular, and Hidden)
The hard exit (or invalidation) is a fundamental part of my trading method.
I explained numerous times on TradingView, our website, and social media channels why I "love" this concept so much, and how it saved my trading account numerous times from getting savagely wrecked by the market.
5.6 💲💲 Take Profit 💲💲
We only included 1 level of Take Profit so far. We'll work on adding at least one more soon.
You can set your Take Profit level based on either a:
1- Fixed value
2 - Percentage value
5.7 📆 Date Range Filtering 📆
If enabled, the backtest only uses the data between the starting and the ending dates of the defined range.
5.8 ⏱️ Hourly Range Filtering ⏱️
Please note that the hours filtering is based on the broker time - not on your chart time.
In other words, if your chart is UTC+1, but you're trading an asset from a US EAST COAST broker, then the timezone used is the UTC-4 timezone.
You'll must be wary of this when filtering and probably do a quick (but simple) calculation before setting up this option.
The easiest would be to set your chart timezone on the broker local timezone (and no math is needed).
Let's add a quick note that the hourly filter is also included in our Algorithm Builders PRO/PREMIUM 12 months. #shameless #self #advertising
5.9 ❗❗ Fees and Slippage ❗❗
Too often completely ignored by many traders, the fees can eat gains out quickly/deepen one's capital faster than expected.
⚠️The fees vary between brokers, and asset traded - it could be recommended to check on your broker page what are the fees for the asset on your chart, and insert that percentage number.
Another cost ignored, even more, is the Slippage.
i.e. think about a Stop-Loss being hit, and we're so confused because we see on the chart that NEVER the price came even close to your SL level, but... it got hit anyway.
Yes! we know how frustrating it is, but that's the game we're playing, and trading should never be about blaming the game, but only blaming the players/traders/ourselves.
Blaming the game constantly is likely to not end with good performance results, but accounting for this "risk", and being able to quantify it is an incredible hedge. #bold #statement #level #10000
5.10 🔔 Alerts 🔔
By design, the alerts aren't available for strategy scripts. But this script is an... indicator so why should we not enjoy all the cards in our hands the fullest.
We enabled the alerts on the:
1. Main BUY/SELL Entry
2. Pyramiding BUY/SELL Entries
3. Exit Signals such as stop-loss, take-profit, hard-exits
You're welcome :)
VI. 📝 Where are the backtest results? 📝
Answer: in the Data Window section of your TradingView
Now the cherry on the cake if we might say so. A backtest is cool, but visualizing results is actually the end goal here.
Our PREMIUM users benefit from way more analytics than the PRO users.
More info available on our website.
The Data Window is dynamic - it means whenever you'll mouseover at a give time on your chart, the data on that panel automatically updates.
Let's assume you're backtesting your idea between Sept 1st, 2019, and Oct 1st, 2019.
If your mouse cursor is located (or hovered) at a candle on Sept 14th, 2019 (data chosen randomly for this example), then the data displayed only includes the results between Sept 1st, and Sept 14th.
More info available on our website with a nice tutorial video. Data window metrics and filters explained on our website
Here's what the data window looks like: imgur.com
If you have any doubt or question, please hit me up directly or ask in the comments section of this script.
I'll never claim I have the best trading methodology or the best indicators.
You only will judge and I'll appreciate all the questions and feedback you're sending my way.
They help me a ton to develop indicators based on all the requests I received.
Kind regards,
Dave
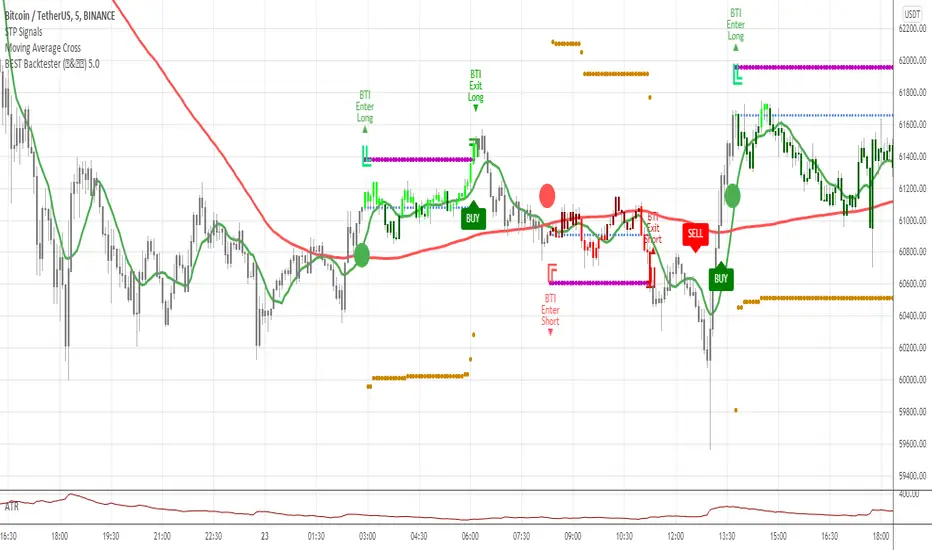
Backtest AdapterThis is a proof-of-concept Backtest Adapter that can be used with my recent publication "Machine Learning: Lorentzian Classification" located here:
This adapter is helpful because it enables interactive backtesting with TradingView's built-in "Strategy Tester" framework without the need to translate the logic from an "indicator" script to a "strategy" script.
To use this, one must have the "Machine Learning: Lorentzian Classification" script and this Backtest Adapter open simultaneously on the same chart. From there, simply change the "Source" setting of the Backtest Adapter to "Lorentzian Classification: Backtest Stream" to transfer the entry/exit signals stream to the Backtest Adapter.
For an example of how to implement your own backtest stream in your indicators, please refer to the "Backtesting" section in the source code of the "Machine Learning: Lorentzian Classification" script, which is shown below for convenience:
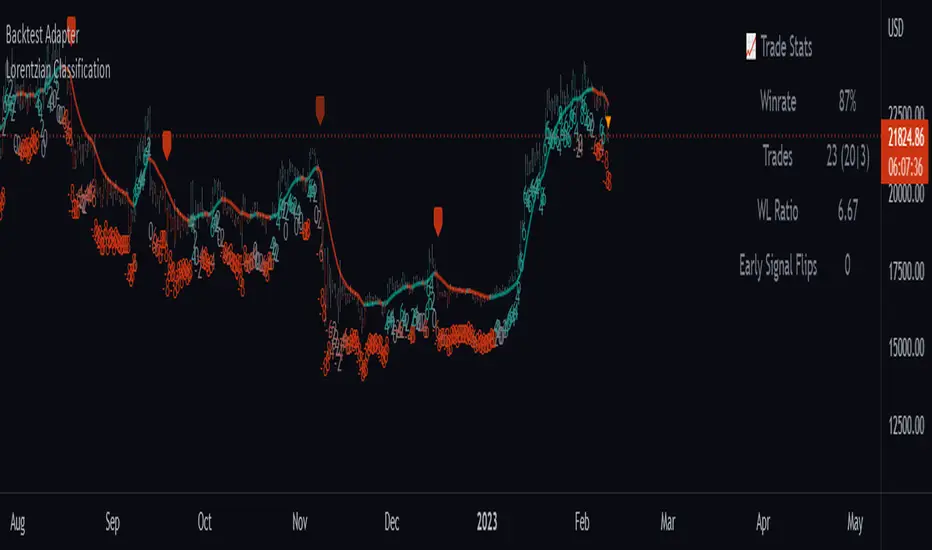
Backtesting on Non-Standard Charts: Caution! - PineCoders FAQMuch confusion exists in the TradingView community about backtesting on non-standard charts. This script tries to shed some light on the subject in the hope that traders make better use of those chart types.
Non-standard charts are:
Heikin Ashi (HA)
Renko
Kagi
Point & Figure
Range
These chart types are called non-standard because they all transform market prices into synthetic views of price action. Some focus on price movement and disregard time. Others like HA use the same division of bars into fixed time intervals but calculate artificial open, high, low and close (OHLC) values.
Non-standard chart types can provide traders with alternative ways of interpreting price action, but they are not designed to test strategies or run automated traded systems where results depend on the ability to enter and exit trades at precise price levels at specific times, whether orders are issued manually or algorithmically. Ironically, the same characteristics that make non-standard chart types interesting from an analytical point of view also make them ill-suited to trade execution. Why? Because of the dislocation that a synthetic view of price action creates between its non-standard chart prices and real market prices at any given point in time. Switching from a non-standard chart price point into the market always entails a translation of time/price dimensions that results in uncertainty—and uncertainty concerning the level or the time at which orders are executed is detrimental to all strategies.
The delta between the chart’s price when an order is issued (which is assumed to be the expected price) and the price at which that order is filled is called slippage . When working from normal chart types, slippage can be caused by one or more of the following conditions:
• Time delay between order submission and execution. During this delay the market may move normally or be subject to large orders from other traders that will cause large moves of the bid/ask levels.
• Lack of bids for a market sell or lack of asks for a market buy at the current price level.
• Spread taken by middlemen in the order execution process.
• Any other event that changes the expected fill price.
When a market order is submitted, matching engines attempt to fill at the best possible price at the exchange. TradingView strategies usually fill market orders at the opening price of the next candle. A non-standard chart type can produce misleading results because the open of the next candle may or may not correspond to the real market price at that time. This creates artificial and often beneficial slippage that would not exist on standard charts.
Consider an HA chart. The open for each candle is the average of the previous HA bar’s open and close prices. The open of the HA candle is a synthetic value, but the real market open at the time the new HA candle begins on the chart is the unrelated, regular open at the chart interval. The HA open will often be lower on long entries and higher on short entries, resulting in unrealistically advantageous fills.
Another example is a Renko chart. A Renko chart is a type of chart that only measures price movement. The purpose of a Renko chart is to cluster price action into regular intervals, which consequently removes the time element. Because Trading View does not provide tick data as a price source, it relies on chart interval close values to construct Renko bricks. As a consequence, a new brick is constructed only when the interval close penetrates one or more brick thresholds. When a new brick starts on the chart, it is because the previous interval’s close was above or below the next brick threshold. The open price of the next brick will likely not represent the current price at the time this new brick begins, so correctly simulating an order is impossible.
Some traders have argued with us that backtesting and trading off HA charts and other non-standard charts is useful, and so we have written this script to show traders what happens when order fills from backtesting on non-standard charts are compared to real-world fills at market prices.
Let’s review how TV backtesting works. TV backtesting uses a broker emulator to execute orders. When an order is executed by the broker emulator on historical bars, the price used for the fill is either the close of the order’s submission bar or, more often, the open of the next. The broker emulator only has access to the chart’s prices, and so it uses those prices to fill orders. When backtesting is run on a non-standard chart type, orders are filled at non-standard prices, and so backtesting results are non-standard—i.e., as unrealistic as the prices appearing on non-standard charts. This is not a bug; where else is the broker emulator going to fetch prices than from the chart?
This script is a strategy that you can run on either standard or non-standard chart types. It is meant to help traders understand the differences between backtests run on both types of charts. For every backtest, a label at the end of the chart shows two global net profit results for the strategy:
• The net profits (in currency) calculated by TV backtesting with orders filled at the chart’s prices.
• The net profits (in currency) calculated from the same orders, but filled at market prices (fetched through security() calls from the underlying real market prices) instead of the chart’s prices.
If you run the script on a non-standard chart, the top result in the label will be the result you would normally get from the TV backtesting results window. The bottom result will show you a more realistic result because it is calculated from real market fills.
If you run the script on a normal chart type (bars, candles, hollow candles, line, area or baseline) you will see the same result for both net profit numbers since both are run on the same real market prices. You will sometimes see slight discrepancies due to occasional differences between chart prices and the corresponding information fetched through security() calls.
Features
• Results shown in the Data Window (third icon from the top right of your chart) are:
— Cumulative results
— For each order execution bar on the chart, the chart and market previous and current fills, and the trade results calculated from both chart and market fills.
• You can choose between 2 different strategies, both elementary.
• You can use HA prices for the calculations determining entry/exit conditions. You can use this to see how a strategy calculated from HA values can run on a normal chart. You will notice that such strategies will not produce the same results as the real market results generated from HA charts. This is due to the different environment backtesting is running on where for example, position sizes for entries on the same bar will be calculated differently because HA and standard chart close prices differ.
• You can choose repainting/non-repainting signals.
• You can show MAs, entry/exit markers and market fill levels.
• You can show candles built from the underlying market prices.
• You can color the background for occurrences where an order is filled at a different real market price than the chart’s price.
Notes
• On some non-standard chart types you will not obtain any results. This is sometimes due to how certain types of non-standard types work, and sometimes because the script will not emit orders if no underlying market information is detected.
• The script illustrates how those who want to use HA values to calculate conditions can do so from a standard chart. They will then be getting orders emitted on HA conditions but filled at more realistic prices because their strategy can run on a standard chart.
• On some non-standard chart types you will see market results surpass chart results. While this may seem interesting, our way of looking at it is that it points to how unreliable non-standard chart backtesting is, and why it should be avoided.
• In order not to extend an already long description, we do not discuss the particulars of executing orders on the realtime bar when using non-standard charts. Unless you understand the minute details of what’s going on in the realtime bar on a particular non-standard chart type, we recommend staying away from this.
• Some traders ask us: Why does TradingView allow backtesting on non-standard chart types if it produces unrealistic results? That’s somewhat like asking a hammer manufacturer why it makes hammers if hammers can hurt you. We believe it’s a trader’s responsibility to understand the tools he is using.
Takeaways
• Non-standard charts are not bad per se, but they can be badly used.
• TV backtesting on non-standard charts is not broken and doesn’t require fixing. Traders asking for a fix are in dire need of learning more about trading. We recommend they stop trading until they understand why.
• Stay away from—even better, report—any vendor presenting you with strategies running on non-standard charts and implying they are showing reliable results.
• If you don’t understand everything we discussed, don’t use non-standard charts at all.
• Study carefully how non-standard charts are built and the inevitable compromises used in calculating them so you can understand their limitations.
Thanks to @allanster and @mortdiggiddy for their help in editing this description.
Look first. Then leap.

Backtesting Stats (Altrady)Track and analyze your backtesting results directly on your chart.
This indicator simplifies manual backtesting by summarizing your trades in a clear, structured table. Enter your R-values (one per line) in the text area, and instantly see:
✅ Trade list – All entries displayed with color-coded wins/losses.
✅ Key stats – Total trades, win rate, and RR sum in the top row.
✅ Quick insights – Spot trends, refine your strategy, and track performance without spreadsheets.
How to Use
1️⃣ Open settings and enter R-values, one per line (e.g., 2.5, -1, 3.2) along with short comments (bad entry, counter trend, etc)
2️⃣ View the table in the top-right corner of your chart.
3️⃣ Analyze your results, adjust your strategy, and improve consistency.
Perfect for manual backtesters who want a fast, no-spreadsheet solution. 🚀

MACD, backtest 2015+ only, cut in half and doubledThis is only a slight modification to the existing "MACD Strategy" strategy plugin!
found the default MACD strategy to be lacking, although impressive for its simplicity. I added "year>2014" to the IF buy/sell conditions so it will only backtest from 2015 and beyond ** .
I also had a problem with the standard MACD trading late, per se. To that end I modified the inputs for fast/slow/signal to double. Example: my defaults are 10, 21, 10 so I put 20, 42, 20 in. This has the effect of making a 30min interval the same as 1 hour at 10,21,10. So if you want to backtest at 4hr, you would set your time interval to 2hr on the main chart. This is a handy way to make shorter time periods more useful even regardless of strategy/testing, since you can view 15min with alot less noise but a better response.
Used on BTCCNY OKcoin, with the chart set at 45 min (so really 90min in the strategy) this gave me a percent profitable of 42% and a profit factor of 1.998 on 189 trades.
Personally, I like to set the length/signals to 30,63,30. Meaning you need to triple the time, it allows for much better use of shorter time periods and the backtests are remarkably profitable. (i.e. 15min chart view = 45min on script, 30min= 1.5hr on script)
** If you want more specific time periods you need to try plugging in different bar values: replace "year" with "n" and "2014" with "5500". The bars are based on unix time I believe so you will need to play around with the number for n, with n being the numbers of bars.

[BACKTEST] CMYK-RMI-SMA◊ Introduction
This script makes use of three RMI's and SMA's, that indicate Overbought/Oversold on different Periods that correspond with Frequency’s that move the market.
◊ Origin
This is an update on █▓▒░ CMYK ♦ RMI ♦ TRIPLE ░▒▓█
◊ Usage
This script is intended for Automated Trading on the 1-5 minute chart.
◊ Features Summary
Two Part Indicator
Strategy Type Selection
Three RMI's SMA's
Trend adjustment
Pump/Dump Entry Delay
Pyramiding
Ignore first entries
Take Profit
Interval between Entries
Multiring Fix
Alert signal Seperation
◊ Community
Wanna try this script out ? need help resolving a problem ?
CMYK :: discord.gg
AUTOVIEW :: discordapp.com
TRADINGVIEW UNOFFICIAL :: discord.gg
◊ Setting up Autoview Alerts
Use the study version of this script, To set up The Alerts Autoview Picks up on.
Goto the CMYK Discord for support and Settings.
◊ Backtesting
Use the strategy version of this script for backtesting.
◊ Contact
Wanna try this script out ? need help resolving a problem ?
CMYK :: discord.gg
Happy trades!!!

Dual Timeframe SMA Ribbon Crossover Backtest// Backtesting Dual SMA Ribbon Crossover Strategy
// see f.bpcdn.co
// including time limiting
Turned this study into a backtest.
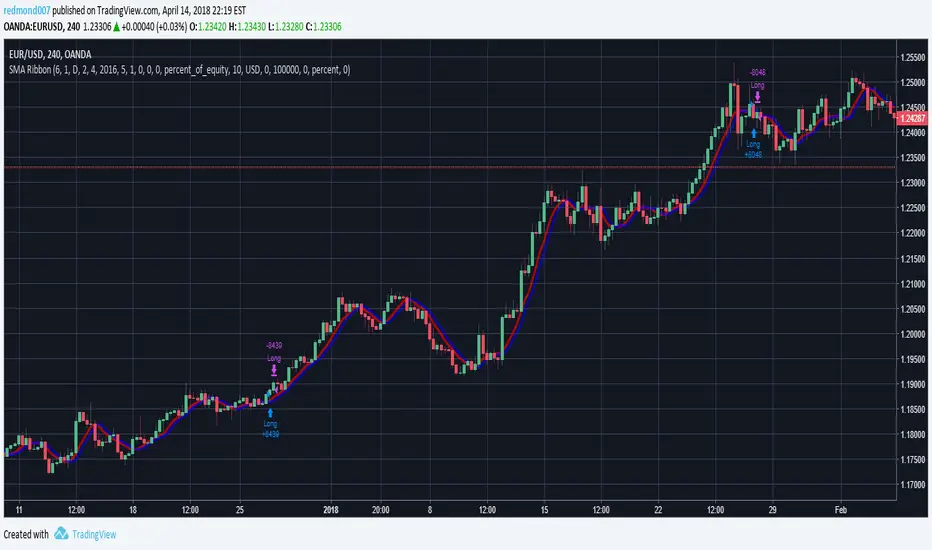
Backtesting ModuleDo you often find yourself creating new 'strategy()' scripts for each trading system? Are you unable to focus on generating new systems due to fatigue and time loss incurred in the process? Here's a potential solution: the 'Backtesting Module' :)
INTRODUCTION
Every trading system is based on four basic conditions: long entry, long exit, short entry and short exit (which are typically defined as boolean series in Pine Script).
If you can define the conditions generated by your trading system as a series of integers, it becomes possible to use these variables in different scripts in efficient ways. (Pine Script is a convenient language that allows you to use the integer output of one indicator as a source in another.)
The 'Backtesting Module' is a dynamic strategy script designed to adapt to your signals. It boasts two notable features:
⮞ It produces a backtest report using the entry and exit variables you define.
⮞ It not only serves for system testing but also to combine independent signals into a single system. (This functionality enables to create complex strategies and report on their success!)
The module tests Golden and Death cross signals by default, when you enter your own conditions the default signals will be neutralized. The methodology is described below.
PREPARATION
There are three simple steps to connect your own indicator to the Module.
STEP 1
Firstly, you must define entry and exit variables in your own script. Let's elucidate it with a straightforward example. Consider a system generating long and short signals based on the intersections of two moving averages. Consequently, our conditions would be as follows:
// Signals
long = ta.crossover(ta.sma(close, 14), ta.sma(close, 28))
short = ta.crossunder(ta.sma(close, 14), ta.sma(close, 28))
Now, the question is: How can we convert boolean variables into integer variables? The answer is conditional ternary block, defined as follows:
// Entry & Exit
long_entry = long ? 1 : 0
long_exit = short ? 1 : 0
short_entry = short ? 1 : 0
short_exit = long ? 1 : 0
The mechanics of the Entry & Exit variables are simple. The variable takes on a value of 1 when your trading system generates the signal and if your system does not produce any signal, variable returns 0. In this example, you see how exit signals can be generated in a trading system that only contains entry signals. If you have a system with original exit signals, you can also use them directly. (Please mind the NOTES section below).
STEP 2
To utilize the Entry & Exit variables as source in another script, they must be plotted on the chart. Therefore, the final detail to include in the script containing your trading system would be as follows:
// Plot The Output
plot(long_entry, "Long Entry", display=display.data_window, editable=false)
plot(long_exit, "Long Exit", display=display.data_window, editable=false)
plot(short_entry, "Short Entry", display=display.data_window, editable=false)
plot(short_exit, "Short Exit", display=display.data_window, editable=false)
STEP 3
Now, we are ready to test the system! Load the Backtesting Module indicator onto the chart along with your trading system/indicator. Then set the outputs of your system (Long Entry, Long Exit, Short Entry, Short Exit) as source in the module. That's it.
FEATURES & ORIGINALITY
⮞ Primarily, this script has been created to provide you with an easy and practical method when testing your trading system.
⮞ I thought it might be nice to visualize a few useful results. The Backtesting Module provides insights into the outcomes of both long and short trades by computing the number of trades and the success percentage.
⮞ Through the 'Trade' parameter, users can specify the market direction in which the indicator is permitted to initiate positions.
⮞ Users have the flexibility to define the date range for the test.
⮞ There are optional features allowing users to plot entry prices on the chart and customize bar colors.
⮞ The report and the test date range are presented in a table on the chart screen. The entry price can be monitored in the data window.
⮞ Note that results are based on realized returns, and the open trade is not included in the displayed results. (The only exception is the 'Unrealized PNL' result in the table.)
STRATEGY SETTINGS
The default parameters are as follows:
⮞ Initial Balance : 10000 (in units of currency)
⮞ Quantity : 10% of equity
⮞ Commission : 0.04%
⮞ Slippage : 0
⮞ Dataset : All bars in the chart
For a realistic backtest result, you should size trades to only risk sustainable amounts of equity. Do not risk more than 5-10% on a trade. And ALWAYS configure your commission and slippage parameters according to pessimistic scenarios!
NOTES
⮞ This script is intended solely for development purposes. And it'll will be available for all the indicators I publish.
⮞ In this version of the module, all order types are designed as market orders. The exit size is the sum of the entry size.
⮞ As your trading conditions grow more intricate, you might need to define the outputs of your system in alternative ways. The method outlined in this description is tailored for straightforward signal structures.
⮞ Additionally, depending on the structure of your trading system, the backtest module may require further development. This encompasses stop-loss, take-profit, specific exit orders, quantity, margin and risk management calculations. I am considering releasing improvements that consider these options in future versions.
⮞ An example of how complex trading signals can be generated is the OTT Collection. If you're interested in seeing how the signals are constructed, you can use the link below.
THANKS
Special thanks to PineCoders for their valuable moderation efforts.
I hope this will be a useful example for the TradingView community...
DISCLAIMER
This is just an indicator, nothing more. It is provided for informational and educational purposes exclusively. The utilization of this script does not constitute professional or financial advice. The user solely bears the responsibility for risks associated with script usage. Do not forget to manage your risk. And trade as safely as possible. Best of luck!
