"bands"に関するスクリプトを検索


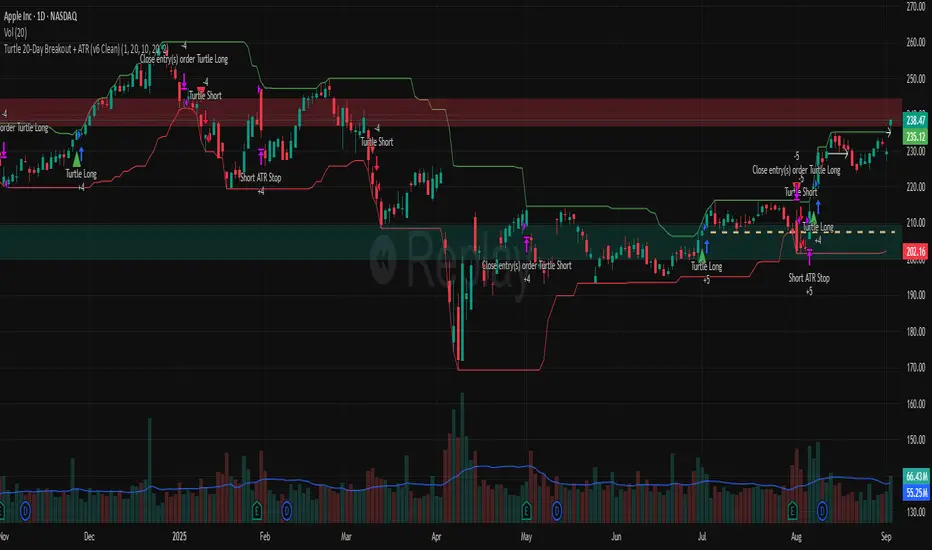
Turtle 20-Day Breakout + ATR (v6 Clean)20-bar breakout entries
ATR protective stops
Classic 10-bar opposite breakout exits
Proper plotting of breakout levels and stops
Signals on chart
Alert conditions in global scop
MA20 Crossover Strategy with Threshold and Color ChangeMột chiến lược cơ bản dựa trên EMA20. Giá cắt lên MA20 hay EMA20 thi báo mua và ngược lại

Range FinderRange Finder Strategy for TradingView
Overview
The Range Finder Strategy is a sophisticated trading system designed for forex and cryptocurrency markets, leveraging dynamic range detection, wick-based rejection patterns, and EMA confluence to execute high-probability trades. This strategy identifies key price ranges using pivot points and triggers trades when price rejects from these boundaries with significant wick formations, aligning with the broader market trend as confirmed by EMA crossovers. It incorporates robust risk management, customizable parameters, and visual aids for clear trade visualization, making it suitable for both manual and automated trading on platforms like Bitget via webhook alerts.
Strategy Components
1. Dynamic Range Detection
Pivot Points: The strategy identifies range boundaries using pivot highs and lows, calculated with a user-defined Pivot Length (default: 5 bars left/right). These pivots mark significant swing points, defining the upper (range high) and lower (range low) boundaries of the price range.
Visualization: The range high is plotted as an orange line, and the range low as a purple line, using a broken line style (plot.style_linebr) to show only confirmed pivot levels, providing a clear visual of the trading range.
2. Wick-Based Rejection Pattern
Wick Detection: The strategy looks for rejection candles at the range boundaries, characterized by significant wicks. A wick is considered valid if its size is at least the user-defined Wick to Body Ratio (default: 1.1, or 10% larger than the candle body).
Sell Signal: Triggered when the high exceeds the range high, the candle closes bearish (close < open), and the upper wick meets the ratio requirement.
Buy Signal: Triggered when the low falls below the range low, the candle closes bullish (close > open), and the lower wick meets the ratio requirement.
Purpose: These wicks indicate strong rejection at key levels, often signaling a reversal back into the range, providing high-probability entry points.
3. EMA Trend Confirmation
EMA Calculation: Uses two Exponential Moving Averages (EMAs) calculated on a user-selectable timeframe (default: 5-minute):
EMA 200: Long-term trend indicator (plotted in red).
EMA 50: Short-term trend indicator (plotted in green).
Crossover Logic:
A bullish trend is confirmed when the EMA 50 crosses above the EMA 200 (ema_trend_up = true).
A bearish trend is confirmed when the EMA 50 crosses below the EMA 200 (ema_trend_down = true).
Confluence Requirement: Trades are only executed when the wick rejection aligns with the EMA trend (e.g., sell signals require close < ema200 and bearish trend; buy signals require close > ema200 and bullish trend).
4. Risk Management
Position Sizing: Calculated based on the user-defined Account Balance (default: $10,000) and Risk Per Trade (default: 2%). The position size is determined as risk_amount / stop_distance, where stop_distance is derived from the Average True Range (ATR, default period: 14).
Stop Loss (SL): Set using an ATR-based multiplier (SL Multiplier, default: 9.0). For sells, SL is placed above the high; for buys, below the low.
Take Profit (TP): Set using an ATR-based multiplier (TP Multiplier, default: 6.0) scaled by the Risk:Reward Ratio (default: 6.0), ensuring a favorable reward-to-risk profile.
Example: For a $10,000 account with 2% risk, if ATR is 0.5, the position size is 400 units, with SL and TP dynamically adjusted to market volatility.
5. Trade Execution
Sell Entry: Triggered on a wick rejection above the range high, with bearish EMA confluence (ema_trend_down and close < ema200). Enters a short position with calculated SL and TP.
Buy Entry: Triggered on a wick rejection below the range low, with bullish EMA confluence (ema_trend_up and close > ema200). Enters a long position with calculated SL and TP.
Exit Logic: Uses strategy.exit to set SL and TP levels, closing trades when either is hit.
6. Visual Feedback
Lines and Labels: Upon trade entry, the strategy plots:
Red SL line and label (e.g., "SL: 123.45").
Green TP line and label (e.g., "TP: 120.00").
Entry line (red for sell, green for buy) labeled with "Sell (Range Rejection)" or "Buy (Range Rejection)".
Customization: Users can adjust the Line Length (default: 25 bars) for how long lines persist and Label Position (left or right) for optimal chart visibility.
7. Alert Conditions
Webhook Integration: Generates alerts for Bitget webhook integration, providing JSON-formatted messages with trade details (action, contracts, market position, size, price, symbol, and timestamp).
Usage: Traders can set up automated trading by connecting these alerts to trading bots or platforms supporting webhooks.

Keltner Alım Stratejisi v6 (10, 0.5)sadece keltner kanal girdilerinin değiştirilmesiyle oluşturulmuş bir göstergedir

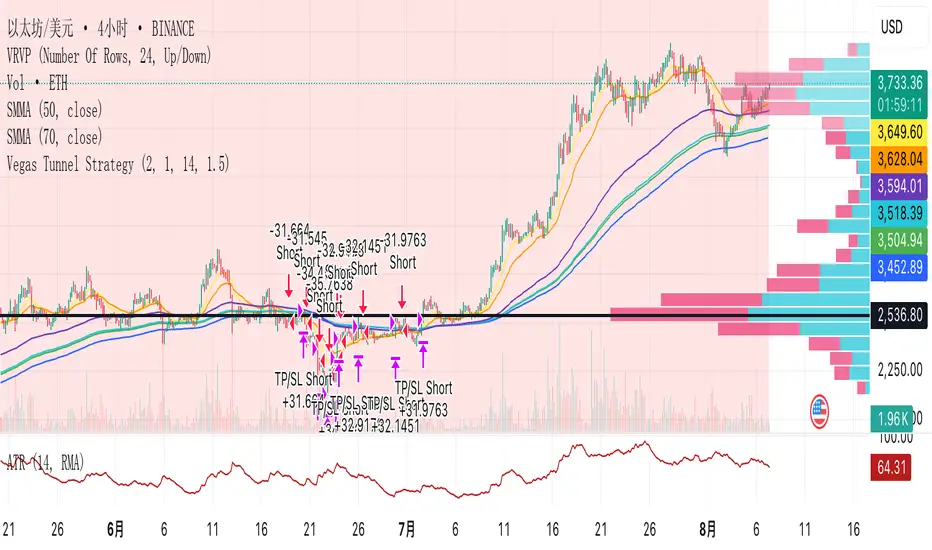
Vegas Tunnel StrategyVegas Tunnel Strategy is a trend-following breakout system based on exponential moving averages (EMAs). It uses a "tunnel" formed by the 144 EMA and 169 EMA to identify the market's long-term trend direction. Entry signals are generated when a shorter-term EMA (12 EMA) breaks above or below this tunnel, confirming momentum alignment.
Long Setup: Price and EMA12 are above the tunnel (EMA144 < EMA169); entry on pullback near the tunnel.
Short Setup: Price and EMA12 are below the tunnel (EMA144 > EMA169); entry on rebound near the tunnel.
Exit Rules: Fixed stop loss below/above the tunnel or based on ATR; take profit at 1.5–2× the risk.
This strategy works best on 4H or daily charts and is suitable for trending assets like FX pairs, gold, oil, or indices.
Setup: Smooth Gaussian + Adaptive Supertrend (Manual Vol)Overview
This strategy combines two powerful trend-based tools originally developed by Algo Alpha: the Smooth Gaussian Trend (simulated) and the Adaptive Supertrend. The objective is to capture sustained bullish movements in periods of controlled volatility by filtering for high-probability entries.
Entry Logic
Long Entry Conditions:
The closing price is above the Smooth Gaussian Trend line (with length = 75), and
The volatility setting from the Adaptive Supertrend is manually defined as either 2 or 3
Exit Condition:
The closing price falls below the Smooth Gaussian Trend line
This script uses a simulated version of the Gaussian Trend line via double-smoothed SMA, as the original Algo Alpha indicator is protected and cannot be accessed directly in code.
Features
Plots entry and exit signals directly on the chart
Manual toggle to enable or disable the volatility filter
Lightweight design to allow flexible backtesting even without access to proprietary indicators
Important Note
This strategy does not connect to the actual Adaptive Supertrend from Algo Alpha. Users must manually input the volatility level based on what they observe on the chart when the original indicator is also applied. The Smooth Gaussian Trend is approximated and may differ slightly from the original.
Suggested Use
Recommended timeframes: 1H, 4H, or Daily
Best used alongside the original indicators displayed on the chart
Consider incorporating additional structure, momentum, or volume filters to enhance performance
If you have suggestions or would like to contribute improvements, feel free to reach out or fork the script.

Bollinger + EMA Strategy with StatsThis strategy is a mean-reversion trading model that combines Bollinger Band deviation entries with EMA-based exits. It enters a long position when the price drops significantly below the lower Bollinger Band by a user-defined multiple of standard deviation (x), and a short position when the price exceeds the upper band by the same logic. To manage risk, it uses a wider Bollinger Band threshold (y standard deviations) as a stop loss, while take profit occurs when the price reverts to the n-period EMA, indicating mean reversion. The strategy maintains only one active position at a time—either long or short—and allocates a fixed percentage of capital per trade. Performance metrics such as equity curve, drawdown, win rate, and total trades are tracked and displayed for backtesting evaluation.

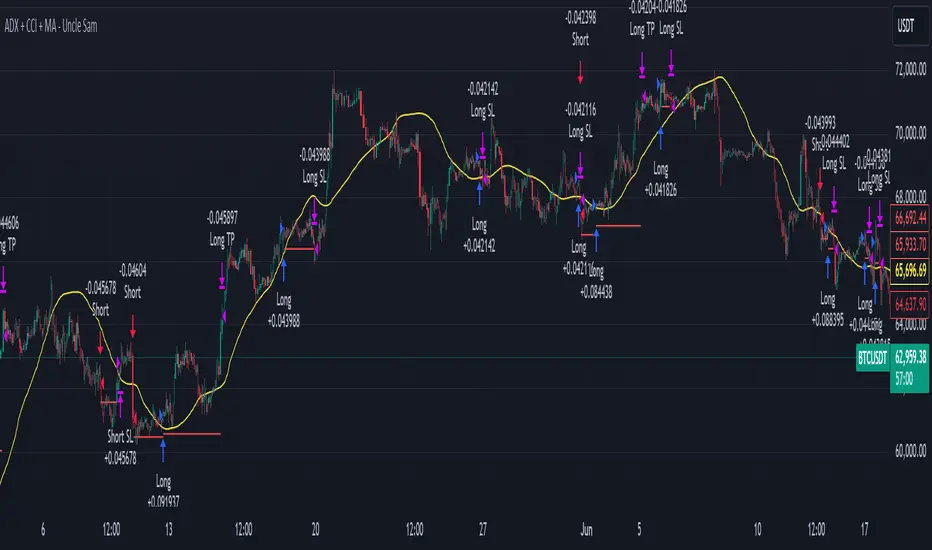
ADX + CCI + MA - Uncle SamStrategy Name: ADX + CCI + MA - Uncle Sam
Overview
This strategy aims to capitalize on trending markets by combining the Average Directional Index (ADX), Commodity Channel Index (CCI), and a customizable Moving Average (MA). It's designed for traders seeking a balanced approach to both long (buy) and short (sell) opportunities. Special thanks to the creators of the ADX and CCI indicators for their invaluable contributions to technical analysis.
Strategy Concept
The core idea is to identify strong trends with the ADX, confirm potential entry points with the CCI, and use the MA to filter trades in the direction of the broader trend. This approach seeks to avoid entering positions during periods of consolidation or when the trend is weak.
Indicator Logic
ADX (Average Directional Index): The ADX measures the strength of a trend, regardless of its direction. A value above the customizable adx_threshold (default 20) signals a strong trend, making it a prime environment for this strategy.
CCI (Commodity Channel Index): The CCI is a momentum oscillator that helps identify overbought (above 100) and oversold (below -100) conditions. We use CCI crossovers to time entries in the direction of the prevailing trend.
MA (Moving Average): The MA acts as a trend filter, ensuring we only enter trades aligned with the overall market direction. You have flexibility in choosing the MA type (SMA, EMA, etc.) and its length to suit your trading style and timeframe.
Entry Conditions
Long (Buy):
ADX is above the adx_threshold.
CCI crosses above 100.
Price is above the chosen Moving Average (if MA trend filtering is enabled).
Short (Sell):
ADX is above the adx_threshold.
CCI crosses below -100.
Price is below the chosen Moving Average (if MA trend filtering is enabled).
Exit Conditions
Stop Loss (SL): Each position has a customizable stop-loss percentage to manage risk. The default setting is 1%.
Take Profit (TP): Each position has a customizable take-profit percentage to secure gains. The default setting is 5%.
MA-Based Risk Management (Optional): This feature allows for early exits if the price closes against the MA trend for a specified number of candles. The default setting is 2 candles.
Default Settings
CCI Period: 15
ADX Length: 10
ADX Threshold: 20
MA Type: HMA
MA Length: 200
MA Source: Close
Commission Fee: $0.0
A commission fee is not added, add your trading/platform commission for realistic trading costs.
Backtest Results
The strategy has been backtested on with the default settings and a starting capital of $1000, with 0.0% commission fee. It shows promising results.
Disclaimer: Backtesting is hypothetical and does not guarantee future performance.
Important Considerations:
Customization: The strategy offers extensive customization to tailor it to your preferences. Experiment with different parameters and settings to find what works best for your trading style.
Risk Management: Always use proper risk management techniques, including position sizing and stop losses, to protect your capital.
Turtle Trading Strategy@lihexieThe full implementation of the Turtle Trading Rules (as distinct from the various truncated versions circulating within the community) is now ready.
This trading strategy script distinguishes itself from all currently publicly available Turtle trading systems on Tradingview by comprehensively embodying the rules for entries, exits, position management, and profit and loss controls.
Market Selection:
Trade in highly liquid markets such as forex, commodity futures, and stock index futures.
Entry Strategies:
Model 1: Buy when the price breaks above the highest point of the last 20 trading days; Sell when the price drops below the lowest point of the last 20 trading days. When an entry opportunity arises, if the previous trade was profitable, skip the current breakout opportunity and refrain from entering.
Model 2: Buy when the price breaks above the highest point of the last 55 trading days; Sell when the price drops below the lowest point of the last 55 trading days.
Position Sizing:
Determine the size of each position based on the price volatility (ATR) to ensure that the risk of each trade does not exceed 2% of the account balance.
Exit Strategies:
1. Use a fixed stop-loss point to limit losses: Close long positions when the price falls below the lowest point of the last 10 trading days.
2. Trailing stop-loss: Once a position is profitable, adjust the stop-loss point to protect profits.
Pyramiding Rules:
Unit Doubling: Increase position size by one unit every time the price moves forward by n (default is 0.5) units of ATR, up to a maximum of 4 units, while also raising the stop-loss point to below the ATR value at the level of additional entries.
海龟交易法则的完整实现(区别于当前社区各种有阉割海龟交易系统代码)
本策略脚本区别于Tradingview目前公开的所有的海龟交易系统,完整的实现了海龟交易法则中入场、出场、仓位管理,止盈止损的规则。
市场选择:
选择流动性高的市场进行交易,如外汇、商品期货和股指期货等。
入市策略:
模式1:当价格突破过去20个交易日的高点时,买入;当价格跌破过去20个交易日的低点时,卖出。当出现入场机会时,如果上一笔交易是盈利的,那么跳过当前突破的机会,不进行入场。
模式2:当价格突破过去55个交易日的高点时,买入;当价格跌破过去55个交易日的低点时,卖出。
头寸规模:
根据价格波动性(ATR)来确定每个头寸的大小, 使每笔交易的风险不超过账户余额的2%。
退出策略:
1. 使用一个固定的止损点来限制损失:当多头头寸的价格跌破过去10个交易日的低点时,平仓止损。
2. 跟踪止损:一旦头寸盈利,移动止损点以保护利润。
加仓规则:
单位加倍:每当价格向前n(默认是0.5)个单位的ATR移动时,就增加一个单位的头寸大小(默认最大头寸数量是4个),同时将止损点提升至加仓点位的ATR值以下。


MCL-YG Pair Trading StrategyThis strategy uses Bollinger Band breakouts to detect buy and sell signals on a correlated pair of assets.

NSRDMKVICthis is a test indicator that evaluate the market and entry and exit positions gain fortune

Donchian Breakout no repaintdonchian breakout strategy which i revise the script for no repaint signal
HURST Channel StrategyBased on the work TJS / Trading Zoom / Svoboda
Strategy based on Hurst channel with loss averaging when an open position is below 0.5 channel range.
How it works:
1. opens the long position when the close price crosses over the lower band (from bottom to top)
2. opens additional position (double in size) when average position price is lower than average channel value (0.5)
3. closes the position when the close price crosses over the higher band (from top to bottom)
Works the best on :
- volatile and continuous instruments (futures)
- on timeframes above 15 minutes
- uptrends or consolidations
- downtrends require more capital to open double positions

Hilly's 0010110 Reversal Scalping Strategy - 5 Min CandlesKey Features and Rationale:
Timeframe: Restricted to 5-minute candles as requested.
Pattern Integration: Includes single (Hammer, Shooting Star, Doji), two (Engulfing, Harami), and three-plus (Morning Star, Evening Star) candlestick patterns, plus reversal patterns based on RSI extremes.
VWAP Cross: Incorporates bullish (price crosses above VWAP) and bearish (price crosses below VWAP) signals, enhanced by trend context.
Volume Analysis: Uses a volume spike threshold to filter noise, with a simple day-start volume comparison for financial environment context.
Financial Environment: Approximates the day's sentiment using early-hour volume compared to current volume, adjusted by trend.
Aggregation: Scores each condition (e.g., 1 for basic patterns, 2 for strong patterns like Engulfing, 3 for three-candle patterns) and decides based on weighted consensus, with trendStrength as a tunable threshold.
Risky Approach: Minimal filtering and a low trendStrength (default 0.5) allow frequent signals, aligning with your $100-to-$200 goal, but expect higher risk.
Suggested Inputs:
EMA Length: 10 (short enough for 5-minute sensitivity).
VWAP Lookback: 1 (uses current session VWAP).
Volume Threshold Multiplier: 1.2 (moderate spike requirement).
RSI Length: 14 (standard, adjustable to 7 for more sensitivity).
Trend Strength Threshold: 0.5 (balance between signals; lower to 0.4 for more trades, raise to 0.6 for fewer).

Clear Signal Trading Strategy V5Clear Signal Trading Strategy - Description
This strategy uses a simple 0-5 point scoring system to identify high-probability trades. It combines trend following with momentum confirmation to generate clear BUY/SELL signals while filtering out market noise.
How it works: The strategy waits for EMA crossovers, then scores the setup based on trend alignment, momentum, RSI position, and volume. Only trades scoring above your chosen threshold are executed.
Recommended Settings by Market Type
For Beginners / Risk-Averse Traders:
Signal Sensitivity: Conservative
Volume Confirmation: ON
Risk Per Trade: 1-2%
Stop Loss Type: ATR
ATR Multiplier: 2.5
Risk:Reward Ratio: 2.0
For Trending Markets (Strong Directional Movement):
Signal Sensitivity: Balanced
Volume Confirmation: ON
Risk Per Trade: 2%
Stop Loss Type: ATR
ATR Multiplier: 2.0
Risk:Reward Ratio: 2.5-3.0
For Ranging/Choppy Markets:
Signal Sensitivity: Conservative
Volume Confirmation: ON
Risk Per Trade: 1%
Stop Loss Type: Percentage
Percentage Stop: 2%
Risk:Reward Ratio: 1.5
For Volatile Markets (Crypto/High Beta Stocks):
Signal Sensitivity: Conservative
Volume Confirmation: ON
Risk Per Trade: 1%
Stop Loss Type: ATR
ATR Multiplier: 3.0
Risk:Reward Ratio: 2.0
Best Practices
Timeframes:
15-minute to 1-hour for day trading
4-hour to daily for swing trading
Works best on liquid instruments with good volume
When to avoid trading:
When dashboard shows "HIGH" volatility above 4%
During major news events
When win rate drops below 40%
In markets with no clear trend (prolonged NEUTRAL state)
Success tips:
Start with Conservative mode until you see 10+ successful trades
Only increase to Balanced mode when win rate exceeds 55%
Never use Aggressive mode unless market shows strong trend for 5+ days
Always honor the stop loss - no exceptions
Take partial profits at first target if unsure

