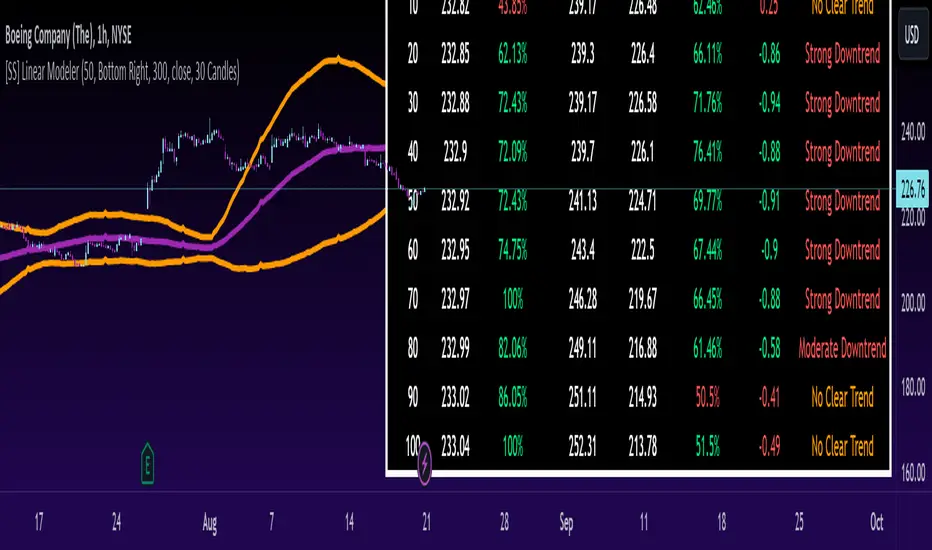
[SS] Linear ModelerHello everyone,
This is the linear modeler indicator.
It is a statistical based indicator that provides a likely price target and range based on a linear regression time series analysis.
To represent it visually, all the indicator does is it represents a linear regression channel and actually plots out the range at various points based on the current trend (see the chart below):
The indicator will perform the same assessment, but give you a working range and timeline for targets.
As well, the indicator will back-test the range and variables to see how it is performing and how reliable the results are likely to be.
General Functions:
In the chart above you can see all the various parameters and functions.
The indicator will display the most likely target (MLT) to be expected within the next pre-determined timeframe (by candles).
So for the first target, the indicator is saying within the next 10 candles, BA's MLT is 221.46 and based on BT results the reliability of this assessment is around 46%.
The indicator will also display the anticipated range at each designated timeframe.
In the chart above, we can see that at 20 candles, the likely range that BA should be trading in is 204 and 238 with a reliability of around 62% based on previous performance.
Plot Functions:
As this is performing a linear time series projection, you can have the indicator plot the projected ranges. Simply go to the settings menu and select the desired forecast length:
This will plot out the desired range and result over the specified time period. Here is an example of BA plotted over the next 50 candles on the hourly:
You can technically use this as an SMA/EMA type indicator, just keep in mind it may be a bit slower than a traditional EMA and SMA indicator, as it is processing a lot of data and plotting out forecasted data as opposed to an SMA or EMA.
If you wish to use it as an EMA or SMA, you can unselect the "Display Chart" Function to hide the table, and you can also select the "Plot Label" function. This will display the current projection analytics directly on your plotted line so you don't need to reference the table at all:
Tips on use:
I use this on the larger and smaller timeframes. On all timeframes, I will look to targets that display 90% to 100% in the BT results.
Bear in mind, this does not mean that we will 100% of the time hit this target, these targets can fail, it just means that there is a higher confidence of hitting this target than other, less reliable targets.
I will plot these targets out if they fall within the implied range of the timeframe I am looking at and will act on them according to the price action.
This is a great indicator to use in combination with other range based indicators. If you use the implied range from options to help guide your trading, you can see which targets are likely to be hit based on the current trend that fall within that implied range.
You can also assess the strength of the trends at various points in time and have an actionable range with a reliability reading at various points in time.
That is pretty much the bulk of the indicator.
Hopefully you find it helpful and useful.
As always, leave your questions and suggestions below.
Thanks for reading and checking it out!
"implied"に関するスクリプトを検索
Bull / Bear Market RegimeBull / Bear Market Regime
Instructions:
- A simple risk on or risk off indicator based on CBOE's Implied Correlation and VIX to highlight and indicate Bull / Bear Markets. To be used with the S&P500 index as that's the source from where the CBOE calculates and measures implied volatility & implied correlation. Can also be used with the other indices such as: Dow Jones, S&P 500, Nasdaq, & Nasdaq100, & Index ETF's such as DIA, SPY, QQQ, etc.
- Know the active regime, see the larger picture using the Daily or Weekly view, and visualize the current "Risk On (Bull) or Risk Off (Bear)" environment.
Description:
- Risk On and Risk Off simplified & visualized. Know if we are in a RISK ON or RISK OFF environment (Bull or Bear Market). (Absolute bottoms and tops will occur BEFORE a Risk On (Bull Market) or Risk Off (Bear Market) environment is confirmed!) This indicator is not meant to bottom tick or uptick market price action, but to show the active regime.
- Green: Bull Market, Risk On, low volatility, and low risk.
- Red: Bear Market, Risk Off, high volatility, and higher risk.
Buy & Sell Indicators (DAILY time frame)
- Nothing is 100% guaranteed! Can be used for short to medium term trades at the users discretion in BEAR MARKETS!!
- These signals are meant to be used during a RISK OFF / BEAR MARKET environment that tends to be accompanied with high volatility. A Risk on / Bull Market environment tends to have low volatility and endless rallies, so the signals will differ and in most instances not apply for Bull market / Risk on regime.
- The SELL signal will more often than not signal that a pullback is near in a BULL market and that a BMR-Bear Market Rally is almost over in a BEAR market.
- The BUY signal will have far more accuracy in a BEAR market-high volatility environment and can Identify short-term and major bottoms.
Always use proper sizing and risk management!

ICT Concepts [LuxAlgo]The ICT Concepts indicator regroups core concepts highlighted by trader and educator "The Inner Circle Trader" (ICT) into an all-in-one toolkit. Features include Market Structure (MSS & BOS), Order Blocks, Imbalances, Buyside/Sellside Liquidity, Displacements, ICT Killzones, and New Week/Day Opening Gaps.
🔶 SETTINGS
🔹 Mode
When Present is selected, only data of the latest 500 bars are used/visualized, except for NWOG/NDOG
🔹 Market Structure
Enable/disable Market Structure.
Length: will set the lookback period/sensitivity.
In Present Mode only the latest Market Structure trend will be shown, while in Historical Mode, previous trends will be shown as well:
You can toggle MSS/BOS separately and change the colors:
🔹 Displacement
Enable/disable Displacement.
🔹 Volume Imbalance
Enable/disable Volume Imbalance.
# Visible VI's: sets the amount of visible Volume Imbalances (max 100), color setting is placed at the side.
🔹 Order Blocks
Enable/disable Order Blocks.
Swing Lookback: Lookback period used for the detection of the swing points used to create order blocks.
Show Last Bullish OB: Number of the most recent bullish order/breaker blocks to display on the chart.
Show Last Bearish OB: Number of the most recent bearish order/breaker blocks to display on the chart.
Color settings.
Show Historical Polarity Changes: Allows users to see labels indicating where a swing high/low previously occurred within a breaker block.
Use Candle Body: Allows users to use candle bodies as order block areas instead of the full candle range.
Change in Order Blocks style:
🔹 Liquidity
Enable/disable Liquidity.
Margin: sets the sensitivity, 2 points are fairly equal when:
'point 1' < 'point 2' + (10 bar Average True Range / (10 / margin)) and
'point 1' > 'point 2' - (10 bar Average True Range / (10 / margin))
# Visible Liq. boxes: sets the amount of visible Liquidity boxes (max 50), this amount is for Sellside and Buyside boxes separately.
Colour settings.
Change in Liquidity style:
🔹 Fair Value Gaps
Enable/disable FVG's.
Balance Price Range: this is the overlap of latest bullish and bearish Fair Value Gaps.
By disabling Balance Price Range only FVGs will be shown.
Options: Choose whether you wish to see FVG or Implied Fair Value Gaps (this will impact Balance Price Range as well)
# Visible FVG's: sets the amount of visible FVG's (max 20, in the same direction).
Color settings.
Change in FVG style:
🔹 NWOG/NDOG
Enable/disable NWOG; color settings; amount of NWOG shown (max 50).
Enable/disable NDOG ; color settings; amount of NDOG shown (max 50).
🔹 Fibonacci
This tool connects the 2 most recent bullish/bearish (if applicable) features of your choice, provided they are enabled.
3 examples (FVG, BPR, OB):
Extend lines -> Enabled (example OB):
🔹 Killzones
Enable/disable all or the ones you need.
Time settings are coded in the corresponding time zones.
🔶 USAGE
By default, the indicator displays each feature relevant to the most recent price variations in order to avoid clutter on the chart & to provide a very similar experience to how a user would contruct ICT Concepts by hand.
Users can use the historical mode in the settings to see historical market structure/imbalances. The ICT Concepts indicator has various use cases, below we outline many examples of how a trader could find usage of the features together.
In the above image we can see price took out Sellside liquidity, filled two bearish FVGs, a market structure shift, which then led to a clean retest of a bullish FVG as a clean setup to target the order block above.
Price then fills the OB which creates a breaker level as seen in yellow.
Broken OBs can be useful for a trader using the ICT Concepts indicator as it marks a level where orders have now been filled, indicating a solidified level that has proved itself as an area of liquidity. In the image above we can see a trade setup using a broken bearish OB as a potential entry level.
We can see the New Week Opening Gap (NWOG) above was an optimal level to target considering price may tend to fill / react off of these levels according to ICT.
In the next image above, we have another example of various use cases where the ICT Concepts indicator hypothetically allow traders to find key levels & find optimal entry points using market structure.
In the image above we can see a bearish Market Structure Shift (MSS) is confirmed, indicating a potential trade setup for targeting the Balanced Price Range imbalance (BPR) below with a stop loss above the buyside liquidity.
Although what we are demonstrating here is a hindsight example, it shows the potential usage this toolkit gives you for creating trading plans based on ICT Concepts.
Same chart but playing out the history further we can see directly after price came down to the Sellside liquidity & swept below it...
Then by enabling IFVGs in the settings, we can see the IFVG retests alongside the Sellside & Buyside liquidity acting in confluence.
Which allows us to see a great bullish structure in the market with various key levels for potential entries.
Here we can see a potential bullish setup as price has taken out a previous Sellside liquidity zone and is now retesting a NWOG + Volume Imbalance.
Users also have the option to display Fibonacci retracements based on market structure, order blocks, and imbalance areas, which can help place limit/stop orders more effectively as well as finding optimal points of interest beyond what the primary ICT Concepts features can generate for a trader.
In the above image we can see the Fibonacci extension was selected to be based on the NWOG giving us some upside levels above the buyside liquidity.
🔶 DETAILS
Each feature within the ICT Concepts indicator is described in the sub sections below.
🔹 Market Structure
Market structure labels are constructed from price breaking a prior swing point. This allows a user to determine the current market trend based on the price action.
There are two types of Market Structure labels included:
Market Structure Shift (MSS)
Break Of Structure (BOS)
A MSS occurs when price breaks a swing low in an uptrend or a swing high in a downtrend, highlighting a potential reversal. This is often labeled as "CHoCH", but ICT specifies it as MSS.
On the other hand, BOS labels occur when price breaks a swing high in an uptrend or a swing low in a downtrend. The occurrence of these particular swing points is caused by retracements (inducements) that highlights liquidity hunting in lower timeframes.
🔹 Order Blocks
More significant market participants (institutions) with the ability of placing large orders in the market will generally place a sequence of individual trades spread out in time. This is referred as executing what is called a "meta-order".
Order blocks highlight the area where potential meta-orders are executed. Bullish order blocks are located near local bottoms in an uptrend while bearish order blocks are located near local tops in a downtrend.
When price mitigates (breaks out) an order block, a breaker block is confirmed. We can eventually expect price to trade back to this breaker block offering a new trade opportunity.
🔹 Buyside & Sellside Liquidity
Buyside / Sellside liquidity levels highlight price levels where market participants might place limit/stop orders.
Buyside liquidity levels will regroup the stoploss orders of short traders as well as limit orders of long traders, while Sellside liquidity levels will regroup the stoploss orders of long traders as well as limit orders of short traders.
These levels can play different roles. More informed market participants might view these levels as source of liquidity, and once liquidity over a specific level is reduced it will be found in another area.
🔹 Imbalances
Imbalances highlight disparities between the bid/ask, these can also be defined as inefficiencies, which would suggest that not all available information is reflected by the price and would as such provide potential trading opportunities.
It is common for price to "rebalance" and seek to come back to a previous imbalance area.
ICT highlights multiple imbalance formations:
Fair Value Gaps: A three candle formation where the candle shadows adjacent to the central candle do not overlap, this highlights a gap area.
Implied Fair Value Gaps: Unlike the fair value gap the implied fair value gap has candle shadows adjacent to the central candle overlapping. The gap area is constructed from the average between the respective shadow and the nearest extremity of their candle body.
Balanced Price Range: Balanced price ranges occur when a fair value gap overlaps a previous fair value gap, with the overlapping area resulting in the imbalance area.
Volume Imbalance: Volume imbalances highlight gaps between the opening price and closing price with existing trading activity (the low/high overlap the previous high/low).
Opening Gap: Unlike volume imbalances opening gaps highlight areas with no trading activity. The low/high does not reach previous high/low, highlighting a "void" area.
🔹 Displacement
Displacements are scenarios where price forms successive candles of the same sentiment (bullish/bearish) with large bodies and short shadows.
These can more technically be identified by positive auto correlation (a close to open change is more likely to be followed by a change of the same sign) as well as volatility clustering (large changes are followed by large changes).
Displacements can be the cause for the formation of imbalances as well as market structure, these can be caused by the full execution of a meta order.
🔹 Kill Zones
Killzones represent different time intervals that aims at offering optimal trade entries. Killzones include:
- New York Killzone (7:9 ET)
- London Open Killzone (2:5 ET)
- London Close Killzone (10:12 ET)
- Asian Killzone (20:00 ET)
🔶 Conclusion & Supplementary Material
This script aims to emulate how a trader would draw each of the covered features on their chart in the most precise representation to how it's actually taught by ICT directly.
There are many parallels between ICT Concepts and Smart Money Concepts that we released in 2022 which has a more general & simpler usage:
ICT Concepts, however, is more specifically aligned toward the community's interpretation of how to analyze price 'based on ICT', rather than displaying features to have a more classic interpretation for a technical analyst.

4C Options Expected Move (Weekly + 0DTE)This indicator plots the calculated Expected Move for BOTH Weekly and Zero Dated Expiration (0DTE) Daily options, for a quick visual reference.
Please Note: This indicator is different from our original "4C Expected Move (Weekly Options)" indicator, as it now packages the ability to ALSO plot 0DTE options expected moves along with Weekly expected moves. Many other newer features have also been implemented.
Background Information
The Expected Move (EM) is the amount that a stock is predicted to increase or decrease from its current price, based on the current level of options pricing and implied volatility.
This range can be viewed as possible support and resistance, or, once price gets outside of the range, institutional hedging actions can accelerate the move in that direction.
It can be useful to know what the weekly EM range is for a stock to understand the probabilities of the overall distance, direction and volatility for the week.
About the Indicator
This indicator plots the calculated Expected Move for BOTH Weekly and Zero Dated Expiration (0DTE) options, for a quick visual reference.
For the weekly EM, the range is based on the Weekly close of the prior week.
For the Daily EM based on 0DTE options, the range is based on the Daily close of the prior day.
The indicator will automatically start a new weekly EM plot at the beginning of the week, and a new daily EM at the beginning of each day.
The EM values must be updated weekly and/or daily.
Features
Plots the EM for the week
Plots the EM for the day, for symbols that offer daily expiration options
Plots the 2 Standard Deviation EM for both the weekly and daily EM
Labels with calculated values are plotted near the levels for quick visual aid
Settings
Can toggle weekly EM on/off
Can toggle Daily EM on/off
Can toggle 2 Standard Deviation lines on/off
Can toggle labels for all EM on/off
Robust line settings
Can adjust label location left/right based on personal preference
Can enter symbol into settings as a reference
Handy instructions in the settings
How To Set Up The Indicator
To use this indicator you must have access to a broker with options data (not available on Tradingview).
Usually, you can look at the stock's option chain to find the weekly expected move.
You will have to do your own research to find where this information is displayed depending on your broker. You may also need to find the information elsewhere if your broker does not have this information.
You can also do your calculation of the EM using the following formula (please do your own research):
Expected Move = Option Price x Implied Volatility x Square Root of Time
See screenshot example below
This is the Thinkorswim platform's option chain, and the Implied Volatility % and the calculated EM are on the right side of the option chain.
The Expected Move is circled in blue. Use the +- number in parentheses, NOT the % value.
For the weekly EM, input the number that corresponds to the weekly option into the indicator. This must be done on a weekly basis, and It is typically best to use the EM for the next week expiration that is generated AFTER the Friday close and/or before the Monday open of the upcoming week.
For the daily EM, input the number that corresponds to the daily 0DTE option into the indicator. This must be done on a daily basis, and it is typically best to use the EM value for the 0DTE option that is generated the night before (after market close), or before the market opens for that 0DTE. .

Comprehensive Market AnalyzerVERSION 2.0:
Notice to users: To better reflect its extensive features, this indicator has been renamed from "Tsūrubokkusu (Toolbox) 🧰" to "Comprehensive Market Analyzer". Thank you for your understanding and adaptation to this change.
Purpose and Usage:
The Comprehensive Market Analyzer is designed to provide traders with a holistic view of market conditions by integrating various technical indicators into a single,
cohesive tool. Each indicator has been carefully selected and improved to work together, offering enhanced customization and advanced market insights.
This combination allows for more comprehensive market analysis, improved decision-making, and efficient trading strategies.
📘 Machine Learning Integration
Purpose : Utilizes machine learning algorithms to analyze past market data and provides predictive insights based on historical data.
Usage : Activate machine learning features, set lookback windows, influence weighting, and start bar for improved trend predictions.
Activate Machine Learning :
Description : Enables advanced machine learning features that analyze past market data.
Details : This feature allows the algorithm to use historical data to forecast market movements, providing traders with enhanced predictive insights on historical data.
Kernel Lookback Window :
Description : Sets the number of previous bars that the algorithm will analyze.
Details : A higher number provides a broader view of market trends, while a lower number makes the model more sensitive to recent changes.
Kernel Influence Weighting :
Description : Adjusts the emphasis on recent versus older data.
Details : Increasing this value gives more importance to recent data, potentially making predictions more responsive to new trends.
Kernel Calculation Start Bar :
Description : Specifies the bar number from which to start the machine learning calculations.
Details : Avoids early data which may contain excessive noise and less reliable market signals.
Kernel Functions :
Gaussian Kernel :
Description : Uses a Gaussian distribution to weight historical data, focusing on more recent data points for trend analysis.
Details : Calculates weights based on the Gaussian distribution, emphasizing data points closer to the present.
Laplacian Kernel :
Description : Applies Laplacian distribution, emphasizing data points closer to the current time more heavily.
Details : Uses the Laplacian function to provide a different perspective on data weighting.
RBF Kernel :
Description : Utilizes a Radial Basis Function for smoothing and analyzing data, providing a different approach to trend prediction.
Details : Applies the RBF function to smooth data and enhance the accuracy of trend predictions.
Wavelet Kernel :
Description : Applies wavelet transform for analyzing frequency components, helping to detect patterns in the price movements.
Details : Uses wavelet-based calculations to focus on specific frequency components within the data, aiding in pattern recognition.
📘 Enhanced Ichimoku Kinkō Hyō Integration
Purpose : Provides a comprehensive overview of market trends and momentum using the Ichimoku Kinkō Hyō indicator.
Usage : Display various components of the Ichimoku Kinkō Hyō, customize their appearance, provides additional calculations for trend analysis.
Display Ichimoku Kinkō Hyō :
Description : Toggle to show or hide the Ichimoku Kinkō hyō indicator.
Details : This indicator helps traders see support and resistance levels, trend direction, and potential future movements.
Activate Heikin-Ashi Source :
Description : Switches between regular price data and Heikin-Ashi candles for analysis.
Details : Heikin-Ashi candles smooth price data, making trends easier to spot.
Display Tenkan-Sen Line :
Description : Shows the Tenkan-Sen line, a key short-term trend indicator.
Color Customization : Set the color of the Tenkan-Sen line for better visibility.
Minimum Length : Determine the shortest period for calculating the Tenkan-Sen line.
Maximum Length : Determine the longest period for calculating the Tenkan-Sen line.
Dynamic Length Adjustment : Automatically adjusts the length of the Tenkan-Sen based on market conditions.
Display Kijun-Sen Line :
Description : Shows the Kijun-Sen line, a key medium-term trend indicator.
Color Customization : Set the color of the Kijun-Sen line for better visibility.
Minimum Length : Determine the shortest period for calculating the Kijun-Sen line.
Maximum Length : Determine the longest period for calculating the Kijun-Sen line.
Dynamic Length Adjustment : Automatically adjusts the length of the Kijun-Sen based on market conditions.
Kijun-Sen Divider Tool : Adjust the sensitivity of the Kijun-Sen calculation.
Display Chikou Span :
Description : Shows the Chikou Span, which lags behind the current price to help confirm trends.
Bear Phase Color : Set the color for bearish periods.
Bull Phase Color : Set the color for bullish periods.
Consolidation Color : Set the color for consolidation periods.
Minimum Length : Determine the shortest lag period for the Chikou Span.
Maximum Length : Determine the longest lag period for the Chikou Span.
Dynamic Length Adjustment : Automatically adjusts the length of the Chikou Span based on market conditions.
Display Senkou Span A and B :
Description : Shows the Senkou Span A and B, which form the Ichimoku Cloud indicating future support and resistance levels.
Bear Color : Set the color for bearish clouds.
Bull Color : Set the color for bullish clouds.
Neutral Color : Set the color for neutral periods.
Minimum Length : Determine the shortest period for calculating the Senkou Span.
Maximum Length : Determine the longest period for calculating the Senkou Span.
Dynamic Length Adjustment : Automatically adjusts the length of the Senkou Span based on market conditions.
Projection Offset : Set how far ahead the Senkou Span is projected.
Kumo Cloud Settings :
Enable Kumo Cloud Fill : Toggle to fill the space between Senkou Span A and B with color.
Cloud Fill Transparency : Adjust the transparency of the cloud fill.
Apply WMA Smoothing :
Description : Smooths the indicator lines using a Weighted Moving Average to clarify trends.
Bar Coloring Based on Ichimoku Signals :
Description : Colors the bars based on Ichimoku signals to provide a quick visual indication of market sentiment.
Bearish Signal Bar Color : Set the color for bars during bearish signals.
Bullish Signal Bar Color : Set the color for bars during bullish signals.
Consolidation Signal Bar Color : Set the color for bars during consolidation periods.
Neutral Bar Color : Set the color for bars during neutral conditions.
Enhanced Calculations :
Heikin Ashi Values : Smooths price movements to make trends more visible.
Alternative Source Calculation : Uses a different method for calculating the indicator based on user settings.
Volume Calculations : Enhanced functions for calculating volume based on different candlestick patterns.
Dynamic Length Adjustment : Automatically adjusts the length of Ichimoku components based on market volatility.
Gaussian Kernel Calculations : Uses advanced calculations for smoother and more accurate trend analysis.
Chikou Span Adaptation : Improved calculation for the Chikou Span using dynamic lengths and advanced methods.
Visual Enhancements : Adds color gradients to the Senkou Span and dynamic coloring for the Chikou Span to improve trend visibility.
Plotting Ichimoku Components :
Tenkan-Sen : Plots the Tenkan-Sen line with dynamic adjustments.
Kijun-Sen : Plots the Kijun-Sen line with dynamic adjustments.
Senkou Span A and B : Plots these lines with dynamic projections and advanced smoothing.
Chikou Span : Plots the Chikou Span with dynamic offsets and coloring.
📘 Enhanced Candlestick Patterns Integration
Purpose : Identifies and displays various candlestick patterns to help traders spot key market movements and potential reversals.
Usage : Toggle the display of patterns, select specific pattern types, and customize pattern labels for improved visual analysis.
Display Patterns :
Description : Toggle to enable or disable the display of all candlestick patterns.
Details : When enabled, all selected candlestick patterns will be displayed on the chart, aiding traders in identifying key market movements and potential reversals.
Select Pattern Type :
Description : Select the type of candlestick patterns to detect.
Details : Options include Bullish (indicating potential upward trends), Bearish (indicating potential downward trends), or Both.
Trend Filter Method :
Description : Select the method to filter trends.
Details : Options include True Range (based on price range), Fractals, Volume, Combined, or None (no filtering).
Pattern Label Colors :
Bullish Pattern Color : Choose the color for labeling Bullish patterns, indicating potential upward trends.
Bearish Pattern Color : Choose the color for labeling Bearish patterns, indicating potential downward trends.
Indecision Pattern Color : Choose the color for labeling Indecision patterns, indicating no clear trend direction.
Base Line and Patterns Display Options :
Show Base Line in Place of Labels : Toggle to display a base line instead of labels for detected patterns. This helps visualize the general trend.
Show Counterattack Lines : Toggle to display Counterattack Lines patterns, indicating potential reversal points.
Show Dark Cloud Cover : Toggle to display Dark Cloud Cover patterns, a bearish pattern suggesting a potential reversal from an uptrend to a downtrend.
Show Engulfing Patterns : Toggle to display Engulfing patterns. Bullish Engulfing patterns suggest a potential upward reversal, while Bearish Engulfing patterns suggest a potential downward reversal.
Show Hammer Patterns : Toggle to display Hammer patterns, a bullish pattern indicating a potential reversal from a downtrend to an uptrend.
Show Hanging Man Patterns : Toggle to display Hanging Man patterns, a bearish pattern indicating a potential reversal from an uptrend to a downtrend.
Show Harami Patterns : Toggle to display Harami patterns. Bullish Harami patterns suggest a potential upward reversal, while Bearish Harami patterns suggest a potential downward reversal.
Show In-Neck Patterns : Toggle to display In-Neck patterns, indicating a potential continuation of the current trend.
Show On-Neck Patterns : Toggle to display On-Neck patterns, indicating a potential continuation of the current trend.
Show Piercing Patterns : Toggle to display Piercing patterns, a bullish pattern suggesting a potential reversal from a downtrend to an uptrend.
Show Three Black Crows : Toggle to display Three Black Crows patterns, a bearish pattern suggesting a potential reversal from an uptrend to a downtrend.
Show Thrusting Patterns : Toggle to display Thrusting patterns, a bearish pattern suggesting a potential continuation of the downtrend.
Show Upside Gap Two Crows : Toggle to display Upside Gap Two Crows patterns, a bearish pattern suggesting a potential downward reversal after an upward gap.
Show Evening Star : Toggle to display Evening Star patterns, a bearish pattern suggesting a potential reversal from an uptrend to a downtrend.
Show Inverted Hammer : Toggle to display Inverted Hammer patterns, a bullish pattern suggesting a potential reversal from a downtrend to an uptrend.
Show Morning Star : Toggle to display Morning Star patterns, a bullish pattern suggesting a potential reversal from a downtrend to an uptrend.
Show Shooting Star : Toggle to display Shooting Star patterns, a bearish pattern suggesting a potential reversal from an uptrend to a downtrend.
Show Doji Patterns : Toggle to display Doji patterns, indicating market indecision and potential reversals.
Show Dragonfly Doji : Toggle to display Dragonfly Doji patterns, a bullish pattern suggesting a potential reversal from a downtrend to an uptrend.
Show Evening Doji Star : Toggle to display Evening Doji Star patterns, a bearish pattern suggesting a potential reversal from an uptrend to a downtrend.
Show Gravestone Doji : Toggle to display Gravestone Doji patterns, a bearish pattern suggesting a potential reversal from an uptrend to a downtrend.
Show Long-Legged Doji : Toggle to display Long-Legged Doji patterns, indicating high market indecision and potential reversals.
Show Morning Doji Star : Toggle to display Morning Doji Star patterns, a bullish pattern suggesting a potential reversal from a downtrend to an uptrend.
Show Rising Three Methods : Toggle to display Rising Three Methods patterns, a bullish pattern suggesting a continuation of the uptrend.
Show Falling Three Methods : Toggle to display Falling Three Methods patterns, a bearish pattern suggesting a continuation of the downtrend.
Show Tasuki Patterns : Toggle to display Tasuki patterns, indicating potential trend continuation after a gap.
Show Marubozo : Toggle to display Marubozo patterns, indicating strong trend continuation, either bullish or bearish.
Show Long Lower Shadow : Toggle to display Long Lower Shadow patterns, indicating strong buying pressure and potential upward movement.
Show Long Upper Shadow : Toggle to display Long Upper Shadow patterns, indicating strong selling pressure and potential downward movement.
Show Three Inside Up/Down : Toggle to display Three Inside Up/Down patterns, indicating potential bullish or bearish reversals.
Show Kicker Pattern : Toggle to display Kicker patterns, indicating significant potential reversals.
Show Tweezer Tops/Bottoms : Toggle to display Tweezer Tops/Bottoms patterns, indicating potential reversals at the tops or bottoms.
Show Mat Hold Pattern : Toggle to display Mat Hold patterns, a bullish pattern suggesting a continuation of the uptrend.
Candle Body/Shadow Comparison Options :
Candle Body/Shadow Comparison : Choose the criteria to compare candle sizes: Shadows (larger shadows), Body (larger body), Both (larger shadows and body), Either (larger shadows or body), or None (no comparison).
Look-back Period for Candle Comparison : Specify the number of periods to look back when comparing the current candle size to determine if it is significant.
Period for Body Length Average : Specify the period for calculating the average body length of candles to help identify significant patterns.
Period for Candle Length Average : Specify the period for calculating the average length of candles to help identify significant patterns.
Specific Pattern Thresholds :
Doji Body Percentage Threshold : Set the percentage threshold for identifying Doji patterns based on the candle body size compared to its range.
Upper Shadow Percentage Limit : Set the maximum allowed upper shadow percentage of the candle’s range for identifying specific Doji patterns.
Lower Shadow Percentage Limit : Set the maximum allowed lower shadow percentage of the candle’s range for identifying specific Doji patterns.
Price Deviation Tolerance : Specify the price deviation tolerance for pattern recognition, which helps in identifying patterns within a certain price range.
Thrusting Neck Percentage : Set the percentage threshold for identifying Thrusting Neck patterns, indicating a potential continuation of the current trend.
Base Line Settings :
Base Line EMA Length : Specify the length of the EMA for the Base Line, helping to visualize the general trend.
Enhanced Calculations :
Wavelet Transform : If machine learning is enabled, calculates the wavelet transform for smoother and more accurate pattern detection.
Candle Body and Shadows Calculation : Detailed calculations for candle body and shadow lengths to improve pattern detection.
Average Calculations : Calculate averages for body and candle sizes to help identify significant patterns.
Fractals Calculation : Identify fractal highs and lows to aid in trend detection.
Trend Filters : Apply user-selected trend filters based on True Range, Fractals, Volume, or a combination.
Pattern Detection and Labeling : Detects and labels various candlestick patterns, including Doji, Engulfing, Hammer, and more, with options for displaying labels or base lines.
Alerts and Notifications : Set alerts for detected patterns and base line colors to notify traders of significant market events.
Plotting Candlestick Patterns :
Pattern Detection : Automatically detects and labels various candlestick patterns based on user settings.
Label Customization : Customize the labels for different patterns, including color and text.
Base Line Plotting : Option to plot a base line instead of labels for detected patterns, enhancing trend visualization.
Alerts for Patterns : Set alerts for detected patterns to keep traders informed of significant market changes.
📘 Enhanced Fibonacci Retracement Integration
Purpose : Provides a tool for identifying potential support and resistance levels using Fibonacci retracement.
Usage : Toggle the display of Fibonacci levels, adjust the lookback period, and customize the appearance of Fibonacci levels for better market analysis.
Auto Mode :
Description : Toggle to enable or disable automatic detection of price points.
Details : When enabled, the highest and lowest price points within a specified period will be automatically detected to set Fibonacci levels. Disable to manually set the top and bottom prices.
Period :
Description : Set the lookback period for detecting price points.
Details : Defines the number of bars to look back when detecting the highest and lowest prices in Auto Mode, used for calculating Fibonacci levels.
Manual Top :
Description : Manually set the top price level.
Details : Adjust this setting to reflect the peak price of interest when Auto Mode is disabled.
Manual Bottom :
Description : Manually set the bottom price level.
Details : Adjust this setting to reflect the low price of interest when Auto Mode is disabled.
Display Fibonacci :
Description : Toggle to show or hide Fibonacci retracement levels.
Details : When enabled, the calculated Fibonacci levels will be displayed on the chart, overlaying the price data.
Baseline Levels :
Description : Select Fibonacci levels to highlight as baselines.
Details : Choose specific levels to be visually distinct, emphasizing their significance in the analysis.
Fibonacci Levels Colors :
Upper Levels Color : Set the color for Fibonacci levels above the baseline, indicating potential resistance levels.
Lower Levels Color : Set the color for Fibonacci levels below the baseline, indicating potential support levels.
Baseline Levels Color : Set the color for highlighted baseline Fibonacci levels, making them stand out from other levels.
Display Individual Fibonacci Levels :
Show Level : Toggle to enable or disable the display of specific Fibonacci levels.
Level Value : Set the multiplier used to calculate each specific Fibonacci level relative to the price range.
Reverse Levels :
Description : Toggle to switch the calculation direction of Fibonacci levels.
Details : When enabled, levels are calculated in reverse, useful for analyzing downtrends.
Line Extension :
Description : Choose how Fibonacci level lines are extended on the chart.
Details : Options include extending lines to the left, right, or both, affecting their visual presentation.
Text Size :
Description : Adjust the font size of the labels for Fibonacci levels.
Details : Options range from large to tiny, allowing for readability adjustments according to user preference.
Line Style :
Description : Select the line style for Fibonacci levels.
Details : Options include solid, dotted, and dashed, providing visual distinction.
Line Width :
Description : Set the thickness of the Fibonacci level lines.
Details : A higher value makes the lines more prominent on the chart.
Baseline Line Style :
Description : Choose the line style specifically for the baseline levels.
Details : This can differ from other Fibonacci levels to emphasize their importance.
Baseline Line Width :
Description : Adjust the thickness of the baseline level lines.
Details : Can be set differently from other levels for visual emphasis.
Enhanced Calculations :
Automatic and Manual Top/Bottom Setup : Detect or manually set the highest and lowest price points.
Price Range Calculation : Determine the range between the highest and lowest prices.
Fibonacci Level Values : Calculate the values for each Fibonacci level.
Visual and Label Configuration : Configure visual aspects and labels for each level.
Plotting and Labeling :
Level Plotting :
Description : Plot each Fibonacci level on the chart.
Details : Draw lines representing each calculated level.
Label Customization :
Description : Customize the labels for Fibonacci levels.
Details : Include text, colors, and positioning for clarity.
📘 Supports and Resistances Integration
Purpose : Identifies key support and resistance levels to aid in market analysis.
Usage : Toggle the display of support and resistance lines, customize their appearance, and use Bollinger Bands for additional insights.
Display Supports and Resistances :
Description : Toggle to enable or disable the display of support and resistance lines.
Details : When enabled, support and resistance lines will be shown on the chart, providing key levels for market analysis.
Swing Period :
Description : Set the retrospective period for identifying swing points.
Details : A longer period captures more significant trends but may reduce sensitivity. The default value is 10.
Support Line Color :
Description : Set the color for support lines.
Details : Choose a color that enhances chart readability. Default is green.
Resistance Line Color :
Description : Set the color for resistance lines.
Details : Choose a color that makes resistance lines easily distinguishable. Default is red.
Trend-Based Line Color :
Description : Toggle to enable dynamic coloring based on trend direction.
Details : When enabled, the color of the lines will change according to the trend, aiding visual analysis.
Line Thickness :
Description : Adjust the thickness of the support and resistance lines.
Details : Choose a thickness value between 1 and 5 for better visibility.
Line Style :
Description : Select the style of the lines.
Details : Options include Solid, Dotted, or Dashed lines for visual distinction.
Number of Lines to Display :
Description : Set the maximum number of support/resistance lines to display.
Details : Adjust the number of lines to avoid clutter or to show more levels.
Display Bollinger Bands :
Description : Toggle to show or hide Bollinger Bands on the chart.
Details : Bollinger Bands provide a visual representation of volatility and potential price ranges.
Bollinger Bands Integration :
Description : Enable the integration of Bollinger Bands for S/R calculation.
Details : This feature adjusts the placement of S/R lines based on the market volatility captured by the Bollinger Bands.
Bollinger Bands Color Settings :
Description : Set colors for different Bollinger Band conditions.
Details :
Green: Prices above the median but below the upper band (potential overbought area).
Dark green: Prices above the upper band (strong upward momentum).
Light red: Prices below the median but above the lower band (potential oversold area).
Dark red: Prices below the lower band (strong downward momentum).
Fill Opacity Adjustment :
Description : Adjust the fill opacity between Bollinger Bands.
Details : Set the opacity level to balance visibility with other chart elements.
BB Sensitivity Level :
Description : Adjust the sensitivity for determining S/R levels near Bollinger Bands.
Details : A higher value increases the consideration of levels near the bands.
Band Width Multiplier :
Description : Control the width of the Bollinger Bands.
Details : Adjust the multiplier to expand or contract the bands based on market volatility.
Uniform BB Coloring :
Description : Apply a consistent color to Bollinger Bands.
Details : Simplify visual interpretation with a uniform color.
Plotting and Alerts :
Plotting Bollinger Bands :
Description : Plot the Bollinger Bands on the chart.
Details : The bands are colored based on the conditions set for market volatility and price ranges.
Alerts and Notifications :
Description : Set alerts for support/resistance breaks and Bollinger Band breakouts.
Details : Notify traders of significant market events related to these levels.
📘 Enhanced Trend Lines Integration
Purpose : Identifies and plots trend lines based on market structure to help traders understand market direction and potential buy/sell points.
Usage : Toggle the display of trend lines, customize their appearance, and use enhanced calculations for trend analysis.
Display Trend Lines :
Description : Enable or disable the display of trend lines on the chart.
Details : These trend lines are calculated based on market structure, specifically through the detection of Breaks of Structure (BOS). If enabled, the trend lines will help in identifying the market overall trend and potential buy and sell points.
Trend Line Colors :
Upper Line Color : Set the color for the upper trend lines to enhance visual distinction.
Lower Line Color : Set the color for the lower trend lines, aiding in easy identification of support levels.
Pivot Labels :
Show Pivots Labels : Control the display of pivot labels on the chart.
Pivot Label Size : Select the size of the pivot labels displayed on the chart. Options include Tiny, Small, Normal, Large, and Huge.
Trend Line Calculations :
Pivot Depth : Adjust the depth for pivot calculation based on the selected timeframe to capture significant price movements.
Pivot Deviation : Set the deviation for pivot calculation to identify key turning points.
Pivot Backstep : Define the backstep for pivot calculation to ensure accurate detection of pivot points.
Enhanced Calculations :
Market Structure Detection : Utilize advanced algorithms to identify key market structures, improving trend line accuracy.
Adaptive Parameters : Automatically adjust pivot depth, deviation, and backstep based on the selected timeframe for better relevance.
Zigzag Calculation : Implement zigzag patterns to dynamically adjust trend lines, ensuring they reflect current market conditions.
Slope and Intercept Calculation : Compute the slope and intercept for trend lines to enhance precision in trend detection.
Dynamic Updates : Continuously update trend lines as new data becomes available, ensuring real-time accuracy.
Alerts and Notifications : Set alerts for new high and low pivots, as well as for when the price crosses upper or lower trend lines, keeping traders informed of significant market changes.
Plotting Trend Lines :
Trend Line Plotting : Automatically draw trend lines based on detected BOS, helping traders visualize the market trend.
Diagonal Support/Resistance Lines : Plot diagonal lines to indicate support and resistance levels, enhancing the understanding of market dynamics.
Pivot Label Customization : Customize pivot labels for clear identification of high and low points in the trend.
Alerts for Trend Lines : Set alerts for when price crosses trend lines, ensuring timely notifications of potential trading opportunities.
📘 Enhanced Linear Regression Integration
Purpose : Uses linear regression to analyze price movements and identify trends.
Usage : Display the linear regression projection line, customize its appearance, and use enhanced calculations for better trend analysis.
Display Projection Line :
Description : Toggle to display or hide the linear regression projection line on the chart.
Details : This line represents the best fit line that predicts future prices based on historical data.
Data Source :
Description : Select the data source for the linear regression projection.
Details : This is typically the closing price but can be any price point such as open, high, or low. The selected source will be used to calculate the linear regression projection line.
Trend-Based Line Color :
Enable Trend-Based Line Color : Toggle to automatically color the projection line based on the trend direction. When enabled, the line will be red for a downward trend and green for an upward trend, providing a visual indication of market direction.
Uptrend Line Color : Select the color for the projection line when the trend is upward. This color will be used when "Enable Trend-Based Line Color" is active.
Downtrend Line Color : Select the color for the projection line when the trend is downward. This color will be used when "Enable Trend-Based Line Color" is active.
Enhanced Calculations :
Standard Deviation Calculation : Calculate the standard deviation for a given length to understand the volatility around the linear regression line.
Pearson's Correlation Calculation : Compute Pearson's R to measure the strength of the linear relationship between the price points and the linear regression line.
Slope and Intercept Calculation : Calculate the slope and intercept for the regression line, providing the basis for the projection.
Kernel Application : Optionally apply the RBF Kernel to the selected source data for smoothing and enhancing the regression calculations.
Dynamic Length Selection : Automatically select the optimal regression period based on the highest Pearson's R value, ensuring the most accurate trend representation.
Real-Time Updates : Continuously update the regression line and related calculations as new data becomes available, maintaining accuracy in real-time.
Alerts and Notifications : Set alerts for when the price crosses the linear regression projection line, notifying traders of significant market events.
Plotting Linear Regression Components :
Projection Line Plotting : Automatically draw the linear regression projection line based on historical data and the selected data source.
Label Customization : Customize the label for the projection line, including color and text, for clear identification on the chart.
Alerts for Projection Line : Set alerts for when the price crosses the projection line, ensuring timely notifications of potential trading opportunities.
📘 POC Analysis Integration
Purpose : Identifies the Point of Control (POC) to highlight price levels with the highest trading volume.
Usage : Toggle the display of the POC, customize its appearance, and use enhanced calculations for better market analysis.
Display POC :
Description : Toggle to display or hide the Point of Control (POC) on the chart.
Details : The POC is the price level at which the highest volume of trading occurred, indicating a focal point of market activity.
Data Source :
Description : Select the price source for POC analysis.
Details : This is typically the closing price but can be any price point such as open, high, or low. The selected source will be used to calculate the POC.
POC Line Colors :
Color Above POC : Set the line color when the closing price is above the POC.
Color Below POC : Set the line color when the closing price is below the POC.
Width Multiplier :
Description : Adjust the width around the price for POC analysis.
Details : A higher value broadens the calculation range.
POC Calculation and Visualization :
Price Level Initialization : Calculate the initial spacing between price levels based on the first candlestick and user settings.
Volume Data Accumulation : Accumulate volume data at specified price levels for each candlestick to determine the POC.
Dynamic Array Expansion : Expand price levels array to accommodate new price data outside the current range.
POC Determination : Determine and visualize the POC at the last candlestick if enabled by the user.
Alerts and Notifications : Set alerts for when the price crosses the POC, notifying traders of significant market events.
Plotting POC Components :
POC Line Plotting : Automatically draw the POC line based on historical data and the selected data source.
Label Customization : Customize the label for the POC line, including color and text, for clear identification on the chart.
Alerts for POC : Set alerts for when the price crosses the POC, ensuring timely notifications of potential trading opportunities.
📘 Enhanced Divergences Integration
Purpose : Detects and displays divergences between price movements and indicators to identify potential reversal points.
Usage : Toggle the display of divergences, select data sources, customize divergence colors, and use enhanced calculations for better trend analysis.
Display Divergences :
Description : Toggle to display or hide the detected divergences on the chart.
Details : Divergences occur when the price movement of an asset and a related indicator (e.g., volume or momentum) move in opposite directions. They are used to identify potential reversal points in the market. Regular divergences signal possible reversals, while hidden divergences can indicate continuation.
Data Source :
Description : Defines the timeframe from which to fetch data for analysis.
Details : Typically lower than the chart current timeframe for multi-timeframe analysis.
Divergence Colors :
Bearish Divergence Color : Sets the color for bearish divergence lines. Bearish divergences typically suggest potential downward price movement.
Bullish Divergence Color : Sets the color for bullish divergence lines. Bullish divergences typically indicate potential upward price movement.
Pivot Bars :
Left Bars : Number of bars to the left of the pivot point to consider. Helps in identifying the pivot high or low by looking back these many bars.
Right Bars : Number of bars to the right of the pivot point to consider. Assists in confirming a pivot point by ensuring no higher high or lower low is present within this range.
Display Hidden Divergences :
Description : When enabled, this setting reveals hidden divergences on the chart.
Details : Hidden divergences are a subtler form of divergence that often signal continuation rather than reversal. A hidden bullish divergence occurs when price makes a higher low while the indicator makes a lower low, suggesting the continuation of an uptrend. Conversely, a hidden bearish divergence occurs when price makes a lower high while the indicator makes a higher high, indicating the continuation of a downtrend. These divergences are particularly useful for identifying the strength of the current trend.
Dynamic Line Width Based on Divergence Count :
Description : When enabled, adjusts the width of the divergence line dynamically based on the count of divergences detected.
Details : This provides visual emphasis on stronger signals.
Enhanced Calculations :
Standard Deviation Calculation : Calculate the standard deviation for a given length to understand the volatility around the linear regression line.
Pearson's Correlation Calculation : Compute Pearson's R to measure the strength of the linear relationship between the price points and the linear regression line.
Slope and Intercept Calculation : Calculate the slope and intercept for the regression line, providing the basis for the projection.
Kernel Application : Optionally apply the RBF Kernel to the selected source data for smoothing and enhancing the regression calculations.
Dynamic Length Selection : Automatically select the optimal regression period based on the highest Pearson's R value, ensuring the most accurate trend representation.
Real-Time Updates : Continuously update the regression line and related calculations as new data becomes available, maintaining accuracy in real-time.
Alerts and Notifications : Set alerts for when the price crosses the linear regression projection line, notifying traders of significant market events.
Plotting Divergence Components :
Divergence Line Plotting : Automatically draw divergence lines based on historical data and the selected data source.
Label Customization : Customize the label for the divergence lines, including color and text, for clear identification on the chart.
Alerts for Divergences : Set alerts for when a divergence is detected, ensuring timely notifications of potential trading opportunities.
📘 Enhanced Average True Range Integration
Purpose : Measures market volatility using the Average True Range (ATR) to assist in identifying potential buy and sell points.
Usage : Set the ATR period, minimum tick filter, upper and lower coefficients, and customize ATR colors for better market analysis.
Show Labels :
Description : Enable or disable the display of labels for the Average True Range (ATR) indicator.
Details : This option controls whether the ATR signals (buy and sell) are shown on the chart with respective labels.
ATR Period :
Description : Sets the period for calculating the Average True Range (ATR).
Details : The ATR measures market volatility by calculating the average range of price movement over a specified period. A shorter period makes the ATR more sensitive to recent price movements, while a longer period smooths out short-term volatility.
Minimum Tick Filter :
Description : Sets the minimum tick filter for buy and sell signals.
Details : This filter ensures that the price movement is significant enough to be considered a valid signal. For example, a value of 20 means that the price must move at least 20 ticks from the open to the close to generate a signal.
Upper Coefficient :
Description : Sets the upper coefficient for band calculation.
Details : This value adjusts the sensitivity of the upper band used to detect high points. A higher coefficient makes the band wider, capturing more significant price movements, while a lower coefficient makes the band narrower, making it more sensitive to smaller price changes.
Lower Coefficient :
Description : Sets the lower coefficient for band calculation.
Details : This value adjusts the sensitivity of the lower band used to detect low points. A higher coefficient makes the band wider, capturing more significant price movements, while a lower coefficient makes the band narrower, making it more sensitive to smaller price changes.
ATR Colors :
Bullish Color : Sets the color for the bullish signal, helping to visually distinguish bullish trends.
Bearish Color : Sets the color for the bearish signal, helping to visually distinguish bearish trends.
Enhanced Calculations :
Dynamic Coefficient Calculation : Calculates dynamic coefficients based on market volatility, adjusting the sensitivity of ATR bands accordingly.
Band Calculation : Computes high and low bands using dynamic coefficients to detect significant price movements.
High/Low Point Detection : Identifies potential high and low points based on ATR band calculations and price thresholds.
Real-Time Updates : Continuously updates ATR calculations and signals as new data becomes available, ensuring accuracy in real-time.
Plotting ATR Components :
Signal Plotting : Plots bullish and bearish ATR signals on the chart based on calculated conditions.
Label Customization : Customize the labels for ATR signals, including color and text, for clear identification on the chart.
Alerts for Signals : Set alerts for detected bullish and bearish signals, ensuring timely notifications of potential trading opportunities.
📘 Enhanced ATR Visualization Parameters
Purpose : Provides a visual representation of market volatility using the ATR Strength Meter.
Usage : Toggle the display of the ATR Strength Meter, set thresholds, and customize its appearance for better market analysis.
Display ATR Strength Meter :
Description : Toggle to display or hide the ATR Strength Meter, a visual representation of market volatility.
Details : The meter is based on the Average True Range (ATR) and helps identify volatility trends.
High ATR Threshold :
Description : Set the threshold for high volatility.
Details : ATR values above this threshold indicate increased market volatility.
Low ATR Threshold :
Description : Set the threshold for low volatility.
Details : ATR values below this threshold indicate decreased market volatility.
Progression Bar Position :
Description : Select the position of the ATR Strength Meter on the chart.
Details : Options are "Top" or "Bottom", affecting where the volatility meter is displayed relative to price action.
Progress Bar Length :
Description : Set the horizontal length of the ATR Strength progression bar.
Details : Adjust to increase or decrease the bar's width, accommodating different chart sizes and user preferences.
Enhanced Calculations :
ATR Strength Calculation : Calculate the ATR strength to measure market volatility.
Dynamic Coefficients : Use dynamic coefficients based on volatility for more accurate calculations.
Progress Bar Calculation : Determine the position and color of the progression bar based on ATR strength.
Label Positioning : Dynamically position labels for minimum and maximum values to avoid overlap.
Plotting ATR Strength Meter :
Progression Bar Plotting : Plot the progression bar to represent the ATR strength.
Label Customization : Customize labels for the ATR strength, minimum, and maximum values.
📘 Enhanced Relative Strength Index Integration
(A special thanks to RumpyPumpyDumpy for allowing the private reuse of his script.)
Purpose : Measures market momentum using the Relative Strength Index (RSI) and Stochastic RSI to assist in identifying potential buy and sell points.
Usage : Set the RSI and StochRSI parameters, toggle the display of the RSI Meter, and customize its appearance for better market analysis.
RSI Calculation Parameters :
RSI Length : Defines the length of the RSI calculation.
Details : A longer period captures more data points but may reduce sensitivity.
RSI Overbought Level : Sets the overbought level for RSI.
Details : Values above this level indicate overbought conditions.
RSI Oversold Level : Sets the oversold level for RSI.
Details : Values below this level indicate oversold conditions.
StochRSI Length : Defines the length of the StochRSI calculation.
Details : A longer period captures more data points but may reduce sensitivity.
StochRSI %K Length : Defines the length of the %K line of the StochRSI.
StochRSI %D Length : Defines the length of the %D line (SMA of %K) of the StochRSI.
RSI Visualization Parameters :
Display RSI Meter : Toggle the display of the RSI Meter on the chart.
RSI Meter Size : Adjust the size of the RSI Meter displayed on the chart.
Details : Measured as the diameter of the meter. Increase the value for larger display size, enhancing visibility and making it easier to read the RSI trend at a glance.
Horizontal Offset : Move the RSI Meter horizontally across the chart.
Details : Positive values shift the meter to the left, allowing for placement adjustments relative to the chart's current view or specific visual preferences.
RSI Meter Components :
Sectors and Ticks : Draw sector arcs and tick marks around the RSI Meter to represent different RSI levels and thresholds.
Needle : Draw the needle on the RSI Meter to indicate the current RSI value.
Sector Labels : Label each sector of the RSI Meter to indicate market conditions like "Strong Buy," "Buy," "Neutral," "Sell," and "Strong Sell."
Title Label : Draw the title label for the RSI Meter displaying the RSI value and its period.
Enhanced Calculations :
RSI Calculation : Calculate the RSI using the built-in function with the specified length and source.
StochRSI Calculation : Calculate StochRSI values using the specified lengths for RSI, %K, and %D.
Dynamic Line Management : Efficiently manage and update dynamically created line objects to prevent potential memory leaks.
Optimized Sector and Needle Drawing : Enhanced the drawing functions for sectors, needles, and ticks to improve visual clarity and performance.
Plotting RSI Meter :
Sector Plotting : Draw the sectors on the RSI Meter using specified colors and widths to represent different RSI levels and thresholds.
Needle Plotting : Plot the needle on the RSI Meter based on the calculated RSI value to visually indicate the current RSI level.
Tick Plotting : Plot tick marks around the RSI Meter to denote key RSI levels and thresholds for better readability.
Label Plotting : Draw sector labels and a title label on the RSI Meter to provide context and information about the RSI levels and their corresponding market conditions.
📘 Market Sentiment Integration
Purpose : Analyzes market sentiment using various indicators to provide an overall sentiment score.
Usage : Enable or disable individual sentiment indicators, set account type, and customize sentiment calculations for better market analysis.
Volatility Index (IV) :
Description : Enable or disable the use of the Volatility Index in sentiment calculation.
Details : When enabled, the Volatility Index (IV) provides insight into market sentiment by measuring market volatility. The selected Volatility Index varies based on your TradingView account type.
Account Type :
Description : Select your TradingView account type.
Details : Free accounts use SPX, while Premium accounts use VIX.
Put/Call Ratio (PCR) :
Description : Enable or disable the use of the Put/Call ratio in sentiment calculation.
Details : The Put/Call ratio is a sentiment indicator that measures the volume of put options traded relative to call options, indicating market sentiment towards bearish or bullish expectations.
Fear and Greed Index :
Description : Enable or disable the use of the Fear and Greed Index in sentiment calculation.
Details : The Fear and Greed Index gauges the prevailing emotions in the market, indicating whether investors are inclined towards fear (bearish sentiment) or greed (bullish sentiment).
Momentum Indicators :
Description : Enable or disable the use of momentum indicators like MACD and RoC in sentiment calculation.
Details : Momentum indicators help identify the strength and direction of price movements, assisting in sentiment analysis.
Adaptive Periods for Shorter Timeframes :
Description : Toggle this option to use shorter periods for sentiment indicators when analyzing lower timeframes.
Details : Enabling this option allows for more responsive and sensitive analysis when working with shorter timeframes.
Calculation Details :
Normalization Function : Normalize the values of the indicators over a 252-period range.
Set Periods Function : Set periods based on user preference for faster or slower periods, adjusting the analysis sensitivity.
IV Calculation : Calculate the IV value based on the selected Volatility Index (SPX for Free accounts, VIX for Premium accounts).
Put/Call Ratio Calculation : Calculate the Put/Call ratio using volume data, where put volume is proportional to the trading range, and call volume is proportional to the price change.
RoC Calculation : Calculate the Rate of Change (RoC) as a momentum indicator, measuring the percentage change in closing prices over a specified period.
Dynamic Thresholds : Define dynamic thresholds based on historical data, calculating mean and standard deviation to determine upper and lower thresholds for IV, PCR, and RoC.
📘 Enhanced Market Trend Dashboard Integration
Purpose : Provides a summary of key market indicators and signals in a single dashboard for quick and easy reference.
Usage : Customize the dashboard settings to display relevant market information, including Ichimoku components, Linear Regression, Support/Resistance levels, MACD, RSI, and Market Sentiment.
Market Trend Dashboard Parameters :
Display Market Trend Dashboard : Toggle to show or hide the market trend dashboard, providing a summary of key indicators and signals.
Panel Position : Select the position of the dashboard on the chart for optimal viewing.
Panel Text Size : Choose the text size for the information displayed in the dashboard, ensuring readability.
Panel Background Color : Set the background color of the market trend dashboard, enhancing contrast with the chart.
Ichimoku Dashboard Parameters :
Display Ichimoku Dashboard : Toggle to show or hide the Ichimoku section in the dashboard.
Display Tenkan-Sen Price Cross : Indicate when the price crosses the Tenkan-Sen line, signaling potential trade opportunities.
Display Kijun-Sen Price Cross : Indicate when the price crosses the Kijun-Sen line, often considered a stronger signal than Tenkan-Sen crosses.
Display Chikou Span Price Cross : Indicate Chikou Span price crosses, providing insight into potential trend reversals.
Display Kumo Breakout : Indicate Kumo (cloud) breakouts, which can signify major trend shifts.
Display Kumo Twist : Indicate Kumo twists, suggesting changing market dynamics and potential reversals.
Linear Regression Projection Dashboard Parameters :
Display LR Projection Dashboard : Toggle to show or hide the Linear Regression Projection section in the dashboard.
Display Linear Regression Period : Indicate the period used for Linear Regression Projection analysis.
Display Pearson R Details : Show the Pearson R value in the dashboard, indicating the strength and direction of the correlation in the Linear Regression Projection.
Supports and Resistances Dashboard Parameters :
Display S/R Dashboard : Toggle to show or hide the Support and Resistance section in the dashboard.
Display S/R Break Prices : Show the latest break prices of support and resistance levels in the dashboard.
MACD Dashboard Parameters :
Display MACD Dashboard : Toggle to show or hide the MACD section in the dashboard.
RSI Dashboard Parameters :
Display RSI Dashboard : Toggle to show or hide the Relative Strength Index section in the dashboard.
Display RSI Details : Show the RSI value and status in the dashboard.
Display StochRSI Details : Show the StochRSI %K, %D values and status in the dashboard.
Market Sentiment Dashboard Parameters :
Display Market Sentiment Dashboard : Enable or disable the display of the Market Sentiment Dashboard, which summarizes key market sentiment indicators like Implied Volatility, Put/Call Ratio, and Fear and Greed Index.
Display Implied Volatility Details : Show or hide the Implied Volatility details in the Market Sentiment Dashboard.
Display Put/Call Ratio Details : Show or hide the Put/Call Ratio details in the Market Sentiment Dashboard.
Display Fear and Greed Index Details : Show or hide the Fear and Greed Index details in the Market Sentiment Dashboard.
Enhanced Calculations :
Ichimoku Cloud Trend Calculation : Calculates trend based on the relationship between Ichimoku Cloud components, identifying bullish or bearish trends.
Support and Resistance Break Detection : Detects breaks in support and resistance levels and updates the dashboard accordingly.
Linear Regression Projection Calculation : Calculates Linear Regression Projection and Pearson R value for trend analysis.
MACD Signal Calculation : Determines MACD status based on histogram values.
RSI and StochRSI Calculation : Calculates RSI and StochRSI values and updates their statuses in the dashboard.
Market Sentiment Score Calculation : Calculates overall market sentiment score based on individual sentiment indicators.
Dynamic Alert Management : Manages alerts for various dashboard signals to prevent repeated alerts.
Real-Time Data Integration : Continuously updates the dashboard with real-time data for accurate and current trend analysis.
Plotting Market Trend Dashboard Components :
Ichimoku Components Plotting : Plots Tenkan-Sen, Kijun-Sen, Chikou Span, and Kumo cloud with dynamic adjustments.
Support and Resistance Levels Plotting : Plots support and resistance levels and updates them dynamically based on market data.
Linear Regression Projection Plotting : Plots the Linear Regression Projection line and labels with trend-based colors.
MACD and RSI Plotting : Plots MACD and RSI signals on the dashboard, including status updates.
Market Sentiment Indicators Plotting : Plots Market Sentiment indicators like IV, PCR, and Fear and Greed Index with dynamic updates.
Alert Notifications Plotting : Plots alert notifications for significant market changes based on dashboard signals.
Summary
This comprehensive market analyzer integrates multiple technical indicators, including machine learning, Ichimoku Kinkō Hyō, candlestick patterns, Fibonacci retracement, support and resistance levels, trend lines, linear regression, POC analysis, divergences, ATR, RSI, and market sentiment. Each section includes detailed descriptions and usage instructions to help traders understand how to effectively utilize the indicator in their trading strategies.

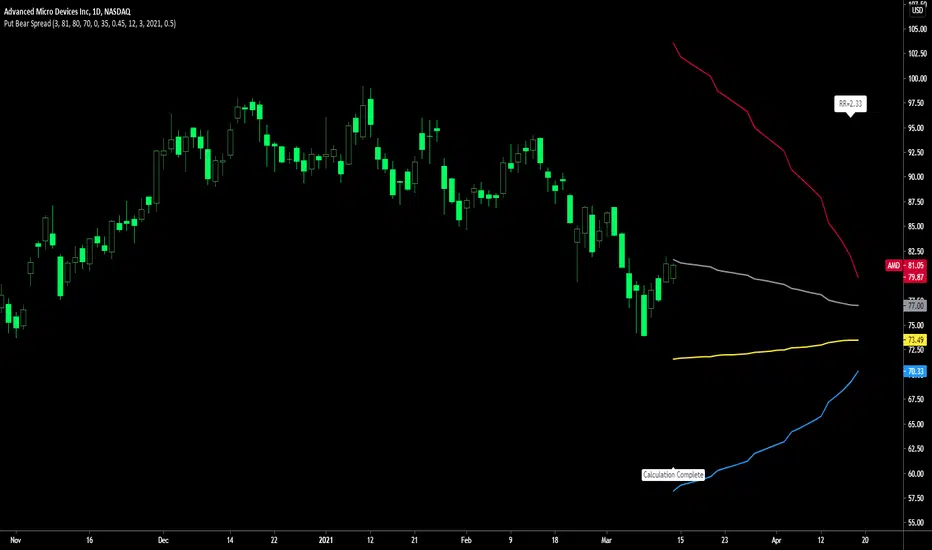
Future put ratio spread debit indicatorFuture Put ratio spread debit indicator developed by Chobotaru Brothers.
You need to have basic knowledge in option trading to use this indicator!
This spread is a DEBIT SPREAD.
The indicator shows P&L lines of the options strategy. Use only for futures since the mathematical model of options for Future instruments is different from stocks. Plus, the days' representation in futures is also different from stocks (stocks have fewer days than futures ).
***Each strategy in options is based on different mathematical equations, use this indicator only for the strategy in the headline.***
What does the indicator do?
The indicator is based on the Black-Scholes model, which uses partial differential equations to determine the option pricing. Due to options non-linear behavior, it is hard to visualize the option price. The indicator calculates the solutions of the Black-Scholes equation and plots them on the chart so traders can view how the option pricing will behave.
How the indicator does it?
The indicator uses five values (four dominants and one less dominant) to solve the Black-Scholes equation. The values are stock price, the strike price of the option, time to expiration, risk-free interest rate, and implied volatility .
How the indicator help the users?
-View the risks and rewards so you can know the profit targets in advance which means you can compare different options in different strikes.
-View the volatility change impact so you can know the risk and the P&L changes in case of a change in the volatility over the life of the option before you enter the trade.
-View the passage of time impact so you can know where and when you could realize a profit.
-Multi-timeframes so you can stay on the same chart (Daily and below).
All these features are to help the user improve his analysis while trading options.
How to use it?
The user needs to obtain from the “option chain” the following inputs:
-Debit paid: The debit paid for one unit of options strategy. Minimum value: 0.00001.
-Instrument price when entered spread: the stock price when you enter the options strategy.
-Upper strike price: the upper strike price of the options strategy.
-Lower strike price: the lower strike price of the options strategy.
- Upper Strike numbers of puts . This number has to be less than the number of puts that were sold.
- Lower Strike number of puts . This number has to be greater than the number of puts that were bought.
-Interest rate: find the risk-free interest rate from the U.S. DEPARTMENT OF THE TREASURY. Example: for 2% interest rate, input: 0.02.
-Days to expire: how many days until the option expires.
-Volatility: the implied volatility of the option bought/sold. Example: for 45% implied volatility , input: 0.45.
-Day of entry: A calendar day of the month that the option bought/sold.
-Month of entry: Calendar month the option bought/sold.
-Year of entry: Calendar year the option bought/sold.
After entering all the inputs, press Ok and you should see “Calculation Complete” on the chart.
The user should not change the entry date and days to expire inputs as time passes after he entered the trade.
How to access the indicator?
Use the link below to obtain access to the indicator
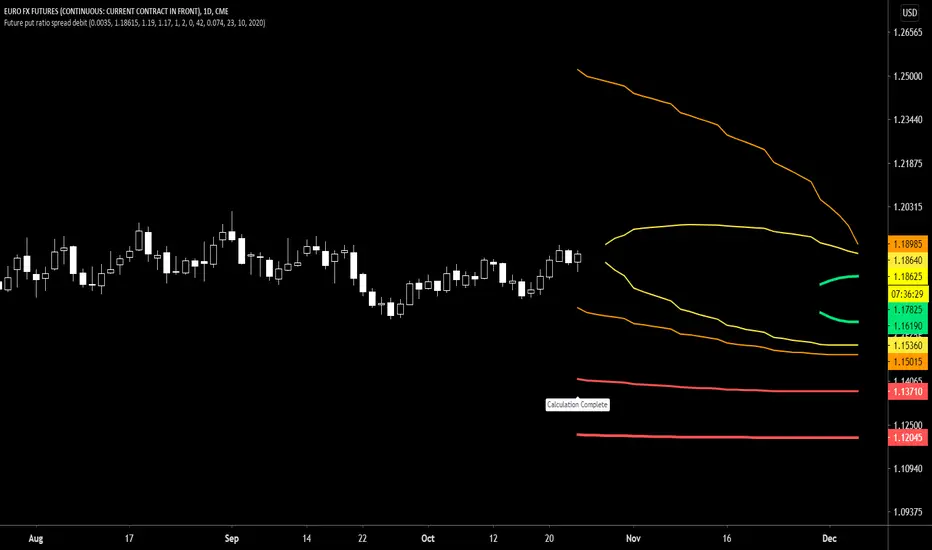
Future put ratio spread credit indicatorFuture Put ratio spread credit indicator developed by Chobotaru Brothers.
You need to have basic knowledge in option trading to use this indicator!
This spread is a CREDIT SPREAD.
The indicator shows P&L lines of the options strategy. Use only for futures since the mathematical model of options for Future instruments is different from stocks. Plus, the days' representation in futures is also different from stocks (stocks have fewer days than futures ).
***Each strategy in options is based on different mathematical equations, use this indicator only for the strategy in the headline.***
What does the indicator do?
The indicator is based on the Black-Scholes model, which uses partial differential equations to determine the option pricing. Due to options non-linear behavior, it is hard to visualize the option price. The indicator calculates the solutions of the Black-Scholes equation and plots them on the chart so traders can view how the option pricing will behave.
How the indicator does it?
The indicator uses five values (four dominants and one less dominant) to solve the Black-Scholes equation. The values are stock price, the strike price of the option, time to expiration, risk-free interest rate, and implied volatility .
How the indicator help the users?
-View the risks and rewards so you can know the profit targets in advance which means you can compare different options in different strikes.
-View the volatility change impact so you can know the risk and the P&L changes in case of a change in the volatility over the life of the option before you enter the trade.
-View the passage of time impact so you can know where and when you could realize a profit.
-Multi-timeframes so you can stay on the same chart (Daily and below).
All these features are to help the user improve his analysis while trading options.
How to use it?
The user needs to obtain from the “option chain” the following inputs:
-Credit received: The credit received for one unit of options strategy. Minimum value: 0.00001.
-Instrument price when entered spread: the stock price when you enter the options strategy.
-Upper strike price: the upper strike price of the options strategy.
-Lower strike price: the lower strike price of the options strategy.
- Upper Strike numbers of puts . This number has to be less than the number of puts that were sold.
- Lower Strike number of puts . This number has to be greater than the number of puts that were bought.
-Interest rate: find the risk-free interest rate from the U.S. DEPARTMENT OF THE TREASURY. Example: for 2% interest rate, input: 0.02.
-Days to expire: how many days until the option expires.
-Volatility: the implied volatility of the option bought/sold. Example: for 45% implied volatility , input: 0.45.
-Day of entry: A calendar day of the month that the option bought/sold.
-Month of entry: Calendar month the option bought/sold.
-Year of entry: Calendar year the option bought/sold.
After entering all the inputs, press Ok and you should see “Calculation Complete” on the chart.
The user should not change the entry date and days to expire inputs as time passes after he entered the trade.
How to access the indicator?
Use the link below to obtain access to the indicator

Future call ratio spread debit indicatorFuture Call ratio spread debit indicator developed by Chobotaru Brothers.
You need to have basic knowledge in option trading to use this indicator!
This spread is a DEBIT SPREAD.
The indicator shows P&L lines of the options strategy. Use only for stocks since the mathematical model of options for Future instruments is different from futures . Plus, the days' representation in futures is also different from stocks (stocks have fewer days than futures ).
***Each strategy in options is based on different mathematical equations, use this indicator only for the strategy in the headline.***
What does the indicator do?
The indicator is based on the Black-Scholes model, which uses partial differential equations to determine the option pricing. Due to options non-linear behavior, it is hard to visualize the option price. The indicator calculates the solutions of the Black-Scholes equation and plots them on the chart so traders can view how the option pricing will behave.
How the indicator does it?
The indicator uses five values (four dominants and one less dominant) to solve the Black-Scholes equation. The values are stock price, the strike price of the option, time to expiration, risk-free interest rate, and implied volatility .
How the indicator help the users?
-View the risks and rewards so you can know the profit targets in advance which means you can compare different options in different strikes.
-View the volatility change impact so you can know the risk and the P&L changes in case of a change in the volatility over the life of the option before you enter the trade.
-View the passage of time impact so you can know where and when you could realize a profit.
-Multi-timeframes so you can stay on the same chart (Daily and below).
All these features are to help the user improve his analysis while trading options.
How to use it?
The user needs to obtain from the “option chain” the following inputs:
-Debit paid: The debit paid for one unit of options strategy. Minimum value: 0.00001.
-Instrument price when entered spread: the stock price when you enter the options strategy.
-Upper strike price: the upper strike price of the options strategy.
-Lower strike price: the lower strike price of the options strategy.
- Upper Strike numbers of calls . This number has to be greater than the number of calls that were bought.
- Lower Strike number of calls . This number has to be less than the number of calls that were sold.
-Interest rate: find the risk-free interest rate from the U.S. DEPARTMENT OF THE TREASURY. Example: for 2% interest rate, input: 0.02.
-Days to expire: how many days until the option expires.
-Volatility: the implied volatility of the option bought/sold. Example: for 45% implied volatility , input: 0.45.
-Day of entry: A calendar day of the month that the option bought/sold.
-Month of entry: Calendar month the option bought/sold.
-Year of entry: Calendar year the option bought/sold.
After entering all the inputs, press Ok and you should see “Calculation Complete” on the chart.
The user should not change the entry date and days to expire inputs as time passes after he entered the trade.
How to access the indicator?
Use the link below to obtain access to the indicator

Future Call ratio spread credit indicatorFuture Call ratio spread credit indicator developed by Chobotaru Brothers.
You need to have basic knowledge in option trading to use this indicator!
This spread is a CREDIT SPREAD.
The indicator shows P&L lines of the options strategy. Use only for futures since the mathematical model of options for Future instruments is different from stocks. Plus, the days' representation in futures is also different from stocks (stocks have fewer days than futures ).
***Each strategy in options is based on different mathematical equations, use this indicator only for the strategy in the headline.***
What does the indicator do?
The indicator is based on the Black-Scholes model, which uses partial differential equations to determine the option pricing. Due to options non-linear behavior, it is hard to visualize the option price. The indicator calculates the solutions of the Black-Scholes equation and plots them on the chart so traders can view how the option pricing will behave.
How the indicator does it?
The indicator uses five values (four dominants and one less dominant) to solve the Black-Scholes equation. The values are stock price, the strike price of the option, time to expiration, risk-free interest rate, and implied volatility .
How the indicator help the users?
-View the risks and rewards so you can know the profit targets in advance which means you can compare different options in different strikes.
-View the volatility change impact so you can know the risk and the P&L changes in case of a change in the volatility over the life of the option before you enter the trade.
-View the passage of time impact so you can know where and when you could realize a profit.
-Multi-timeframes so you can stay on the same chart (Daily and below).
All these features are to help the user improve his analysis while trading options.
How to use it?
The user needs to obtain from the “option chain” the following inputs:
-Credit received: The credit received for one unit of options strategy. Minimum value: 0.00001.
-Instrument price when entered spread: the stock price when you enter the options strategy.
-Upper strike price: the upper strike price of the options strategy.
-Lower strike price: the lower strike price of the options strategy.
- Upper Strike numbers of calls . This number has to be greater than the number of calls that were bought.
- Lower Strike number of calls . This number has to be less than the number of calls that were sold.
-Interest rate: find the risk-free interest rate from the U.S. DEPARTMENT OF THE TREASURY. Example: for 2% interest rate, input: 0.02.
-Days to expire: how many days until the option expires.
-Volatility: the implied volatility of the option bought/sold. Example: for 45% implied volatility , input: 0.45.
-Day of entry: A calendar day of the month that the option bought/sold.
-Month of entry: Calendar month the option bought/sold.
-Year of entry: Calendar year the option bought/sold.
After entering all the inputs, press Ok and you should see “Calculation Complete” on the chart.
The user should not change the entry date and days to expire inputs as time passes after he entered the trade.
How to access the indicator?
Use the link below to obtain access to the indicator

Future Put Bull Spread indicatorFuture Put bull spread indicator developed by Chobotaru Brothers.
You need to have basic knowledge in option trading to use this indicator!
This spread is a CREDIT SPREAD.
The indicator shows P&L lines of the options strategy. Use only for futures since the mathematical model of options for Future instruments is different from stocks. Plus, the days' representation in futures is also different from stocks (stocks have fewer days than futures ).
***Each strategy in options is based on different mathematical equations, use this indicator only for the strategy in the headline.***
What does the indicator do?
The indicator is based on the Black-Scholes model, which uses partial differential equations to determine the option pricing. Due to options non-linear behavior, it is hard to visualize the option price. The indicator calculates the solutions of the Black-Scholes equation and plots them on the chart so traders can view how the option pricing will behave.
How the indicator does it?
The indicator uses five values (four dominants and one less dominant) to solve the Black-Scholes equation. The values are stock price, the strike price of the option, time to expiration, risk-free interest rate, and implied volatility .
How the indicator help the users?
-View the risks and rewards so you can know the profit targets in advance which means you can compare different options in different strikes.
-View the volatility change impact so you can know the risk and the P&L changes in case of a change in the volatility over the life of the option before you enter the trade.
-View the passage of time impact so you can know where and when you could realize a profit.
-Multi-timeframes so you can stay on the same chart (Daily and below).
All these features are to help the user improve his analysis while trading options.
How to use it?
The user needs to obtain from the “option chain” the following inputs:
- Put spread price (Credit): The credit received for one unit of options strategy.
-Instrument price when entered spread: the stock price when you enter the options strategy.
-Upper strike price: the upper strike price of the options strategy.
-Lower strike price: the lower strike price of the options strategy.
-Interest rate: find the risk-free interest rate from the U.S. DEPARTMENT OF THE TREASURY. Example: for 2% interest rate, input: 0.02.
-Days to expire: how many days until the option expires.
-Volatility: the implied volatility of the option bought/sold. Example: for 45% implied volatility , input: 0.45.
-Day of entry: A calendar day of the month that the option bought/sold.
-Month of entry: Calendar month the option bought/sold.
-Year of entry: Calendar year the option bought/sold.
-% of Max Profit/Loss: Profit/loss line defined by the user. Minimum input (-0.95) ; maximum input (0.95).
Example: In this spread, -0.95 means, 95% of the options strategy maximum loss is reached and, 0.95 means, 95% of the options strategy maximum profit is reached.
After entering all the inputs, press Ok and you should see “Calculation Complete” on the chart.
The user should not change the entry date and days to expire inputs as time passes after he entered the trade.
How to access the indicator?
Use the link below to obtain access to the indicator
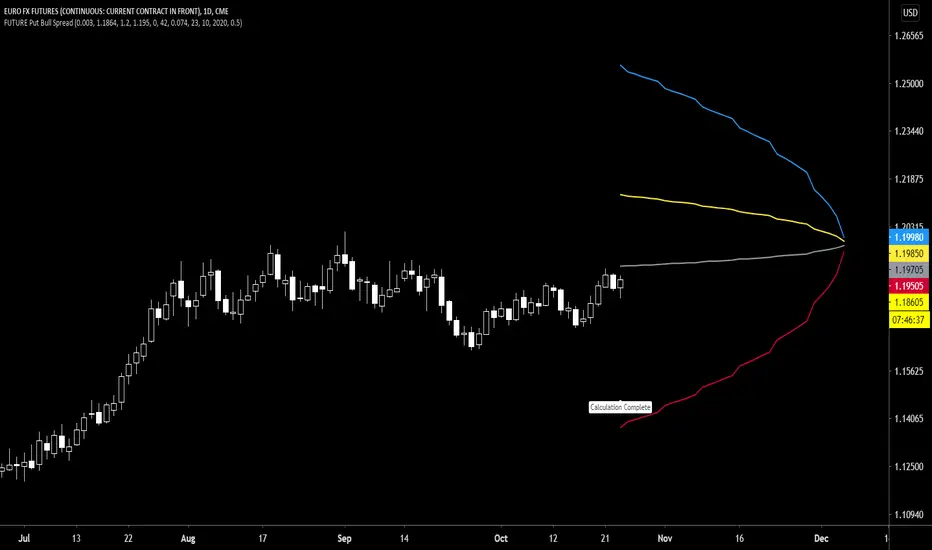
Future Put bear spread indicatorFuture Put bear spread indicator developed by Chobotaru Brothers.
You need to have basic knowledge in option trading to use this indicator!
This spread is a DEBIT SPREAD.
The indicator shows P&L lines of the options strategy. Use only for futures since the mathematical model of options for Future instruments is different from stocks. Plus, the days' representation in futures is also different from stocks (stocks have fewer days than futures ).
***Each strategy in options is based on different mathematical equations, use this indicator only for the strategy in the headline.***
What does the indicator do?
The indicator is based on the Black-Scholes model, which uses partial differential equations to determine the option pricing. Due to options non-linear behavior, it is hard to visualize the option price. The indicator calculates the solutions of the Black-Scholes equation and plots them on the chart so traders can view how the option pricing will behave.
How the indicator does it?
The indicator uses five values (four dominants and one less dominant) to solve the Black-Scholes equation. The values are stock price, the strike price of the option, time to expiration, risk-free interest rate, and implied volatility .
How the indicator help the users?
-View the risks and rewards so you can know the profit targets in advance which means you can compare different options in different strikes.
-View the volatility change impact so you can know the risk and the P&L changes in case of a change in the volatility over the life of the option before you enter the trade.
-View the passage of time impact so you can know where and when you could realize a profit.
-Multi-timeframes so you can stay on the same chart (Daily and below).
All these features are to help the user improve his analysis while trading options.
How to use it?
The user needs to obtain from the “option chain” the following inputs:
- Put spread price (Debit): The debit paid for one unit of options strategy.
-Instrument price when entered spread: the stock price when you enter the options strategy.
-Upper strike price: the upper strike price of the options strategy.
-Lower strike price: the lower strike price of the options strategy.
-Interest rate: find the risk-free interest rate from the U.S. DEPARTMENT OF THE TREASURY. Example: for 2% interest rate, input: 0.02.
-Days to expire: how many days until the option expires.
-Volatility: the implied volatility of the option bought/sold. Example: for 45% implied volatility , input: 0.45.
-Day of entry: A calendar day of the month that the option bought/sold.
-Month of entry: Calendar month the option bought/sold.
-Year of entry: Calendar year the option bought/sold.
-% of Max Profit/Loss: Profit/loss line defined by the user. Minimum input (-0.95) ; maximum input (0.95).
Example: In this spread, -0.95 means, 95% of the options strategy maximum loss is reached and, 0.95 means, 95% of the options strategy maximum profit is reached.
After entering all the inputs, press Ok and you should see “Calculation Complete” on the chart.
The user should not change the entry date and days to expire inputs as time passes after he entered the trade.
How to access the indicator?
Use the link below to obtain access to the indicator

Future Iron Condor / Butterfly buy or sell indicatorFuture Iron Condor / butterfly indicator developed by Chobotaru Brothers.
You need to have basic knowledge in option trading to use this indicator!
The indicator shows P&L lines of the options strategy. Use only for futures since the mathematical model of options for Future instruments is different from stocks. Plus, the days' representation in futures is also different from stocks (stocks have fewer days than futures ).
***Each strategy in options is based on different mathematical equations, use this indicator only for the strategy in the headline.***
What does the indicator do?
The indicator is based on the Black-Scholes model, which uses partial differential equations to determine the option pricing. Due to options non-linear behavior, it is hard to visualize the option price. The indicator calculates the solutions of the Black-Scholes equation and plots them on the chart so traders can view how the option pricing will behave.
How the indicator does it?
The indicator uses five values (four dominants and one less dominant) to solve the Black-Scholes equation. The values are stock price, the strike price of the option, time to expiration, risk-free interest rate, and implied volatility .
How the indicator help the users?
-View the risks and rewards so you can know the profit targets in advance which means you can compare different options in different strikes.
-View the volatility change impact so you can know the risk and the P&L changes in case of a change in the volatility over the life of the option before you enter the trade.
-View the passage of time impact so you can know where and when you could realize a profit.
-Multi-timeframes so you can stay on the same chart (Daily and below).
All these features are to help the user improve his analysis while trading options.
How to use it?
The user needs to obtain from the “option chain” the following inputs:
-Buy or sell (the strategy)
- Iron Condor price bought/sold: enter the price that you bought/sold one options strategy.
-Instrument price when bought/sold: the stock price when you bought/sold the options strategy.
-Upper strike price Top: the top upper strike price of the options strategy.
-Lower strike price Top: the top lower strike price of the options strategy.
-Upper strike price Bottom: the bottom upper strike price of the options strategy.
-Lower strike price Bottom: the bottom lower strike price of the options strategy.
-Interest rate: find the risk-free interest rate from the U.S. DEPARTMENT OF THE TREASURY. Example: for 2% interest rate, input: 0.02.
-Days to expire: how many days until the option expires.
-Volatility: the implied volatility of the option bought/sold. Example: for 45% implied volatility , input: 0.45.
-Day of entry: A calendar day of the month that the option bought/sold.
-Month of entry: Calendar month the option bought/sold.
-Year of entry: Calendar year the option bought/sold.
-% of Profit/Loss: Profit/loss line defined by the user. Minimum input (-0.95) ; maximum input (0.95).
Example: If the strategy was bought, -0.95 means, 95% of the options strategy maximum loss is reached. : If the strategy was bought, 0.95 means, 95% of the options strategy maximum profit is reached.
After entering all the inputs, press Ok and you should see “Calculation Complete” on the chart.
The user should not change the entry date and days to expire inputs as time passes after he entered the trade.
How to access the indicator?
Use the link below to obtain access to the indicator

Future Straddle / Strangle buy or sell indicatorFuture Straddle / strangle buy or sell indicator developed by Chobotaru Brothers.
You need to have basic knowledge in option trading to use this indicator!
The indicator shows P&L lines of the options strategy. Use only for futures since the mathematical model of options for Future instruments is different from stocks. Plus, the days' representation in futures is also different from stocks (stocks have fewer days than futures ).
***Each strategy in options is based on different mathematical equations, use this indicator only for the strategy in the headline.***
What does the indicator do?
The indicator is based on the Black-Scholes model, which uses partial differential equations to determine the option pricing. Due to options non-linear behavior, it is hard to visualize the option price. The indicator calculates the solutions of the Black-Scholes equation and plots them on the chart so traders can view how the option pricing will behave.
How the indicator does it?
The indicator uses five values (four dominants and one less dominant) to solve the Black-Scholes equation. The values are stock price, the strike price of the option, time to expiration, risk-free interest rate, and implied volatility .
How the indicator help the users?
-View the risks and rewards so you can know the profit targets in advance which means you can compare different options in different strikes.
-View the volatility change impact so you can know the risk and the P&L changes in case of a change in the volatility over the life of the option before you enter the trade.
-View the passage of time impact so you can know where and when you could realize a profit.
-Multi-timeframes so you can stay on the same chart (Daily and below).
All these features are to help the user improve his analysis while trading options.
How to use it?
The user needs to obtain from the “option chain” the following inputs:
-Buy or sell (the strategy)
- Straddle/strangle price bought/sold: enter the price that you bought/sold one options strategy.
-Instrument price when bought/sold: the stock price when you bought/sold the options strategy.
-Upper strike price: the upper strike price of the options strategy.
-Lower strike price: the lower strike price of the options strategy.
-Interest rate: find the risk-free interest rate from the U.S. DEPARTMENT OF THE TREASURY. Example: for 2% interest rate, input: 0.02.
-Days to expire: how many days until the option expires.
-Volatility: the implied volatility of the option bought/sold. Example: for 45% implied volatility , input: 0.45.
-Day of entry: A calendar day of the month that the option bought/sold.
-Month of entry: Calendar month the option bought/sold.
-Year of entry: Calendar year the option bought/sold.
-Risk to reward: Profit/loss line defined by the user. Minimum input (-0.95) ; maximum input (3).
Example: If the strategy was bought, -0.95 means, 95% of the options strategy value is lost (unrealized). If the strategy was bought, 3 means, the risk to reward is 3.
After entering all the inputs, press Ok and you should see “Calculation Complete” on the chart.
The user should not change the entry date and days to expire inputs as time passes after he entered the trade.
How to access the indicator?
Use the link below to obtain access to the indicator
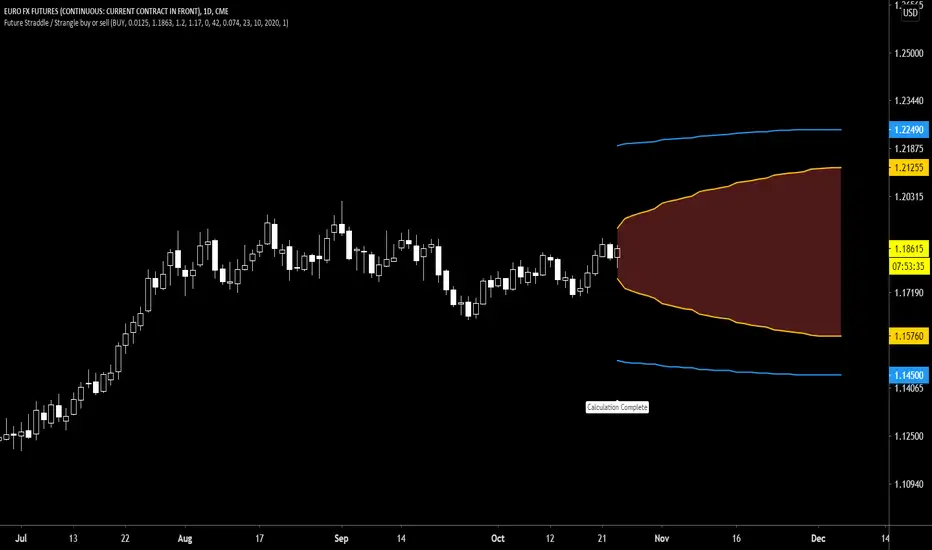
Future Call Bear Spread indicatorFuture Call bear spread indicator developed by Chobotaru Brothers.
You need to have basic knowledge in option trading to use this indicator!
This spread is a CREDIT SPREAD.
The indicator shows P&L lines of the options strategy. Use only for futures since the mathematical model of options for Future instruments is different from stocks. Plus, the days' representation in futures is also different from stocks (stocks have fewer days than futures ).
***Each strategy in options is based on different mathematical equations, use this indicator only for the strategy in the headline.***
What does the indicator do?
The indicator is based on the Black-Scholes model, which uses partial differential equations to determine the option pricing. Due to options non-linear behavior, it is hard to visualize the option price. The indicator calculates the solutions of the Black-Scholes equation and plots them on the chart so traders can view how the option pricing will behave.
How the indicator does it?
The indicator uses five values (four dominants and one less dominant) to solve the Black-Scholes equation. The values are stock price, the strike price of the option, time to expiration, risk-free interest rate, and implied volatility .
How the indicator help the users?
-View the risks and rewards so you can know the profit targets in advance which means you can compare different options in different strikes.
-View the volatility change impact so you can know the risk and the P&L changes in case of a change in the volatility over the life of the option before you enter the trade.
-View the passage of time impact so you can know where and when you could realize a profit.
-Multi-timeframes so you can stay on the same chart (Daily and below).
All these features are to help the user improve his analysis while trading options.
How to use it?
The user needs to obtain from the “option chain” the following inputs:
- Call spread price (Credit): The credit received for one unit of options strategy.
-Instrument price when entered spread: the stock price when you enter the options strategy.
-Upper strike price: the upper strike price of the options strategy.
-Lower strike price: the lower strike price of the options strategy.
-Interest rate: find the risk-free interest rate from the U.S. DEPARTMENT OF THE TREASURY. Example: for 2% interest rate, input: 0.02.
-Days to expire: how many days until the option expires.
-Volatility: the implied volatility of the option bought/sold. Example: for 45% implied volatility , input: 0.45.
-Day of entry: A calendar day of the month that the option bought/sold.
-Month of entry: Calendar month the option bought/sold.
-Year of entry: Calendar year the option bought/sold.
-% of Max Profit/Loss: Profit/loss line defined by the user. Minimum input (-0.95) ; maximum input (0.95).
Example: In this spread, -0.95 means, 95% of the options strategy maximum loss is reached and, 0.95 means, 95% of the options strategy maximum profit is reached.
After entering all the inputs, press Ok and you should see “Calculation Complete” on the chart.
The user should not change the entry date and days to expire inputs as time passes after he entered the trade.
How to access the indicator?
Use the link below to obtain access to the indicator
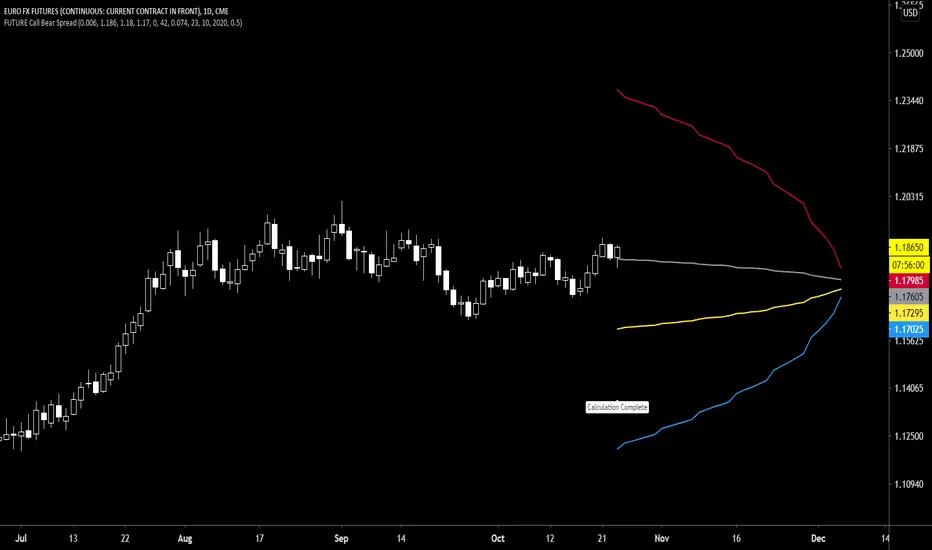
Future Call bull spread indicatorFuture Call bull spread indicator developed by Chobotaru Brothers.
You need to have basic knowledge in option trading to use this indicator!
This spread is a DEBIT SPREAD.
The indicator shows P&L lines of the options strategy. Use only for futures since the mathematical model of options for Future instruments is different from stocks. Plus, the days' representation in futures is also different from stocks (stocks have fewer days than futures ).
***Each strategy in options is based on different mathematical equations, use this indicator only for the strategy in the headline.***
What does the indicator do?
The indicator is based on the Black-Scholes model, which uses partial differential equations to determine the option pricing. Due to options non-linear behavior, it is hard to visualize the option price. The indicator calculates the solutions of the Black-Scholes equation and plots them on the chart so traders can view how the option pricing will behave.
How the indicator does it?
The indicator uses five values (four dominants and one less dominant) to solve the Black-Scholes equation. The values are stock price, the strike price of the option, time to expiration, risk-free interest rate, and implied volatility .
How the indicator help the users?
-View the risks and rewards so you can know the profit targets in advance which means you can compare different options in different strikes.
-View the volatility change impact so you can know the risk and the P&L changes in case of a change in the volatility over the life of the option before you enter the trade.
-View the passage of time impact so you can know where and when you could realize a profit.
-Multi-timeframes so you can stay on the same chart (Daily and below).
All these features are to help the user improve his analysis while trading options.
How to use it?
The user needs to obtain from the “option chain” the following inputs:
- Call spread price (Debit): The debit paid for one unit of options strategy.
-Instrument price when entered spread: the stock price when you enter the options strategy.
-Upper strike price: the upper strike price of the options strategy.
-Lower strike price: the lower strike price of the options strategy.
-Interest rate: find the risk-free interest rate from the U.S. DEPARTMENT OF THE TREASURY. Example: for 2% interest rate, input: 0.02.
-Days to expire: how many days until the option expires.
-Volatility: the implied volatility of the option bought/sold. Example: for 45% implied volatility , input: 0.45.
-Day of entry: A calendar day of the month that the option bought/sold.
-Month of entry: Calendar month the option bought/sold.
-Year of entry: Calendar year the option bought/sold.
-% of Max Profit/Loss: Profit/loss line defined by the user. Minimum input (-0.95) ; maximum input (0.95).
Example: In this spread, -0.95 means, 95% of the options strategy maximum loss is reached and, 0.95 means, 95% of the options strategy maximum profit is reached.
After entering all the inputs, press Ok and you should see “Calculation Complete” on the chart.
The user should not change the entry date and days to expire inputs as time passes after he entered the trade.
How to access the indicator?
Use the link below to obtain access to the indicator

Future Put option buy or sell indicatorFuture Put option indicator developed by Chobotaru Brothers.
You need to have basic knowledge in option trading to use this indicator!
The indicator shows P&L lines of the options strategy. Use only for futures since the mathematical model of options for Future instruments is different from stocks. Plus, the days' representation in futures is also different from stocks (stocks have fewer days than futures ).
***Each strategy in options is based on different mathematical equations, use this indicator only for the strategy in the headline.***
What does the indicator do?
The indicator is based on the Black-Scholes model, which uses partial differential equations to determine the option pricing. Due to options non-linear behavior, it is hard to visualize the option price. The indicator calculates the solutions of the Black-Scholes equation and plots them on the chart so traders can view how the option pricing will behave.
How the indicator does it?
The indicator uses five values (four dominants and one less dominant) to solve the Black-Scholes equation. The values are stock price, the strike price of the option, time to expiration, risk-free interest rate, and implied volatility .
How the indicator help the users?
-View the risks and rewards so you can know the profit targets in advance which means you can compare different options in different strikes.
-View the volatility change impact so you can know the risk and the P&L changes in case of a change in the volatility over the life of the option before you enter the trade.
-View the passage of time impact so you can know where and when you could realize a profit.
-Multi-timeframes so you can stay on the same chart (Daily and below).
All these features are to help the user improve his analysis while trading options.
How to use it?
The user needs to obtain from the “option chain” the following inputs:
-Buy or sell (the strategy)
-The option price bought: at what price did you bought/sold one option.
-Instrument price when bought: the stock price when you bought/sold the option.
-Strike price: the strike price of the option.
-Interest rate: find the risk-free interest rate from the U.S. DEPARTMENT OF THE TREASURY. Example: for 2% interest rate, input: 0.02.
-Days to expire: how many days until the option expires.
-Volatility: the implied volatility of the option bought/sold. Example: for 45% implied volatility , input: 0.45.
-Day of entry: A calendar day of the month that the option bought/sold.
-Month of entry: Calendar month the option bought/sold.
-Year of entry: Calendar year the option bought/sold.
-Risk to reward: Profit/loss line defined by the user. Minimum input (-0.95) ; maximum input (3).
Example: If an option was bought, -0.95 means, 95% of the option value is lost (unrealized). If an option was bought, 3 means, the risk to reward is 3.
After entering all the inputs, press Ok and you should see “Calculation Complete” on the chart.
The user should not change the entry date and days to expire inputs as time passes after he entered the trade.
How to access the indicator?
Use the link below to obtain access to the indicator
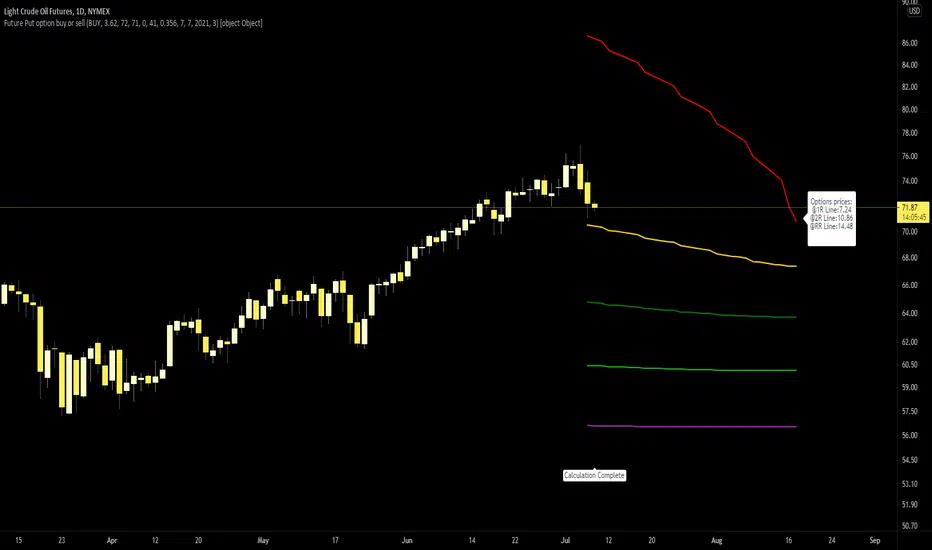
Future Call option buy or sell indicatorFuture Call option indicator developed by Chobotaru Brothers.
You need to have basic knowledge in option trading to use this indicator!
The indicator shows P&L lines of the options strategy. Use only for futures since the mathematical model of options for Future instruments is different from stocks. Plus, the days' representation in futures is also different from stocks (stocks have fewer days than futures ).
***Each strategy in options is based on different mathematical equations, use this indicator only for the strategy in the headline.***
What does the indicator do?
The indicator is based on the Black-Scholes model, which uses partial differential equations to determine the option pricing. Due to options non-linear behavior, it is hard to visualize the option price. The indicator calculates the solutions of the Black-Scholes equation and plots them on the chart so traders can view how the option pricing will behave.
How the indicator does it?
The indicator uses five values (four dominants and one less dominant) to solve the Black-Scholes equation. The values are stock price, the strike price of the option, time to expiration, risk-free interest rate, and implied volatility .
How the indicator help the users?
-View the risks and rewards so you can know the profit targets in advance which means you can compare different options in different strikes.
-View the volatility change impact so you can know the risk and the P&L changes in case of a change in the volatility over the life of the option before you enter the trade.
-View the passage of time impact so you can know where and when you could realize a profit.
-Multi-timeframes so you can stay on the same chart (Daily and below).
All these features are to help the user improve his analysis while trading options.
How to use it?
The user needs to obtain from the “option chain” the following inputs:
-Buy or sell (the strategy)
-The option price bought: at what price did you bought/sold one option.
-Instrument price when bought: the stock price when you bought/sold the option.
-Strike price: the strike price of the option.
-Interest rate: find the risk-free interest rate from the U.S. DEPARTMENT OF THE TREASURY. Example: for 2% interest rate, input: 0.02.
-Days to expire: how many days until the option expires.
-Volatility: the implied volatility of the option bought/sold. Example: for 45% implied volatility , input: 0.45.
-Day of entry: A calendar day of the month that the option bought/sold.
-Month of entry: Calendar month the option bought/sold.
-Year of entry: Calendar year the option bought/sold.
-Risk to reward: Profit/loss line defined by the user. Minimum input (-0.95) ; maximum input (3).
Example: If an option was bought, -0.95 means, 95% of the option value is lost (unrealized). If an option was bought, 3 means, the risk to reward is 3.
After entering all the inputs, press Ok and you should see “Calculation Complete” on the chart.
The user should not change the entry date and days to expire inputs as time passes after he entered the trade.
How to access the indicator?
Use the link below to obtain access to the indicator

Put ratio spread Debit indicatorPut ratio spread debit indicator developed by Chobotaru Brothers.
You need to have basic knowledge in option trading to use this indicator!
This spread is a DEBIT SPREAD.
The indicator shows P&L lines of the options strategy. Use only for stocks since the mathematical model of options for Future instruments is different from stocks. Plus, the days' representation in futures is also different from stocks (stocks have fewer days than futures ).
***Each strategy in options is based on different mathematical equations, use this indicator only for the strategy in the headline.***
What does the indicator do?
The indicator is based on the Black-Scholes model, which uses partial differential equations to determine the option pricing. Due to options non-linear behavior, it is hard to visualize the option price. The indicator calculates the solutions of the Black-Scholes equation and plots them on the chart so traders can view how the option pricing will behave.
How the indicator does it?
The indicator uses five values (four dominants and one less dominant) to solve the Black-Scholes equation. The values are stock price, the strike price of the option, time to expiration, risk-free interest rate, and implied volatility .
How the indicator help the users?
-View the risks and rewards so you can know the profit targets in advance which means you can compare different options in different strikes.
-View the volatility change impact so you can know the risk and the P&L changes in case of a change in the volatility over the life of the option before you enter the trade.
-View the passage of time impact so you can know where and when you could realize a profit.
-Multi-timeframes so you can stay on the same chart (Daily and below).
All these features are to help the user improve his analysis while trading options.
How to use it?
The user needs to obtain from the “option chain” the following inputs:
-Debit paid: The debit paid for one unit of options strategy. Minimum value: 0. 01 .
-Instrument price when entered spread: the stock price when you enter the options strategy.
-Upper strike price: the upper strike price of the options strategy.
-Lower strike price: the lower strike price of the options strategy.
- Upper Strike numbers of puts . This number has to be less than the number of puts that were sold.
- Lower Strike number of puts . This number has to be greater than the number of puts that were bought.
-Interest rate: find the risk-free interest rate from the U.S. DEPARTMENT OF THE TREASURY. Example: for 2% interest rate, input: 0.02.
-Days to expire: how many days until the option expires.
-Volatility: the implied volatility of the option bought/sold. Example: for 45% implied volatility , input: 0.45.
-Day of entry: A calendar day of the month that the option bought/sold.
-Month of entry: Calendar month the option bought/sold.
-Year of entry: Calendar year the option bought/sold.
After entering all the inputs, press Ok and you should see “Calculation Complete” on the chart.
The user should not change the entry date and days to expire inputs as time passes after he entered the trade.
How to access the indicator?
Use the link below to obtain access to the indicator
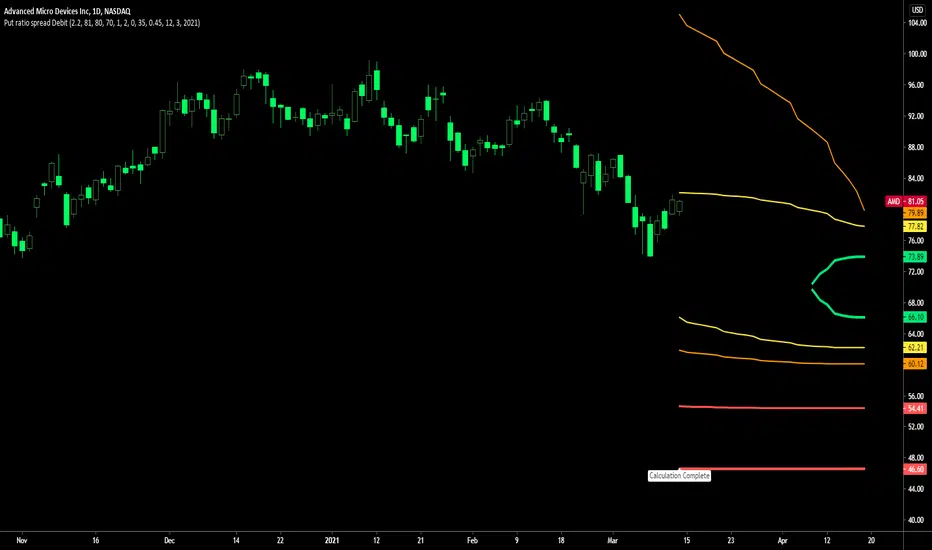
Put ratio spread Credit indicatorPut ratio spread credit indicator developed by Chobotaru Brothers.
You need to have basic knowledge in option trading to use this indicator!
This spread is a CREDIT SPREAD.
The indicator shows P&L lines of the options strategy. Use only for stocks since the mathematical model of options for Future instruments is different from stocks. Plus, the days' representation in futures is also different from stocks (stocks have fewer days than futures ).
***Each strategy in options is based on different mathematical equations, use this indicator only for the strategy in the headline.***
What does the indicator do?
The indicator is based on the Black-Scholes model, which uses partial differential equations to determine the option pricing. Due to options non-linear behavior, it is hard to visualize the option price. The indicator calculates the solutions of the Black-Scholes equation and plots them on the chart so traders can view how the option pricing will behave.
How the indicator does it?
The indicator uses five values (four dominants and one less dominant) to solve the Black-Scholes equation. The values are stock price, the strike price of the option, time to expiration, risk-free interest rate, and implied volatility .
How the indicator help the users?
-View the risks and rewards so you can know the profit targets in advance which means you can compare different options in different strikes.
-View the volatility change impact so you can know the risk and the P&L changes in case of a change in the volatility over the life of the option before you enter the trade.
-View the passage of time impact so you can know where and when you could realize a profit.
-Multi-timeframes so you can stay on the same chart (Daily and below).
All these features are to help the user improve his analysis while trading options.
How to use it?
The user needs to obtain from the “option chain” the following inputs:
-Credit received: The credit received for one unit of options strategy. Minimum value: 0. 01 .
-Instrument price when entered spread: the stock price when you enter the options strategy.
-Upper strike price: the upper strike price of the options strategy.
-Lower strike price: the lower strike price of the options strategy.
- Upper Strike numbers of puts . This number has to be less than the number of puts that were sold.
- Lower Strike number of puts . This number has to be greater than the number of puts that were bought.
-Interest rate: find the risk-free interest rate from the U.S. DEPARTMENT OF THE TREASURY. Example: for 2% interest rate, input: 0.02.
-Days to expire: how many days until the option expires.
-Volatility: the implied volatility of the option bought/sold. Example: for 45% implied volatility , input: 0.45.
-Day of entry: A calendar day of the month that the option bought/sold.
-Month of entry: Calendar month the option bought/sold.
-Year of entry: Calendar year the option bought/sold.
After entering all the inputs, press Ok and you should see “Calculation Complete” on the chart.
The user should not change the entry date and days to expire inputs as time passes after he entered the trade.
How to access the indicator?
Use the link below to obtain access to the indicator
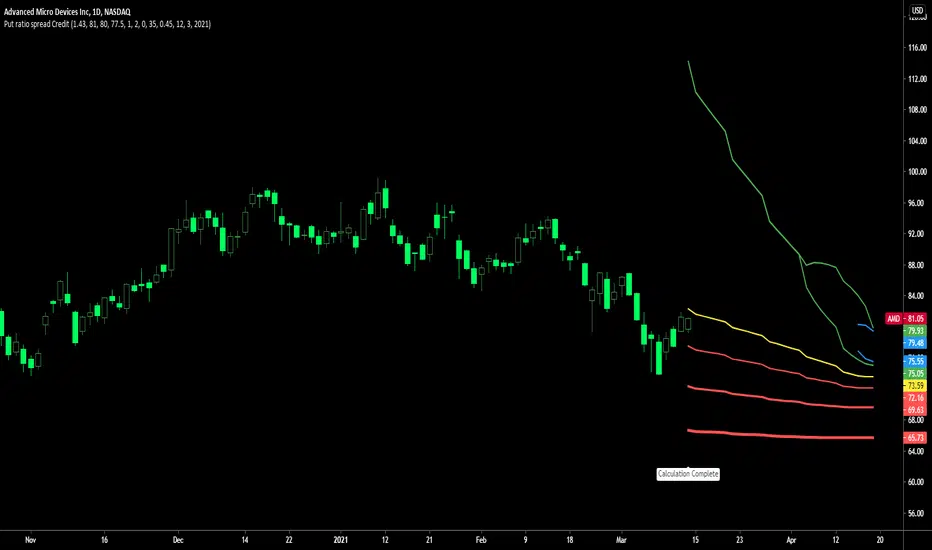
Call ratio spread debit indicatorCall ratio spread debit indicator developed by Chobotaru Brothers.
You need to have basic knowledge in option trading to use this indicator!
This spread is a DEBIT SPREAD.
The indicator shows P&L lines of the options strategy. Use only for stocks since the mathematical model of options for Future instruments is different from stocks. Plus, the days' representation in futures is also different from stocks (stocks have fewer days than futures ).
***Each strategy in options is based on different mathematical equations, use this indicator only for the strategy in the headline.***
What does the indicator do?
The indicator is based on the Black-Scholes model, which uses partial differential equations to determine the option pricing. Due to options non-linear behavior, it is hard to visualize the option price. The indicator calculates the solutions of the Black-Scholes equation and plots them on the chart so traders can view how the option pricing will behave.
How the indicator does it?
The indicator uses five values (four dominants and one less dominant) to solve the Black-Scholes equation. The values are stock price, the strike price of the option, time to expiration, risk-free interest rate, and implied volatility .
How the indicator help the users?
-View the risks and rewards so you can know the profit targets in advance which means you can compare different options in different strikes.
-View the volatility change impact so you can know the risk and the P&L changes in case of a change in the volatility over the life of the option before you enter the trade.
-View the passage of time impact so you can know where and when you could realize a profit.
-Multi-timeframes so you can stay on the same chart (Daily and below).
All these features are to help the user improve his analysis while trading options.
How to use it?
The user needs to obtain from the “option chain” the following inputs:
-Debit paid: The debit paid for one unit of options strategy. Minimum value: 0. 01 .
-Instrument price when entered spread: the stock price when you enter the options strategy.
-Upper strike price: the upper strike price of the options strategy.
-Lower strike price: the lower strike price of the options strategy.
- Upper Strike numbers of calls . This number has to be greater than the number of calls that were bought.
- Lower Strike number of calls . This number has to be less than the number of calls that were sold.
-Interest rate: find the risk-free interest rate from the U.S. DEPARTMENT OF THE TREASURY. Example: for 2% interest rate, input: 0.02.
-Days to expire: how many days until the option expires.
-Volatility: the implied volatility of the option bought/sold. Example: for 45% implied volatility , input: 0.45.
-Day of entry: A calendar day of the month that the option bought/sold.
-Month of entry: Calendar month the option bought/sold.
-Year of entry: Calendar year the option bought/sold.
After entering all the inputs, press Ok and you should see “Calculation Complete” on the chart.
The user should not change the entry date and days to expire inputs as time passes after he entered the trade.
How to access the indicator?
Use the link below to obtain access to the indicator

Call ratio spread Credit indicatorCall ratio spread credit indicator developed by Chobotaru Brothers.
You need to have basic knowledge in option trading to use this indicator!
This spread is a CREDIT SPREAD.
The indicator shows P&L lines of the options strategy. Use only for stocks since the mathematical model of options for Future instruments is different from stocks. Plus, the days' representation in futures is also different from stocks (stocks have fewer days than futures ).
***Each strategy in options is based on different mathematical equations, use this indicator only for the strategy in the headline.***
What does the indicator do?
The indicator is based on the Black-Scholes model, which uses partial differential equations to determine the option pricing. Due to options non-linear behavior, it is hard to visualize the option price. The indicator calculates the solutions of the Black-Scholes equation and plots them on the chart so traders can view how the option pricing will behave.
How the indicator does it?
The indicator uses five values (four dominants and one less dominant) to solve the Black-Scholes equation. The values are stock price, the strike price of the option, time to expiration, risk-free interest rate, and implied volatility .
How the indicator help the users?
-View the risks and rewards so you can know the profit targets in advance which means you can compare different options in different strikes.
-View the volatility change impact so you can know the risk and the P&L changes in case of a change in the volatility over the life of the option before you enter the trade.
-View the passage of time impact so you can know where and when you could realize a profit.
-Multi-timeframes so you can stay on the same chart (Daily and below).
All these features are to help the user improve his analysis while trading options.
How to use it?
The user needs to obtain from the “option chain” the following inputs:
-Credit received: The credit received for one unit of options strategy. Minimum value: 0. 01 .
-Instrument price when entered spread: the stock price when you enter the options strategy.
-Upper strike price: the upper strike price of the options strategy.
-Lower strike price: the lower strike price of the options strategy.
- Upper Strike numbers of calls . This number has to be greater than the number of calls that were bought.
- Lower Strike number of calls . This number has to be less than the number of calls that were sold.
-Interest rate: find the risk-free interest rate from the U.S. DEPARTMENT OF THE TREASURY. Example: for 2% interest rate, input: 0.02.
-Days to expire: how many days until the option expires.
-Volatility: the implied volatility of the option bought/sold. Example: for 45% implied volatility , input: 0.45.
-Day of entry: A calendar day of the month that the option bought/sold.
-Month of entry: Calendar month the option bought/sold.
-Year of entry: Calendar year the option bought/sold.
After entering all the inputs, press Ok and you should see “Calculation Complete” on the chart.
The user should not change the entry date and days to expire inputs as time passes after he entered the trade.
How to access the indicator?
Use the link below to obtain access to the indicator

Put Bull Spread indicatorPut bull spread indicator developed by Chobotaru Brothers.
You need to have basic knowledge in option trading to use this indicator!
This spread is a CREDIT SPREAD.
The indicator shows P&L lines of the options strategy. Use only for stocks since the mathematical model of options for Future instruments is different from stocks. Plus, the days' representation in futures is also different from stocks (stocks have fewer days than futures ).
***Each strategy in options is based on different mathematical equations, use this indicator only for the strategy in the headline.***
What does the indicator do?
The indicator is based on the Black-Scholes model, which uses partial differential equations to determine the option pricing. Due to options non-linear behavior, it is hard to visualize the option price. The indicator calculates the solutions of the Black-Scholes equation and plots them on the chart so traders can view how the option pricing will behave.
How the indicator does it?
The indicator uses five values (four dominants and one less dominant) to solve the Black-Scholes equation. The values are stock price, the strike price of the option, time to expiration, risk-free interest rate, and implied volatility .
How the indicator help the users?
-View the risks and rewards so you can know the profit targets in advance which means you can compare different options in different strikes.
-View the volatility change impact so you can know the risk and the P&L changes in case of a change in the volatility over the life of the option before you enter the trade.
-View the passage of time impact so you can know where and when you could realize a profit.
-Multi-timeframes so you can stay on the same chart (Daily and below).
All these features are to help the user improve his analysis while trading options.
How to use it?
The user needs to obtain from the “option chain” the following inputs:
- Put spread price (Credit): The credit received for one unit of options strategy.
-Instrument price when entered spread: the stock price when you enter the options strategy.
-Upper strike price: the upper strike price of the options strategy.
-Lower strike price: the lower strike price of the options strategy.
-Interest rate: find the risk-free interest rate from the U.S. DEPARTMENT OF THE TREASURY. Example: for 2% interest rate, input: 0.02.
-Days to expire: how many days until the option expires.
-Volatility: the implied volatility of the option bought/sold. Example: for 45% implied volatility , input: 0.45.
-Day of entry: A calendar day of the month that the option bought/sold.
-Month of entry: Calendar month the option bought/sold.
-Year of entry: Calendar year the option bought/sold.
-% of Max Profit/Loss: Profit/loss line defined by the user. Minimum input (-0.95) ; maximum input (0.95).
Example: In this spread, -0.95 means, 95% of the options strategy maximum loss is reached and, 0.95 means, 95% of the options strategy maximum profit is reached.
After entering all the inputs, press Ok and you should see “Calculation Complete” on the chart.
The user should not change the entry date and days to expire inputs as time passes after he entered the trade.
How to access the indicator?
Use the link below to obtain access to the indicator
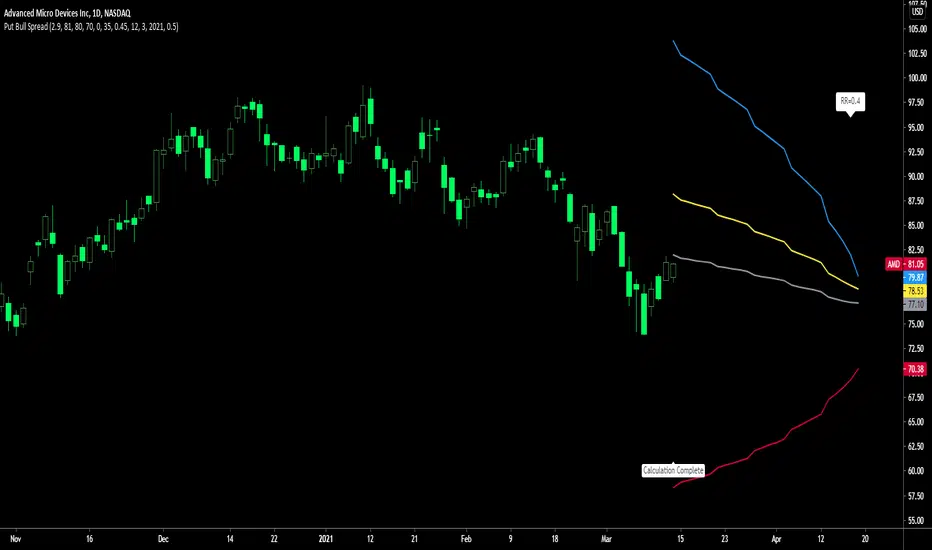
Put Bear Spread indicatorPut bear spread indicator developed by Chobotaru Brothers.
You need to have basic knowledge in option trading to use this indicator!
This spread is a DEBIT SPREAD.
The indicator shows P&L lines of the options strategy. Use only for stocks since the mathematical model of options for Future instruments is different from stocks. Plus, the days' representation in futures is also different from stocks (stocks have fewer days than futures ).
***Each strategy in options is based on different mathematical equations, use this indicator only for the strategy in the headline.***
What does the indicator do?
The indicator is based on the Black-Scholes model, which uses partial differential equations to determine the option pricing. Due to options non-linear behavior, it is hard to visualize the option price. The indicator calculates the solutions of the Black-Scholes equation and plots them on the chart so traders can view how the option pricing will behave.
How the indicator does it?
The indicator uses five values (four dominants and one less dominant) to solve the Black-Scholes equation. The values are stock price, the strike price of the option, time to expiration, risk-free interest rate, and implied volatility .
How the indicator help the users?
-View the risks and rewards so you can know the profit targets in advance which means you can compare different options in different strikes.
-View the volatility change impact so you can know the risk and the P&L changes in case of a change in the volatility over the life of the option before you enter the trade.
-View the passage of time impact so you can know where and when you could realize a profit.
-Multi-timeframes so you can stay on the same chart (Daily and below).
All these features are to help the user improve his analysis while trading options.
How to use it?
The user needs to obtain from the “option chain” the following inputs:
- Put spread price (Debit): The debit paid for one unit of options strategy.
-Instrument price when entered spread: the stock price when you enter the options strategy.
-Upper strike price: the upper strike price of the options strategy.
-Lower strike price: the lower strike price of the options strategy.
-Interest rate: find the risk-free interest rate from the U.S. DEPARTMENT OF THE TREASURY. Example: for 2% interest rate, input: 0.02.
-Days to expire: how many days until the option expires.
-Volatility: the implied volatility of the option bought/sold. Example: for 45% implied volatility , input: 0.45.
-Day of entry: A calendar day of the month that the option bought/sold.
-Month of entry: Calendar month the option bought/sold.
-Year of entry: Calendar year the option bought/sold.
-% of Max Profit/Loss: Profit/loss line defined by the user. Minimum input (-0.95) ; maximum input (0.95).
Example: In this spread, -0.95 means, 95% of the options strategy maximum loss is reached and, 0.95 means, 95% of the options strategy maximum profit is reached.
After entering all the inputs, press Ok and you should see “Calculation Complete” on the chart.
The user should not change the entry date and days to expire inputs as time passes after he entered the trade.
How to access the indicator?
Use the link below to obtain access to the indicator