Market Average TrendThis indicator aims to be complimentary to SPDR Tracker , but I've adjusted the name as I've been able to utilize the "INDEX" data provider to support essentially every US market.
This is a breadth market internal indicator that allows quick review of strength given the 5, 20, 50, 100, 150 and 200 simple moving averages. Each can be toggled to build whatever combinations are desired, I recommend reviewing classic combinations such as 5 & 20 as well as 50 & 200.
It's entirely possible that I've missed some markets that "INDEX" provides data for, if you find any feel free to drop a comment and I'll add support for them in an update.
Markets currently supported:
S&P 100
S&P 500
S&P ENERGIES
S&P INFO TECH
S&P MATERIALS
S&P UTILITIES
S&P FINANCIALS
S&P REAL ESTATE
S&P CON STAPLES
S&P HEALTH CARE
S&P INDUSTRIALS
S&P TELECOM SRVS
S&P CONSUMER DISC
S&P GROWTH
NAS 100
NAS COMP
DOW INDUSTRIAL
DOW COMP
DOW UTILITIES
DOW TRANSPORTATION
RUSSELL 1000
RUSSELL 2000
RUSSELL 3000
You can utilize this to watch stocks for dip buys or potential trend continuation entries, short entries, swing exits or numerous other portfolio management strategies.
If using it with stocks, it's advisable to ensure the stock often follows the index, otherwise obviously it's great to use with major indexes and determine holdings sentiment.
Important!
The "INDEX" data provider only supplies updates to all of the various data feeds at the end of day, I've noticed quite some delays even after market close and not taken time to review their actual update schedule (if even published). Therefore, it's strongly recommended to mostly ignore the last value in the series until it's the day after.
Only works on daily timeframes and above, please don't comment that it's not working if on other timeframes lower than daily :)
Feedback and suggestions are always welcome, enjoy!
"涨幅大于1000的股票"に関するスクリプトを検索

VPQuantLibLibrary "VPQuantLib"
Misc of math, position size and consolidation detection functions that can be used accross various scripts.
isPercentAboveReference(current, percent, reference, or_equal)
Checks if the current value is bigger (or equal) with the provided percent value to the reference
Parameters:
current (float) : - what to check against the reference
percent (float) : - what is the percent to check for difference
reference (float) : - what to compare against
or_equal (bool) : - enables checking for bigger or equal
Returns: true if the current is percent bigger (or equal) to the reference
isPercentBelowReference(current, percent, reference, or_equal)
Checks if the current value is smaller (or equal) with the provided percent value to the reference
Parameters:
current (float) : - what to check against the reference
percent (float) : - what is the percent to check for difference
reference (float) : - what to compare against
or_equal (bool) : - enables checking for smaller or equal
Returns: true if the current is percent smaller (or equal) to the reference
isInRange(current, reference, min_percent, max_percent, below)
Checks if the current value is greater/smaller than the reference value within the provided percent range
Parameters:
current (float) : - what to check for being in range against the refenence
reference (float) : - what to compare against
min_percent (float) : - the min percent range border
max_percent (float) : - the max percent range border
below (bool) : - check if below or above the reference
@return true if the current is bigger/smaller than the reference withing the percent range provided
GetRiskBasedPositionSize(account_balance, equity_risk_perc, max_loss_per_share)
Calculates and returns the positins size based on risk of the equity
Parameters:
account_balance (float) : - total account balance
equity_risk_perc (int) : - percent of equity to risk in the trade
max_loss_per_share (float) : - maximum loss per share (in currency, not in %) that we're willing to loose (calc based on the entry_price-stop_loss_price)
@return number of shares to buy
CheckInRangeConsolidation(consolidation_period, allowed_consolidation_range, ref_high, ref_low, prev_bar_consolidaton, draw_consolidation_lines)
Checks if the current bar is in a consolidation range
Parameters:
consolidation_period (int) : - the number of bars to consider for consolidation range calculation
allowed_consolidation_range (int) : - the percentage range allowed for the current consolidation range to be considered valid
ref_high (float) : - the reference high value to use for consolidation range calculation
ref_low (float) : - the reference low value to use for consolidation range calculation
prev_bar_consolidaton (bool)
draw_consolidation_lines (bool) : - a boolean indicating if consolidation range lines should be drawn on the chart
@return a tuple of three values:
1. _curr_consolidation - a boolean indicating if the current bar is in consolidation range
2. _curr_consolidation_low - the current consolidation low value
3. _curr_consolidation_high - the current consolidation high value
FindBasicConsolidation(loopback_period, consolidation_length, ref_high, ref_low, draw_consolidation_lines)
Finds a basic consolidation areas, looking back 1000 bars to find the pivot of the trend and checks if the current bar is in consolidation area counting the
number of bars that have not broken the consolidation high/low levels
Parameters:
loopback_period (int) : - the number of bars to look back to determine the high/low watermark
consolidation_length (int) : - minimum number of bars required to establish a consolidation period
ref_high (float) : - user input for high (can be based on the bar or wicks)
ref_low (float) : - user input for high (can be based on the bar or wicks)
draw_consolidation_lines (bool) : - enable/disable drawing of the consolidation lines
Returns: _pivot_point - pivot point

Backtesting ModuleDo you often find yourself creating new 'strategy()' scripts for each trading system? Are you unable to focus on generating new systems due to fatigue and time loss incurred in the process? Here's a potential solution: the 'Backtesting Module' :)
INTRODUCTION
Every trading system is based on four basic conditions: long entry, long exit, short entry and short exit (which are typically defined as boolean series in Pine Script).
If you can define the conditions generated by your trading system as a series of integers, it becomes possible to use these variables in different scripts in efficient ways. (Pine Script is a convenient language that allows you to use the integer output of one indicator as a source in another.)
The 'Backtesting Module' is a dynamic strategy script designed to adapt to your signals. It boasts two notable features:
⮞ It produces a backtest report using the entry and exit variables you define.
⮞ It not only serves for system testing but also to combine independent signals into a single system. (This functionality enables to create complex strategies and report on their success!)
The module tests Golden and Death cross signals by default, when you enter your own conditions the default signals will be neutralized. The methodology is described below.
PREPARATION
There are three simple steps to connect your own indicator to the Module.
STEP 1
Firstly, you must define entry and exit variables in your own script. Let's elucidate it with a straightforward example. Consider a system generating long and short signals based on the intersections of two moving averages. Consequently, our conditions would be as follows:
// Signals
long = ta.crossover(ta.sma(close, 14), ta.sma(close, 28))
short = ta.crossunder(ta.sma(close, 14), ta.sma(close, 28))
Now, the question is: How can we convert boolean variables into integer variables? The answer is conditional ternary block, defined as follows:
// Entry & Exit
long_entry = long ? 1 : 0
long_exit = short ? 1 : 0
short_entry = short ? 1 : 0
short_exit = long ? 1 : 0
The mechanics of the Entry & Exit variables are simple. The variable takes on a value of 1 when your trading system generates the signal and if your system does not produce any signal, variable returns 0. In this example, you see how exit signals can be generated in a trading system that only contains entry signals. If you have a system with original exit signals, you can also use them directly. (Please mind the NOTES section below).
STEP 2
To utilize the Entry & Exit variables as source in another script, they must be plotted on the chart. Therefore, the final detail to include in the script containing your trading system would be as follows:
// Plot The Output
plot(long_entry, "Long Entry", display=display.data_window, editable=false)
plot(long_exit, "Long Exit", display=display.data_window, editable=false)
plot(short_entry, "Short Entry", display=display.data_window, editable=false)
plot(short_exit, "Short Exit", display=display.data_window, editable=false)
STEP 3
Now, we are ready to test the system! Load the Backtesting Module indicator onto the chart along with your trading system/indicator. Then set the outputs of your system (Long Entry, Long Exit, Short Entry, Short Exit) as source in the module. That's it.
FEATURES & ORIGINALITY
⮞ Primarily, this script has been created to provide you with an easy and practical method when testing your trading system.
⮞ I thought it might be nice to visualize a few useful results. The Backtesting Module provides insights into the outcomes of both long and short trades by computing the number of trades and the success percentage.
⮞ Through the 'Trade' parameter, users can specify the market direction in which the indicator is permitted to initiate positions.
⮞ Users have the flexibility to define the date range for the test.
⮞ There are optional features allowing users to plot entry prices on the chart and customize bar colors.
⮞ The report and the test date range are presented in a table on the chart screen. The entry price can be monitored in the data window.
⮞ Note that results are based on realized returns, and the open trade is not included in the displayed results. (The only exception is the 'Unrealized PNL' result in the table.)
STRATEGY SETTINGS
The default parameters are as follows:
⮞ Initial Balance : 10000 (in units of currency)
⮞ Quantity : 10% of equity
⮞ Commission : 0.04%
⮞ Slippage : 0
⮞ Dataset : All bars in the chart
For a realistic backtest result, you should size trades to only risk sustainable amounts of equity. Do not risk more than 5-10% on a trade. And ALWAYS configure your commission and slippage parameters according to pessimistic scenarios!
NOTES
⮞ This script is intended solely for development purposes. And it'll will be available for all the indicators I publish.
⮞ In this version of the module, all order types are designed as market orders. The exit size is the sum of the entry size.
⮞ As your trading conditions grow more intricate, you might need to define the outputs of your system in alternative ways. The method outlined in this description is tailored for straightforward signal structures.
⮞ Additionally, depending on the structure of your trading system, the backtest module may require further development. This encompasses stop-loss, take-profit, specific exit orders, quantity, margin and risk management calculations. I am considering releasing improvements that consider these options in future versions.
⮞ An example of how complex trading signals can be generated is the OTT Collection. If you're interested in seeing how the signals are constructed, you can use the link below.
THANKS
Special thanks to PineCoders for their valuable moderation efforts.
I hope this will be a useful example for the TradingView community...
DISCLAIMER
This is just an indicator, nothing more. It is provided for informational and educational purposes exclusively. The utilization of this script does not constitute professional or financial advice. The user solely bears the responsibility for risks associated with script usage. Do not forget to manage your risk. And trade as safely as possible. Best of luck!

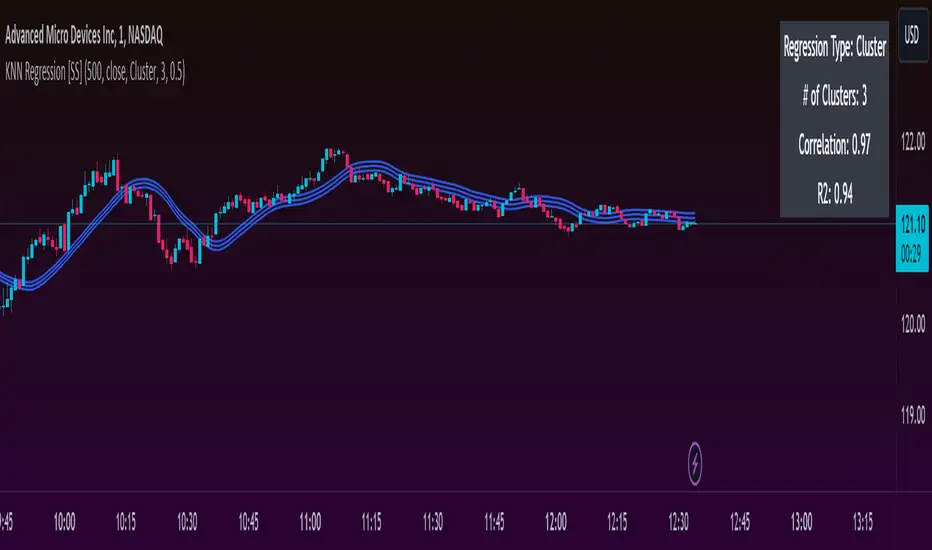
KNN Regression [SS]Another indicator release, I know.
But note, this isn't intended to be a stand-alone indicator, this is just a functional addition for those who program Machine Learning algorithms in Pinescript! There isn't enough content here to merit creating a library for (it's only 1 function), but it's a really useful function for those who like machine learning and Nearest Known Neighbour Algos (or KNN).
About the indicator:
This indicator creates a function to perform KNN-based regression.
In contrast to traditional linear regression, KNN-based regression has the following advantages over linear regression:
Advantages of KNN Regression vs. Linear Regression:
🎯 Non-linearity: KNN is a non-parametric method, meaning it makes no assumptions about the underlying data distribution. This allows it to capture non-linear relationships between features and the target variable.
🎯Simple Implementation: KNN is conceptually simple and easy to understand. It doesn't require the estimation of parameters, making it straightforward to implement.
🎯Robust to Outliers: KNN is less sensitive to outliers compared to linear regression. Outliers can have a significant impact on linear regression models, but KNN tends to be less affected.
Disadvantages of KNN Regression vs. Linear Regression:
🎯 Resource Intensive for Computation: Because KNN operates on identifying the nearest neighbors in a dataset, each new instance has to be searched for and identified within the dataset, vs. linear regression which can create a coefficient-based model and draw from the coefficient for each new data point.
🎯Curse of Dimensionality: KNN performance can degrade with an increasing number of features, leading to a "curse of dimensionality." This is because, in high-dimensional spaces, the concept of proximity becomes less meaningful.
🎯Sensitive to Noise: KNN can be sensitive to noisy data, as it relies on the local neighborhood for predictions. Noisy or irrelevant features may affect its performance.
Which is better?
I am very biased, coming from a statistics background. I will always love linear regression and will always prefer it over KNN. But depending on what you want to accomplish, KNN makes sense. If you are using highly skewed data or data that you cannot identify linearity in, KNN is probably preferable.
However, if you require precise estimations of ranges and outliers, such as creating co-integration models, I would advise sticking with linear regression. However, out of curiosity, I exported the function into a separate dummy indicator and pulled in data from QQQ to predict SPY close, and the results are actually very admirable:
And plotted with showing the standard error variance:
Pretty impressive, I must say I was a little shocked, it's really giving linear regression a run for its money. In school I was taught LinReg is the gold standard for modeling, nothing else compares. So as with most things in trading, this is challenging some biases of mine ;).
Functionality of the function
I have permitted 3 types of KNN regression. Traditional KNN regression, as I understand it, revolves around clustering. ( Clustering refers to identifying a cluster, normally 3, of identical cases and averaging out the Dependent variable in each of those cases) . Clustering is great, but when you are working with a finite dataset, identifying exact matches for 2 or 3 clusters can be challenging when you are only looking back at 500 candles or 1000 candles, etc.
So to accommodate this, I have added a functionality to clustering called "Tolerance". And it allows you to set a tolerance level for your Euclidean distance parameters. As a default, I have tested this with a default of 0.5 and it has worked great and no need to change even when working with large numbers such as NQ and ES1!.
However, I have added 2 additional regression types that can be done with KNN.
#1 One is a regression by the last IDENTICAL instance, which will find the most recent instance of a similar Independent variable and pull the Dependent variable from that instance. Or
#2 Average from all IDENTICAL instances.
Using the function
The code has the instructions for integrating the function into your own code, the parameters, and such, so I won't exhaust you with the boring details about that here.
But essentially, it exports 3, float variables, the Result, the Correlation, and the simplified R2.
As this is KNN regression, there are no coefficients, slopes, or intercepts and you do not need to test for linearity before applying it.
Also, the output can be a bit choppy, so I tend to like to throw in a bit of smoothing using the ta.sma function at a deault of 14.
For example, here is SPY from QQQ smoothed as a 14 SMA:
And it is unsmoothed:
It seems relatively similar but it does make a bit of an aesthetic difference. And if you are doing it over 14, there is no data loss and it is still quite reactive to changes in data.
And that's it! Hopefully you enjoy and find some interesting uses for this function in your own scripts :-).
Safe trades everyone!
OTT CollectionIf you are not yet familiar with OTT, this script could provide an introduction to help you get started.
"Optimized Trend Tracker" (OTT) is an effective trend-following indicator created by Anıl Özekşi . It aims to detect the current trend direction based on an elegant mathematical construct. The key defining characteristic of OTT is its reliance on a trailing-stop mechanism. This enables OTT to identify price movements and follow the price until a reversal occurs. The widespread adoption of OTT in various algo-trading platforms has fostered the development of diverse applications of the indicator over time. Examining its history, eight distinct applications emerge.
1) OTT - Optimized Trend Tracker
2) TOTT - Twin Ott
3) OTT Channel - Half Channel & Fibonacci Channel
4) RISOTTO - Rsi Ott
5) SOTT - Stochastic Ott
6) HOTT & LOTT - Highest-Lowest Ott + Sum Option
7) ROTT - Relative Ott
8) FT - "Fırsatçı" Trend
BONUS: RTR - Relative True Range
Each system functions as an independent indicator and the "OTT Collection" is intended to present all of them in a single script.
ORIGINALITY
Primarily, this script introduces previously unreleased OTT applications on Tradingview (RISOTTO, ROTT, FT). In contrast to previously published examples that treat OTT as a variable, this script portrays OTT as a function, rendering it adaptable for more intricate computations. Consequently, OTT has evolved into a versatile tool capable of facilitating complex analyses. Furthermore, this script offers an innovative feature that permits the blocking of consecutive signals in the same direction, catering to user preferences. (This feature is crucial for all indicators utilizing band structures such as TOTT and HOTT-LOTT).
USAGE
It is simple to use. The settings section of the indicator groups the parameters. In first group, the System parameter allows you to select the OTT system you want to display on the chart. Activating the Pyramiding parameter enables the display of consecutive signals in the same direction (for TOTT and HOTT-LOTT). In the second group you can change the display options with the Barcolor, Signal and Bars parameters. The OTT system you select is configured with the parameters in the group with the corresponding system heading. (For example, suppose you select OTT CHANNEL in the system parameter. The parameters defining the channels are grouped under the heading "OTT CHANNELS" in the settings section.) Also the parameters you chose are displayed in table form on the chart screen. The table also presents the total number of bars on the chart and the number of signals generated by the selected system.
MECHANICS
Let's take a look at how the indicator works. This indicator incorporates eight distinct OTT systems, each characterized by unique parameters, lines, and signals. (Exception: OTT Channel does not include any referenced signals.)
1) WHAT IS "OTT"?
OTT comprises two lines: Support and Target. There's an up-trending market when the Support is superior to the Target, and a down-trending market when the Support is inferior to the Target. It is governed by two parameters. The Support (moving average) is determined by the Length parameter, while the Multiplier parameter is employed for percentage calculations. Lower values are adept at capturing short-term fluctuations, whereas higher values are more adept at identifying long-term trends. These principles apply to all parameters within the indicator.
DETAILED INFO : The OTT function in the script automatically performs the calculation process described in this section. So, if you know how OTT works you can skip the details. To comprehend its functioning, it's essential to grasp the "MOST" indicator, also devised by Anıl Özekşi. The fundamental principle of MOST involves creating bands that function akin to a trailing stop-loss. Initially, a moving average, referred to as the 'Support,' is established. (Anıl Özekşi employs VAR/VIDYA as the moving average type in all his systems.) Subsequently, the Support line is adjusted both upward and downward by a percentage multiplier to establish a band system. In the context of the trailing stop-loss concept, when the Support line approaches either the lower or upper band, the respective band ceases to move in parallel with the Support line and becomes horizontal. Consequently, the Support always intersects the band at some point. The values of the upper or lower bands, determined by this intersection, are referred to as the MOST line. OTT is generated by consolidating the values of MOST shifted upwards and downwards by half the coefficient percentage into a single line using the same method as above, and calculating the value of this line from two bars ago. Support is the data series of OTT and it serves as a source in OTT function. The OTT line is named as "Target" in this scipt. Support and Target will automatically vary according to the OTT application selected in the "System" parameter.
2) WHAT IS "TOTT"?
Twin OTT , also known as the "OTT Band," involves three parameters: Length, Multiplier, and Band Multiplier. It consists of three lines: Support, Upper Line, and Lower Line. OTT is determined by the Length and Multiplier parameters, while TOTT is calculated by adjusting OTT upwards and downwards as per the Band Multiplier parameter. The indicator generates signals based on the intersections of the Support and these two new OTT levels.
3) WHAT IS "OTT CHANNEL"?
Similar to TOTT, the OTT CHANNEL is also based on shifted OTT levels, employing a similar calculation method. The primary distinction lies in the fact that TOTT has a single Band Multiplier, whereas OTT CHANNEL incorporates two line multipliers for the band. It encompasses four parameters: Length, Multiplier, Upper Line Multiplier, and Lower Line Multiplier. OTT is defined by the Length and Multiplier parameters. The Upper Line Multiplier and Lower Line Multiplier parameters establish the channel boundaries by shifting the OTT line. Subsequently, levels are drawn between the upper and lower lines. The additional Channel Type parameter determines which levels are displayed on the chart. The "Half Channel" option draws channels shifted by half the coefficient. The "Fibonacci Channel" option draws channels shifted by 0.382 and 0.618 coefficients. The "Both" option plots all levels.
4) WHAT IS "RISOTTO"?
OTT also has application examples in momentum oscillators. RISOTTO utilizes the RSI indicator and operates with three parameters. The RSI is defined by the Length 1 parameter, while the Support is determined by the Length 2 parameter. The Multiplier parameter is utilized for percentage calculations. RISOTTO comprises two lines: Support and Target. To ensure more stable calculations, a constant (+1000) is added to the oscillator average when applying OTT to momentum oscillators. This approach eradicates nonsensical results stemming from percentage calculations when the oscillator reaches a value of 0. The indicator generates signals based on the intersection of these two lines.
5) WHAT IS "SOTT"?
Stochastic OTT is an another example of application on oscillator. Its working principle is akin to that of RISOTTO. It operates with three parameters. The Stochastic %k is defined by the Length 1 parameter, while the Stochastic %d is determined by the Length 2 parameter. The Multiplier parameter is utilized for percentage calculations. SOTT comprises two lines: Support and Target. The indicator generates signals based on the intersection of these two lines.
6) WHAT IS "HOTT-LOTT"?
OTT can be applied to the highest and lowest series as well. HOTT-LOTT operates with three parameters: Length, Multiplier, and Sum N Bars. The highest and lowest series are defined by the Length parameter. The Multiplier parameter is utilized for percentage calculations. It encompasses two lines: Upper Line and Lower Line, where HOTT employs the highest series and LOTT uses the lowest series. If the 'High' price surpasses HOTT, the indicator generates Long signals. Similarly, if the 'Low' price falls below LOTT, the indicator generates Short signals. When the Sum N Bars option is activated, signals are generated based on the confirmation concept for N bars.
7) WHAT IS "ROTT"?
Relative OTT serves as a valuable tool for long-period filters. ROTT operates with two parameters. The Support is determined by the length parameter and equals twice the moving average. The Multiplier parameter is utilized for percentage calculations. The indicator generates signals based on the intersection of these two lines.
8) WHAT IS "FT"?
"Fırsatçı" (opportunistic) Trend is a system that revolves around two levels, namely major and minor OTT. It operates with three parameters: Length, Major Multiplier, and Minor Multiplier. FT comprises two lines, Support and Target. The indicator generates signals based on the intersection of these two lines.
9) WHAT IS "RTR"?
Relative True Range is not an OTT system; however, it serves as a complementary feature. It does not have any referenced signals. RTR is devised to obtain a normalized result of the current market volatility. It operates with two parameters: ATR, which is determined by the Length 1 parameter, and RTR, defined by the Length 2 parameter.
A TIP
If any indicator is defined in function form instead of the OTT function, the applications can also be adapted for different indicators. E.g. Supertrend, PMAX, AlphaTrend, etc.
UPDATE
Anıl Özekşi is a competent algotrader who shares his work with open sources. I will update the indicator as new applications are released.
DISCLEIMER
This is just an indicator, nothing more. The script is for informational and educational purposes only. The use of the script does not constitute professional and/or financial advice. The responsibility for risks associated with the use of the script is solely owned by the user. Do not forget to manage your risk. And trade as safely as possible. Good luck!

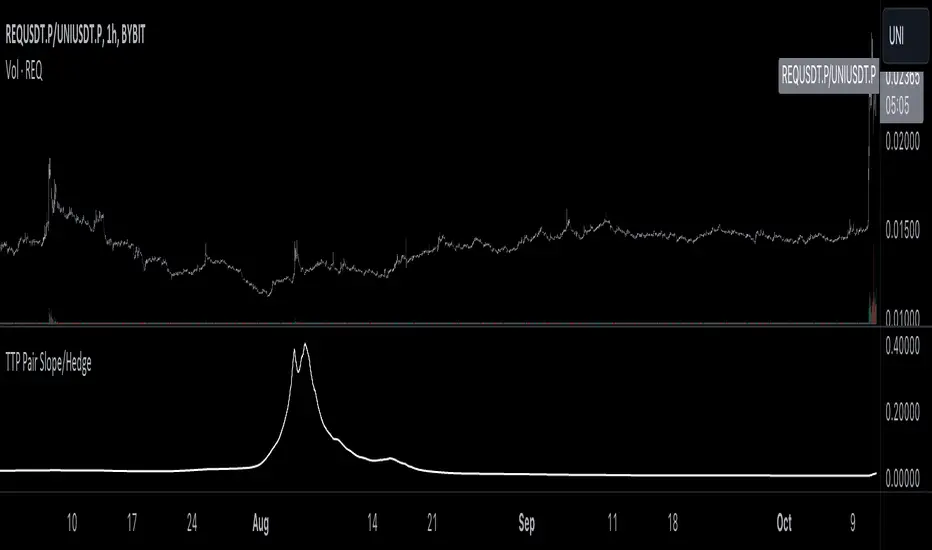
TTP Pair Slope/HedgePair slope/hedge uses linear regression to calculate the hedge ratio (slope) between the two assets within a period.
It allows you to specify a "from" and a "to" candle.
Example:
"A regression from 1000 candles back in time and ignore the last 100 candles. This would result in making a regression of 900 candles in total."
The formula used to perform the regression with the assts X and Y is:
Hedge =
mean( (X-mean(X))^2 )
——————————————————
mean( (X-mean(X)) * (Y-mean(Y)) )
You can later use the hedge in a chart of X - Hedge * Y
(Confirm with 1 / hedge )
If the plot is stationary the period tested should look like stationary.
If you cross an imaginary horizontal line across all the values in the period used it should look like a flat channel with values crossing above and below the line.
The purpose of this indicator is to help finding the linear regression test used for conintegration analysis. Conintegration assets is one of the requirements to consider assets for pair and hedge trading.
Nifty 50 5mint Strategy
The script defines a specific trading session based on user inputs. This session is specified by a time range (e.g., "1000-1510") and selected days of the week (e.g., Monday to Friday). This session definition is crucial for trading only during specific times.
Lookback and Breakout Conditions:
The script uses a lookback period and the highest high and lowest low values to determine potential breakout points. The lookback period is user-defined (default is 10 periods).
The script also uses Bollinger Bands (BB) to identify potential breakout conditions. Users can enable or disable BB crossover conditions. BB consists of an upper and lower band, with the basis.
Additionally, the script uses Dema (Double Exponential Moving Average) and VWAP (Volume Weighted Average Price) . Users can enable or disable this condition.
Buy and Sell Conditions:
Buy conditions are met when the close price exceeds the highest high within the specified lookback period, Bollinger Bands conditions are satisfied, Dema-VWAP conditions are met, and the script is within the defined trading session.
Sell conditions are met when the close price falls below the lowest low within the lookback period, Bollinger Bands conditions are satisfied, Dema-VWAP conditions are met, and the script is within the defined trading session.
When either condition is met, it triggers a "long" or "short" position entry.
Trailing Stop Loss (TSL):
Users can choose between fixed points ( SL by points ) or trailing stop (Profit Trail).
For fixed points, users specify the number of points for the stop loss. A fixed stop loss is set at a certain distance from the entry price if a position is opened.
For Profit Trail, users can enable or disable this feature. If enabled, the script uses a "trail factor" (lookback period) to determine when to adjust the stop loss.
If the price moves in the direction of the trade and reaches a certain level (determined by the trail factor), the stop loss is adjusted, trailing behind the price to lock in profits.
If the close price falls below a certain level (lowest low within the trail factor(lookback)), and a position is open, the "long" position is closed (strategy.close("long")).
If the close price exceeds a certain level (highest high within the specified trail factor(lookback)), and a position is open, the "short" position is closed (strategy.close("short")).
Positions are also closed if they are open outside of the defined trading session.
Background Color:
The script changes the background color of the chart to indicate buy (green) and sell (red) signals, making it visually clear when the strategy conditions are met.
In summary, this script implements a breakout trading strategy with various customizable conditions, including Bollinger Bands, Dema-VWAP crossovers, and session-specific rules. It also includes options for setting stop losses and trailing stop losses to manage risk and lock in profits. The "trail factor" helps adjust trailing stops dynamically based on recent price movements. Positions are closed under certain conditions to manage risk and ensure compliance with the defined trading session.
CE=Buy, CE_SL=stoploss_buy, tCsl=Trailing Stop_buy.
PE=sell, PE_SL= stoploss_sell, tpsl=Trailing Stop_sell.
Remember that trading involves inherent risks, and past performance is not indicative of future results. Exercise caution, manage risk diligently, and consider the advice of financial experts when using this script or any trading strategy.

Cross Correlation [Kioseff Trading]Hello!
This script "Cross Correlation" calculates up to ~10,000 lag-symbol pair cross correlation values simultaneously!
Cross correlation calculation for 20 symbols simultaneously
+/- Lag Range is theoretically infinite (configurable min/max)
Practically, calculate up to 10000 lag-symbol pairs
Results can be sorted by greatest absolute difference or greatest sum
Ability to "isolate" the symbol on your chart and check for cross correlation against a list of symbols
Script defaults to stock pairs when on a stock, Forex pairs when on a Forex pair, crypto when on a crypto coin, futures when on a futures contract.
A custom symbol list can be used for cross correlation checking
Can check any number of available historical data points for cross correlation
Practical Assessment
Ideally, we can calculate cross correlation to determine if, in a list of assets, any of the assets frequently lead or lag one another.
Example
Say we are comparing the log returns for the previous 10 days for SPY and XLU.
*A single time-interval corresponds to the timeframe of your chart i.e. 1-minute chart = 1-minute time interval. We're using days for this example.
(Example Results)
A lag value (k) +/-3 is used.
The cross correlation (normalized) for k = +3 is -0.787
The cross correlation (normalized) for k = -3 is 0.216
A positive "k" value indicates the correlation when Asset A (SPY) leads Asset B (XLU)
A negative "k" value indicates the correlation when Asset B (XLU) leads Asset A (SPY)
A normalized cross correlation of -0.787 for k = +3 indicates an "adequately strong" negative relationship when SPY leads XLU by 3 days.
When SPY increases or decreases - XLU frequently moves in the opposite direction 3 days later.
A cross correlation value of 0.216 at k = −3 indicates a "weak" positive correlation when XLU leads SPY by 3 days.
There's a slight tendency for SPY to move in the same direction as XLU 3 days later.
After the cross-correlation score is normalized it will fall between -1 and 1.
A cross-correlation score of 1 indicates a perfect directional relationship between asset A and asset B at the corresponding lag (k).
A cross correlation of -1 indicates a perfect inverse relationship between asset A and asset B at the corresponding lag (k).
A cross correlation of 0 indicates no correlation at the corresponding lag (k).
The image above shows the primary usage for the script!
The image above further explains the data points located in the table!
The image above shows the script "isolating" the symbol on my chart and checking the cross correlation between the symbol and a list of symbols!
Wrapping Up
With this information, hopefully you can find some meaningful lead-lag relationships amongst assets!
Thank you for checking this out (:

Crypto Open InterestPlots a crypto's open interest on Binance.
You can choose to see OI as asset-denominated (e.g. 1000 BTC), USD-denominated, or both.
How I usually interpret OI:
Price up, OI up = longs opened = bullish
Price up, OI down = shorts closed = bullish on HTF, or counter-trade on LTF
Price down, OI up = shorted opened = bearish
Price down, OI down = longs closed = bearish on HTF, or counter-trade on LTF
I find the indicator useful on 1-minute charts to identify liquidations and compare perp v.s. spot patterns.

Strategy - Relative Volume GainersStrategy - Relative Volume Gainers
Overview:
This trading strategy, called "Relative Volume Gainers," is designed for Long Entry opportunities in the stock market. The strategy aims to identify potential trading candidates based on specific technical conditions, including volume, price movements, and indicator alignments.
Strategy Rules:
The strategy is focused solely on Long Entry positions.
The volume for the current trading day must be greater than or equal to the volume of the previous day.
The percentage change in price must be greater than or equal to 2.5%.
The Last Traded Price (LTP) must be greater than or equal to the Exponential Moving Average (EMA) 200.
The Relative Volume for the current trading day (calculated over the last 30 days) must be greater than or equal to the Simple Moving Average (SMA) of Relative Volume over the same 30 days.
The current candle on the chart should be Green or Bullish, indicating positive price movement.
The price difference between bid and ask prices should be kept to a minimum.
It's recommended to also analyze market depth for better insights.
Strategy Requirements:
Add the Exponential Moving Average (EMA) 200 to your trading chart.
This strategy can be applied on charts of any timeframe.
For intraday trading, particularly for early entry, consider using a 1-minute timeframe.
It is advisable to create a screener to identify potential trades in real-time market conditions.
Risk Warning:
Stocks that meet the strategy criteria might exhibit high volatility and a high beta, making them inherently risky to trade. Exercise caution and adhere to predetermined risk management strategies.
Determine your trading quantity based on your entry price and stop loss in order to manage risk effectively.
Quantity Calculation Formula:
Quantity calculation is crucial to manage risk and position sizing. The following formulas can be used based on your trading scenario:
Quantity with Leverage:
Quantity = (((Using Capital / 100) * Risk Percent) / (Entry Price - Stop Loss)) * Leverage
Eg: Quantity = (((10000 / 100) * 0.2) / (405.5 - 398.5)) * 5
Quantity = 14
Risk = Rs.100 (Rs.100 is 1% of Rs.10000. So the risk is 1%, means we lose only Rs.100 when the SL is hit. If SL is increased the Quantity will get reduced to maintain a fixed risk of Rs.100)
Quantity without Leverage:
Quantity = (((Using Capital / 100) * Risk Percent) / (Entry Price - Stop Loss))
Note:
Always stay informed about market conditions and be prepared for potential rapid price movements when trading stocks that meet the strategy criteria. Strictly adhere to your predefined risk management strategy to safeguard your capital.

Yesterday's High v.17.07Yesterday’s High Breakout it is a trading system based on the analysis of yesterday's highs, it works in trend-following mode therefore it opens a long position at the breakout of yesterday's highs even if they occur several times in one day.
There are several methods for exiting a trade, each with its own unique strategy. The first method involves setting Take-Profit and Stop-Loss percentages, while the second utilizes a trailing-stop with a specified offset value. The third method calls for a conditional exit when the candle closes below a reference EMA.
Additionally, operational filters can be applied based on the volatility of the currency pair, such as calculating the percentage change from the opening or incorporating a gap to the previous day's high levels. These filters help to anticipate or delay entry into the market, mitigating the risk of false breakouts.
In the specific case of INJ, a 12% Take-Profit and a 1.5% Stop-Loss were set, with an activated trailing-stop percentage, TRL 1 and OFF 0.5.
To postpone entry and avoid false breakouts, a 1% gap was added to the price of yesterday's highs.
Name: Yesterday's High Breakout - Trend Follower Strategy
Author: @tumiza999
Category: Trend Follower, Breakout of Yesterday's High.
Operating mode: Spot or Futures (only long).
Trade duration: Intraday.
Timeframe: 30M, 1H, 2H, 4H
Market: Crypto
Suggested usage: Short-term trading, when the market is in trend and it is showing high volatility.
Entry: When there is a breakout of Yesterday's High.
Exit: Profit target or Trailing stop, Stop loss or Crossunder EMA.
Configuration:
- Gap to anticipate or postpone the entry before or after the identified level
- Rate of Change for Entry Condition
- Take Profit, Stop Loss and Trailing Stop
- EMA length
Backtesting:
⁃ Exchange: BINANCE
⁃ Pair: INJUSDT
⁃ Timeframe: 4H
- Treshold: 1
- Gap%: 1
- SL: 1.5
- TP:12
- TRL: 1
- OFF-TRL: 0.5
⁃ Fee: 0.075%
⁃ Slippage: 1
- Initial Capital: 10000 USDT
- Position sizing: 10% of Equity
- Start : 2018-07-26 (Out Of Sample from 2022-12-23)
- Bar magnifier: on
Credits: LucF for Pine Coders (f_security function to avoid repainting using security)
Disclaimer: Risk Management is crucial, so adjust stop loss to your comfort level. A tight stop loss can help minimise potential losses. Use at your own risk.
How you or we can improve? Source code is open so share your ideas!
Leave a comment and smash the boost button!
Thanks for your attention, happy to support the TradingView community.

Volatility Capture RSI-Bollinger - Strategy [presentTrading]- Introduction and how it is different
The 'Volatility Capture RSI-Bollinger - Strategy ' is a trading strategy that combines the concepts of Bollinger Bands (BB), Relative Strength Index (RSI), and Simple Moving Average (SMA) to generate trading signals. The uniqueness of this strategy is it calculates which is a dynamic level between the upper and lower Bollinger Bands based on the closing price. This unique feature allows the strategy to adapt to market volatility and price movements.
The market in Crypto and Stock are highly volatile, making them suitable for a strategy that uses Bollinger Bands. The RSI can help identify overbought or oversold conditions in this often speculative market.
BTCUSD 4hr chart
(700.hk) 3hr chart
Remember, the effectiveness of a trading strategy also depends on other factors such as the timeframe used, the specific settings of the indicators, and the overall market conditions. It's always recommended to backtest and paper trade a strategy before using it in live trading.
- Strategy, How it Works
Dynamic Bollinger Band: The strategy works by first calculating the upper and lower Bollinger Bands based on the user-defined length and multiplier. It then uses the Bollinger Bands and the closing price to dynamically adjust the presentBollingBand value. In the end, it generates a long signal when the price crosses over the present Bolling Band and a short signal when the price crosses under the present Bolling Band.
RSI: If the user has chosen to use RSI for signals, the strategy also calculates the RSI and its SMA, and uses these to generate additional long and short signals. The RSI-based signals are only used if the 'Use RSI for signals' option is set to true.
The strategy then checks the chosen trading direction and enters a long or short position accordingly. If the trading direction is set to 'Both', the strategy can enter both long and short positions.
Finally, the strategy exits a position when the close price crosses under the present Bolling Band for a long position, or crosses over the present Bolling Band for a short position.
- Trade direction
The strategy also includes a trade direction parameter, allowing the user to choose whether to enter long trades, short trades, or both. This makes the strategy adaptable to different market conditions and trading styles.
- Usage
1. Set the input parameters as per your trading preferences. You can choose the price source, the length of the moving average, the multiplier for the ATR, whether to use RSI for signals, the RSI and SMA periods, the bought and sold range levels, and the trading direction.
2. The strategy will then generate buy and sell signals based on these parameters. You can use these signals to enter and exit trades.
- Default settings
1. Source: hlc3
2. Length: 50
3. Multiplier: 2.7183
4. Use RSI for signals: True
5. RSI Period: 10
6. SMA Period: 5
7. Bought Range Level: 55
8. Sold Range Level: 50
9. Trade Direction: Both
- Strategy's default Properties
1. Default Quantity Type: 'strategy.percent_of_equity'
2. commission_value= 0.1, commission_type=strategy.commission.percent, slippage= 1: These parameters set the commission and slippage for the strategy. The commission is set to 0.1% of the trade value, and the slippage (the difference between the expected price of a trade and the price at which the trade is executed) is set to 1.
3. default_qty_type = strategy.percent_of_equity, default_qty_value = 15: These parameters set the default quantity for trades. The default_qty_type is set to strategy.percent_of_equity, which means that the size of each trade will be a percentage of the account equity. The default_qty_value is set to 15, which means that each trade will be 15% of the account equity.
4. initial_capital= 10000: This parameter sets the initial capital for the strategy to $10,000.

PresentTrend - Strategy [presentTrading]- Introduction and how it is different
The PresentTrend strategy is a unique custom trend-following strategy. This combination allows the strategy to take advantage of both short-term and long-term market trends, making it suitable for various market conditions.
BTCUSDT 4hr chart
(700.hk) 3D chart
- Strategy, How it Works
RSI or MFI: The first part uses a custom indicator based on either the Relative Strength Index (RSI) or the Money Flow Index (MFI). The indicator calculates a PresentTrend value, which generates buy and sell signals based on its crossover and crossunder, indicating potential trend reversals.
ATR: The second part is a popular trend-following indicator that uses the Average True Range (ATR).
The strategy enters a long position when all buy signals from both strategies are true, and a short position when all sell signals are true. This ensures trades are entered when both short-term and long-term trends align, potentially increasing the strategy's reliability.
- Trade direction
The strategy also includes a trade direction parameter, allowing the user to choose whether to enter long trades, short trades, or both. This makes the strategy adaptable to different market conditions and trading styles.
- Usage
1. Set the input parameters for the custom trend-following strategy.
2. Choose whether to use the RSI or MFI for the custom strategy.
3. Choose the trade direction: long, short, or both.
4. The strategy will generate buy and sell signals based on the conditions of both strategies.
5. Enter a trade when a buy or sell signal is generated, depending on the chosen trade direction.
Please note that this strategy is meant to be a tool to aid in your trading decisions and not a standalone trading system. Always use proper risk management and make sure to test the strategy thoroughly before using it in live trading.
- Default settings
1. Source: 'hlc3', a balanced price level for calculations.
2. Length: 14, a common setting for many technical indicators.
3. Multiplier: 1.618 (the golden ratio), used in calculating the upper and lower thresholds.
4. RSI or MFI: Set to use MFI by default, both are momentum indicators.
5. Trade Direction: 'Both', allowing for both long and short trades.
The default settings are designed to provide a balanced approach to trend detection. However, these can be adjusted based on the user's preferences and the specific characteristics of the market being traded.
- Strategy's default Properties
1. Default Quantity Type: 'strategy.percent_of_equity'
2. commission_value= 0.1, commission_type=strategy.commission.percent, slippage= 1: These parameters set the commission and slippage for the strategy. The commission is set to 0.1% of the trade value, and the slippage (the difference between the expected price of a trade and the price at which the trade is executed) is set to 1.
3. default_qty_type = strategy.percent_of_equity, default_qty_value = 10: These parameters set the default quantity for trades. The default_qty_type is set to strategy.percent_of_equity, which means that the size of each trade will be a percentage of the account equity. The default_qty_value is set to 10, which means that each trade will be 10% of the account equity.
4. initial_capital= 10000: This parameter sets the initial capital for the strategy to $10,000.

ATR GOD Strategy by TradeSmart (PineConnector-compatible)This is a highly-customizable trading strategy made by TradeSmart, focusing mainly on ATR-based indicators and filters. The strategy is mainly intended for trading forex , and has been optimized using the Deep Backtest feature on the 2018.01.01 - 2023.06.01 interval on the EUR/USD (FXCM) 15M chart, with a Slippage value of 3, and a Commission set to 0.00004 USD per contract. The strategy is also made compatible with PineConnector , to provide an easy option to automate the strategy using a connection to MetaTrader. See tooltips for details on how to set up the bot, and check out our website for a detailed guide with images on how to automate the strategy.
The strategy was implemented using the following logic:
Entry strategy:
A total of 4 Supertrend values can be used to determine the entry logic. There is option to set up all 4 Supertrend parameters individually, as well as their potential to be used as an entry signal/or a trend filter. Long/Short entry signals will be determined based on the selected potential Supertrend entry signals, and filtered based on them being in an uptrend/downtrend (also available for setup). Please use the provided tooltips for each setup to see every detail.
Exit strategy:
4 different types of Stop Losses are available: ATR-based/Candle Low/High Based/Percentage Based/Pip Based. Additionally, Force exiting can also be applied, where there is option to set up 4 custom sessions, and exits will happen after the session has closed.
Parameters of every indicator used in the strategy can be tuned in the strategy settings as follows:
Plot settings:
Plot Signals: true by default, Show all Long and Short signals on the signal candle
Plot SL/TP lines: false by default, Checking this option will result in the TP and SL lines to be plotted on the chart.
Supertrend 1-4:
All the parameters of the Supertrends can be set up here, as well as their individual role in the entry logic.
Exit Strategy:
ATR Based Stop Loss: true by default
ATR Length (of the SL): 100 by default
ATR Smoothing (of the SL): RMA/SMMA by default
Candle Low/High Based Stop Loss: false by default, recent lowest or highest point (depending on long/short position) will be used to calculate stop loss value. Set 'Base Risk Multiplier' to 1 if you would like to use the calculated value as is. Setting it to a different value will count as an additional multiplier.
Candle Lookback (of the SL): 50 by default
Percentage Based Stop Loss: false by default, Set the stop loss to current price - % of current price (long) or price + % of current price (short).
Percentage (of the SL): 0.3 by default
Pip Based Stop Loss: Set the stop loss to current price - x pips (long) or price + x pips (short). Set 'Base Risk Multiplier' to 1 if you would like to use the calculated value as is. Setting it to a different value will count as an additional multiplier.
Pip (of the SL): 10 by default
Base Risk Multiplier: 4.5 by default, the stop loss will be placed at this risk level (meaning in case of ATR SL that the ATR value will be multiplied by this factor and the SL will be placed that value away from the entry level)
Risk to Reward Ratio: 1.5 by default, the take profit level will be placed such as this Risk/Reward ratio is met
Force Exiting:
4 total Force exit on custom session close options: none applied by default. If enabled, trades will close automatically after the set session is closed (on next candle's open).
Base Setups:
Allow Long Entries: true by default
Allow Short Entries: true by default
Order Size: 10 by default
Order Type: Capital Percentage by default, allows adjustment on how the position size is calculated: Cash: only the set cash amount will be used for each trade Contract(s): the adjusted number of contracts will be used for each trade Capital Percentage: a % of the current available capital will be used for each trade
ATR Limiter:
Use ATR Limiter: true by default, Only enter into any position (long/short) if ATR value is higher than the Low Boundary and lower than the High Boundary.
ATR Limiter Length: 50 by default
ATR Limiter Smoothing: RMA/SMMA by default
High Boundary: 1000 by default
Low Boundary: 0.0003 by default
MA based calculation: ATR value under MA by default, If not Unspecified, an MA is calculated with the ATR value as source. Only enter into position (long/short) if ATR value is higher/lower than the MA.
MA Type: RMA/SMMA by default
MA Length: 400 by default
Waddah Attar Filter:
Explosion/Deadzone relation: Not specified by default, Explosion over Deadzone: trades will only happen if the explosion line is over the deadzone line; Explosion under Deadzone: trades will only happen if the explosion line is under the deadzone line; Not specified: the opening of trades will not be based on the relation between the explosion and deadzone lines.
Limit trades based on trends: Not specified by default, Strong Trends: only enter long if the WA bar is colored green (there is an uptrend and the current bar is higher then the previous); only enter short if the WA bar is colored red (there is a downtrend and the current bar is higher then the previous); Soft Trends: only enter long if the WA bar is colored lime (there is an uptrend and the current bar is lower then the previous); only enter short if the WA bar is colored orange (there is a downtrend and the current bar is lower then the previous); All Trends: only enter long if the WA bar is colored green or lime (there is an uptrend); only enter short if the WA bar is colored red or orange (there is a downtrend); Not specified: the color of the WA bar (trend) is not relevant when considering entries.
WA bar value: Not specified by default, Over Explosion and Deadzone: only enter trades when the WA bar value is over the Explosion and Deadzone lines; Not specified: the relation between the explosion/deadzone lines to the value of the WA bar will not be used to filter opening trades.
Sensitivity: 150 by default
Fast MA Type: SMA by default
Fast MA Length: 10 by default
Slow MA Type: SMA
Slow MA Length: 20 by default
Channel MA Type: EMA by default
BB Channel Length: 20 by default
BB Stdev Multiplier: 2 by default
Trend Filter:
Use long trend filter 1: false by default, Only enter long if price is above Long MA.
Show long trend filter 1: false by default, Plot the selected MA on the chart.
TF1 - MA Type: EMA by default
TF1 - MA Length: 120 by default
TF1 - MA Source: close by default
Use short trend filter 1: false by default, Only enter long if price is above Long MA.
Show short trend filter 1: false by default, Plot the selected MA on the chart.
TF2 - MA Type: EMA by default
TF2 - MA Length: 120 by default
TF2 - MA Source: close by default
Volume Filter:
Only enter trades where volume is higher then the volume-based MA: true by default, a set type of MA will be calculated with the volume as source, and set length
MA Type: RMA/SMMA by default
MA Length: 200 by default
Date Range Limiter:
Limit Between Dates: false by default
Start Date: Jan 01 2023 00:00:00 by default
End Date: Jun 24 2023 00:00:00 by default
Session Limiter:
Show session plots: false by default, show market sessions on chart: Sidney (red), Tokyo (orange), London (yellow), New York (green)
Use session limiter: false by default, if enabled, trades will only happen in the ticked sessions below.
Sidney session: false by default, session between: 15:00 - 00:00 (EST)
Tokyo session: false by default, session between: 19:00 - 04:00 (EST)
London session: false by default, session between: 03:00 - 11:00 (EST)
New York session: false by default, session between: 08:00 - 17:00 (EST)
Trading Time:
Limit Trading Time: true by default, tick this together with the options below to enable limiting based on day and time
Valid Trading Days Global: 123567 by default, if the Limit Trading Time is on, trades will only happen on days that are present in this field. If any of the not global Valid Trading Days is used, this field will be neglected. Values represent days: Sunday (1), Monday (2), ..., Friday (6), Saturday(7) To trade on all days use: 123457
(1) Valid Trading Days: false, 123456 by default, values represent days: Sunday (1), Monday (2), ..., Friday (6), Saturday(7) The script will trade on days that are present in this field. Please make sure that this field and also (1) Valid Trading Hours Between is checked
(1) Valid Trading Hours Between: false, 1800-2000 by default, hours between which the trades can happen. The time is always in the exchange's timezone
All other options are also disabled by default
PineConnector Automation:
Use PineConnector Automation: false by default, In order for the connection to MetaTrader to work, you will need do perform prerequisite steps, you can follow our full guide at our website, or refer to the official PineConnector Documentation. To set up PineConnector Automation on the TradingView side, you will need to do the following:
1. Fill out the License ID field with your PineConnector License ID;
2. Fill out the Risk (trading volume) with the desired volume to be traded in each trade (the meaning of this value depends on the EA settings in Metatrader. Follow the detailed guide for additional information);
3. After filling out the fields, you need to enable the 'Use PineConnector Automation' option (check the box in the strategy settings);
4. Check if the chart has updated and you can see the appropriate order comments on your chart;
5. Create an alert with the strategy selected as Condition, and the Message as {{strategy.order.comment}} (should be there by default);
6. Enable the Webhook URL in the Notifications section, set it as the official PineConnector webhook address and enjoy your connection with MetaTrader.
License ID: 60123456789 by default
Risk (trading volume): 1 by default
NOTE! Fine-tuning/re-optimization is highly recommended when using other asset/timeframe combinations.

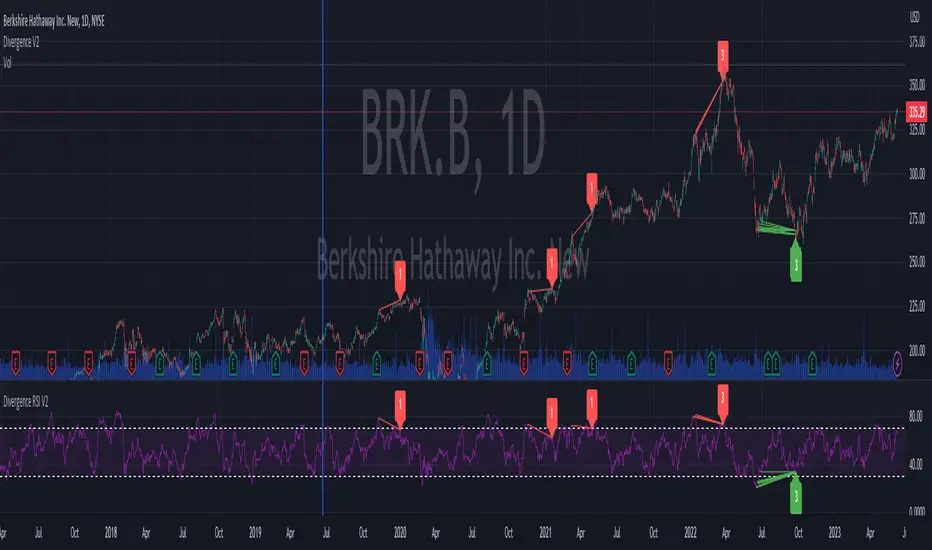
Divergence RSI V2This indicator is based on the concept of divergence. I recommend that you find out and study about this yourself as the concept of divergence will not be explained in depth in this description.
This indicator will show divergences between the asset price and the RSI oscillator. The indicator will look for divergent points between the rising highs and falling lows of the asset; and the rising lows and falling highs of the RSI.
The trend of the asset tends to follow the behavior of the oscillator when a divergence occurs. So if we find a divergence between the two, the price of the asset is likely to follow the trend of the oscillator.
This indicator looks for these types of divergences and will show (based on the RSI) if there is a bullish or bearish divergence.
If it is bullish, it will show a line joining those points in green and if it is bearish in red. In addition, it will show a label where you can see the number of occurrences that have been found from a certain point to another.
Note: this indicator can be complemented with the “Divergence V2” indicator which is also found in my library.
Settings
Backtesting Bars : is the number of bars back that the indicator will check. No more than 1000 is recommended as this will slow down the search.
Tolerance: number of times a divergent line can cross a bar. If you place 0, no bar can be crossed by a diverging line.
Min Bars To detect: will only search for divergences (or lines) that have the minimum number of bars selected in this option. Default option is 30.
Min Bars To detect: it will only search for divergences (or lines) that have the maximum number of bars selected in this option. Default option is 100.
Source Highs: The high points will be based on the close of each bar. You can use as another alternative.
Source Lows: The low points will be based on the close of each bar. You can use as another alternative.
Use squeeze parameter: only look for divergences (bullish or bearish) at times when such an indicator is in favor of the trend or coincides with the corresponding RSI divergence.
Divergence V2This indicator is based on the concept of divergence. I recommend that you find out and study about this yourself as the concept of divergence will not be explained in depth in this description.
This indicator will show divergences between the asset price and the RSI oscillator. The indicator will look for divergent points between the rising highs and falling lows of the asset; and the rising lows and falling highs of the RSI.
The trend of the asset tends to follow the behavior of the oscillator when a divergence occurs. So if we find a divergence between the two, the price of the asset is likely to follow the trend of the oscillator.
This indicator looks for these types of divergences and will show (based on the RSI) if there is a bullish or bearish divergence.
If it is bullish, it will show a line joining those points in green and if it is bearish in red. In addition, it will show a label where you can see the number of occurrences that have been found from a certain point to another.
Note: this indicator can be complemented with the “Divergence RSI V2” indicator which is also found in my library.
Settings
Backtesting Bars: is the number of bars back that the indicator will check. No more than 1000 is recommended as this will slow down the search.
Tolerance: number of times a divergent line can cross a bar. If you place 0, no bar can be crossed by a diverging line.
Min Bars To detect: will only search for divergences (or lines) that have the minimum number of bars selected in this option. Default option is 30.
Min Bars To detect: it will only search for divergences (or lines) that have the maximum number of bars selected in this option. Default option is 100.
Source Highs: The high points will be based on the close of each bar. You can use as another alternative.
Source Lows: The low points will be based on the close of each bar. You can use as another alternative.
Use squeeze parameter : only look for divergences (bullish or bearish) at times when such an indicator is in favor of the trend or coincides with the corresponding RSI divergence.

Planetary Tunings Moving AveragesThe Pine Script "Planetary Tunings Moving Averages" is a unique tool that plots moving averages (MAs) on a chart, representing the wavelengths of different planets as derived from the book Quadrivium. These wavelengths, also referred to as 'planetary tunings', are related to the orbital resonance of each planet.
Each planetary tuning value is first transformed into a whole number by multiplying it by 1000 and removing the decimal. This whole number is then used as the length parameter for a Simple Moving Average (SMA) function. This function calculates the average of the closing prices over the defined number of periods, thereby creating a moving average line on the chart.
The moving average lines are color-coded according to the planet they represent, allowing for quick and easy interpretation. For example, Mercury's moving average line is blue, Venus's line is orange, and so forth. These colors can be adjusted directly in the Pine Script code if desired.
Additionally, the script computes the mean of all these moving averages and plots it on the chart. This line provides an overall trend line, summarizing the collective behavior of all the planetary tuning moving averages.
The drawings in the chart are fib channels and fib circles that I use to capture liquidity in time.
Please note that this script is written for Pine Script Version 4. It's crucial to ensure your TradingView platform is compatible with this version. For any issues or further clarification, consider referring to TradingView's Pine Script documentation or its community forums.

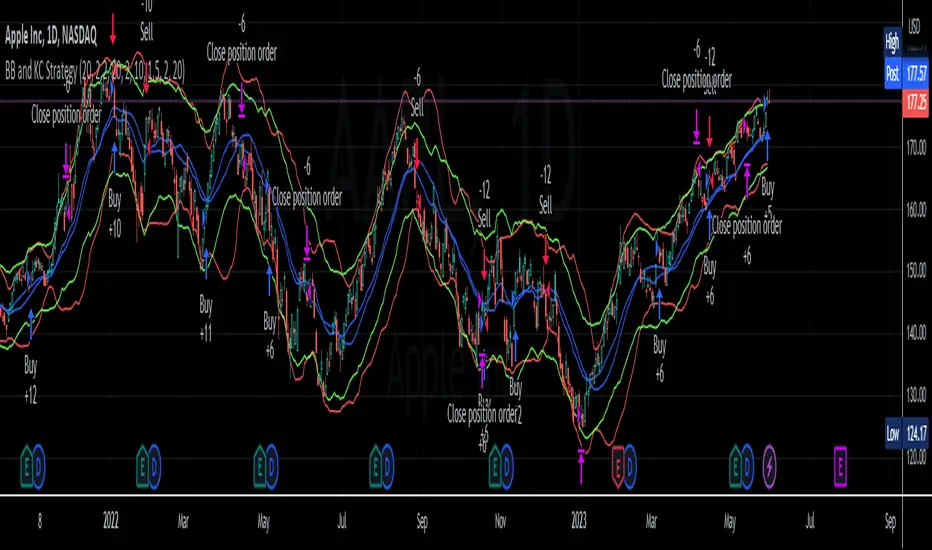
BB and KC StrategyThis script is designed as a TradingView strategy that uses Bollinger Bands (BB) and Keltner Channels (KC) as the primary indicators for generating trade signals. It aims to catch potential market trends by comparing the movements of these two popular volatility measures.
Key aspects of this strategy:
1. **Bollinger Bands and Keltner Channels:** Both are volatility-based indicators. The Bollinger Bands consist of a middle band (simple moving average) and two outer bands calculated based on standard deviation, which adjusts itself to market conditions. Keltner Channels are a set of bands placed above and below an exponential moving average of the price. The distance between the bands is calculated based on the Average True Range (ATR), a measure of price volatility.
2. **Entry Signals:** The strategy enters a long position when the upper KC line crosses above the upper BB line and the volume is above its moving average. Conversely, it enters a short position when the lower KC line crosses below the lower BB line and the volume is above its moving average.
3. **Exit Signals:** The strategy exits a position under two conditions. First, if the trade has been open for a certain number of bars defined by the user (default 20 bars). Second, a stop loss and trailing stop are in place to limit potential losses and lock in profits as the price moves favorably. The stop loss is set at a percentage of the entry price (default 1.5% for long and -1.5% for short), and the trailing stop is also a percentage of the entry price (default 2%).
4. **Trade Quantity:** The script allows specifying the investment amount for each trade, set to a default of 1000 currency units.
Remember, this is a strategy script, which means it is used for backtesting and not for real-time signals or live trading. It is also recommended that it is used as a tool to aid your trading, not as a standalone system. As with any strategy, it should be tested over different market conditions and used in conjunction with other aspects of technical and fundamental analysis to ensure robustness and effectiveness.
Pure Morning 2.0 - Candlestick Pattern Doji StrategyThe new "Pure Morning 2.0 - Candlestick Pattern Doji Strategy" is a trend-following, intraday cryptocurrency trading system authored by devil_machine.
The system identifies Doji and Morning Doji Star candlestick formations above the EMA60 as entry points for long trades.
For best results we recommend to use on 15-minute, 30-minute, or 1-hour timeframes, and are ideal for high-volatility markets.
The strategy also utilizes a profit target or trailing stop for exits, with stop loss set at the lowest low of the last 100 candles. The strategy's configuration details, such as Doji tolerance, and exit configurations are adjustable.
In this new version 2.0, we've incorporated a new selectable filter. Since the stop loss is set at the lowest low, this filter ensures that this value isn't too far from the entry price, thereby optimizing the Risk-Reward ratio.
In the specific case of ALPINE, a 9% Take-Profit and and Stop-Loss at Lowest Low of the last 100 candles were set, with an activated trailing-stop percentage, Max Loss Filter is not active.
Name : Pure Morning 2.0 - Candlestick Pattern Doji Strategy
Author : @devil_machine
Category : Trend Follower based on candlestick patterns.
Operating mode : Spot or Futures (only long).
Trades duration : Intraday
Timeframe : 15m, 30m, 1H
Market : Crypto
Suggested usage : Short-term trading, when the market is in trend and it is showing high volatility .
Entry : When a Doji or Morning Doji Star formation occurs above the EMA60.
Exit : Profit target or Trailing stop, Stop loss on the lowest low of the last 100 candles.
Configuration :
- Doji Settings (tolerances) for Entry Condition
- Max Loss Filter (Lowest Low filter)
- Exit Long configuration
- Trailing stop
Backtesting :
⁃ Exchange: BINANCE
⁃ Pair: ALPINEUSDT
⁃ Timeframe: 30m
⁃ Fee: 0.075%
⁃ Slippage: 1
- Initial Capital: 10000 USDT
- Position sizing: 10% of Equity
- Start: 2022-02-28 (Out Of Sample from 2022-12-23)
- Bar magnifier: on
Disclaimer : Risk Management is crucial, so adjust stop loss to your comfort level. A tight stop loss can help minimise potential losses. Use at your own risk.
How you or we can improve? Source code is open so share your ideas!
Leave a comment and smash the boost button!
Thanks for your attention, happy to support the TradingView community.

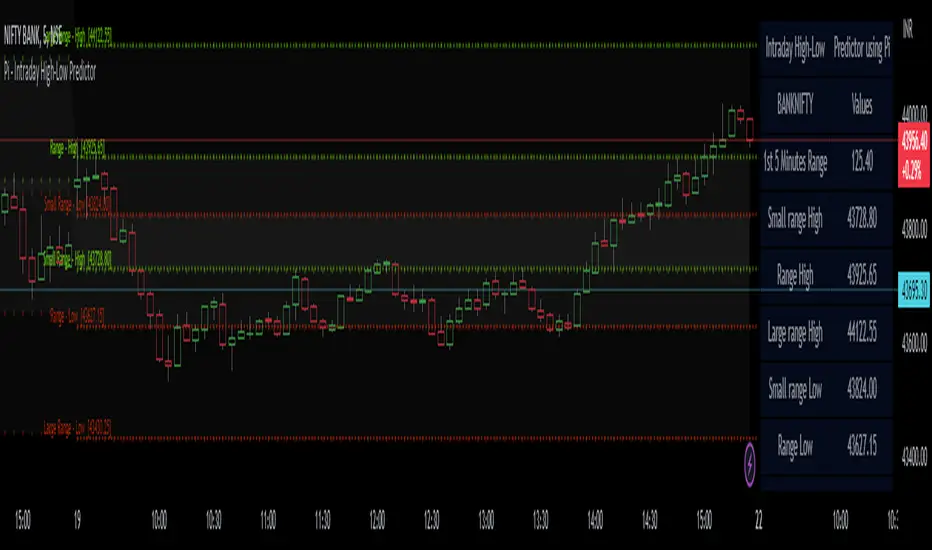
Pi - Intraday High-Low Predictor
Pi - Intraday High-Low Predictor
This is not my Strategy/Research , I've just coded it into a indicator.
I found it interesting & useful so I'm sharing it here.
This Strategy/Research is by Kshirod Chandra Mohanty ( y-o-u-t-u-b-e : Trade with IITIAN )
You can watch his video on y-o-u-t-u-b-e for more info on this one.
the video has following title :
"1Cr Paid Strategy For Free || 10000 Subscribers Special Giveaway || How to find Day High or Low"
This will not tell you which is day high or day low, but it will help you to predict the day high from a day low and day low from a day high.
It will give you a possible range to which the prices could move to.
He has explained/used this on Banknifty.
How to Find out Day High from Day Low & Day Low from Day High :-
He uses the value of Pi (3.14) and the Range of 1st 5minute candle to find out the possible highs from day low and the possible lows from day high.
Range = value of Pi * 1st 5minutes Range
Small range = Range / 2
Large range = Range + Small range
so to find out the possible lows from day high we do following calculations
Small range low = day high - Small range
Range low = day high - Range
Large range low = day high - Large range
and to find out the possible highs from day low we do following calculations
Small range high = day low + Small range
Range high = day low + Range
Large range high = day low + Large range
Note :- This Indicator does Repaint in following ways,
As the script uses the Day High to predict the possible lows ,
so if it's an up-trending day and price keeps on making new High's then the ranges for lows will keep on changing.
similarly the script uses the Day Low to predict the possible high's ,
so if it's an down-trending day and price keeps on making new Low's then the ranges for highs will keep on changing.
My observations / thoughts about this :-
This script does not provide buy/sell recommendations. it just provides possible ranges to where prices can go from Day-High & Day-Low.
It's better to avoid trading when the price is trading between the Small range high & Small range low levels.
As it has high probability that it will be a range bound day and price will stay in between those two levels.
There is a high probability that it will be a trending day if price breaks either the Small range high/low ,
then the price could move to Range low/high.
If price breaks from Range High/Low then there is a high probability that it will be a trending day and the price could move to Large Range low/high.
Note :- If you want to use this on instruments/scripts/indexes which are active for large session such as forex/cryptos , then i suggest that you use the Opening Range period of 4Hours i.e 240minutes, to get better results.
using the default setting of 5minutes will not give good results on them.
play around with this value to find out which one suits that instrument/script/index the best.
Don't trust these levels blindly, do backtest or live testing of this then use for real trade if you want.
Use Price action near these levels to make any trading decision's.
The script provides following options :
1. Option to display Ranges in a Table (which you can enable/hide as you wish)
You can set the Table's location, size , background color & text color according to your preference.
2. Option to enable/hide Predicted-Highs from Day-Low on chart.
3. Option to enable/hide Predicted-Lows from Day-High on chart.
4. Option to set the Opening range period - here you can select your preferred opening range for calculation purpose.
5. Option to enable/hide historical levels on chart.
6. Options to customize the colors & line styles for lines.
7. Options to customize the colors , position & size for labels.
ICT Session Opening FVG / Silver Bullet [MK]Students of ICT concepts will know that the first FVG found within particular session periods can identify an important price level for intraday traders.
"Find the first FVG at the start of the session and drag a box from it to the right"....ICT
The script finds the first FVG (either bull or bear) within the following periods:
London Killzone (0200 - 0500) EST
02:00 - 0259
03:00 - 0359
0400 - 0459
Dead Zone (05-00 - 0600) EST
05-00 - 0559
0600 - 0659
NY AM Killzone (0700 - 1100) EST
0700 - 0759
0830 - 0929
0929 - 0959
1000 - 1100 (Silver Bullet)
A chart higher timeframe can be chosen to detect the FVGs and they will be displayed on lower timeframe. Default is 5min for detection. I like to then following price reacting to 5mi FVGs on a 1 min chart.
FVG boxes can be extended to the end of the session, or to any time within the current days trading hours. Colors/Labels/ Session Periods can all be edited. A maximum timeframe for display is available and
timezone can be adjusted.
FVGs are only shown for the current days trading hours.

Bollinger Bands - Breakout StrategyThe Bollinger Bands - Breakout Strategy is a trend-following optimized for short-term trading in the crypto market. This strategy employs the Bollinger Bands, a widely recognized technical indicator, as its primary instrument for pinpointing potential trades. It is capable of executing both long and short positions, depending on whether the market is in a spot or futures, and is particularly effective in trending markets.
The strategy boasts a high degree of configurability, allowing users to set the Bollinger Bands period and deviation, trend filter, volatility filter, trade direction filter, rate of change filter, and date filter. Furthermore, it offers options for Take Profit, Stop Loss, and Trailing Stop for both long and short positions, ensuring a comprehensive risk management approach. The inclusion of a maximum intraday loss feature adds another layer of protection, making this strategy a valuable tool for traders seeking a professional and adaptable trading system.
Name : Bollinger Bands - Breakout Strategy
Category : Trend Follower based on Bollinger Bands
Operating mode : Long and Short on Futures or Long on Spot
Trade duration : Intraday
Timeframe : 2H, 3H, 4H, 5H
Market : Crypto
Suggested usage : Trending Markets
Entry : When the price crosses above or below the Bollinger Bands
Exit : Opposite Cross or Profit target, Trailing stop or Stop loss
Configuration :
- Bollinger Bands period and deviation
- Trend Filter
- Volatility Filter
- Trade direction filter
- Rate of Change filter
- Date Filter (for backtesting purposes)
- Take Profit, Stop Loss and Trailing Stop for long and short positions
- Risk Management: Max Intraday Loss
Backtesting :
⁃ Exchange: BINANCE
⁃ Pair: BTCUSDT.P
⁃ Timeframe: 4H
⁃ Fee: 0.025%
⁃ Slippage: 1
- Initial Capital: 10000 USDT
- Position sizing: 10% of Equity
- Start : 2019-09-19 (Out Of Sample from 2022-12-23)
- Bar magnifier: on
Credits :
- LucF of Pine Coders for f_security function to avoid repainting using security.
- QuantNomad for Monthly Table.
Disclaimer : Risk Management is crucial, so adjust stop loss to your comfort level. A tight stop loss can help minimise potential losses. Use at your own risk.
How you or we can improve? Source code is open so share your ideas!
Leave a comment and smash the boost button!
Thanks for your attention, happy to support the TradingView community.

Adaptive Price Channel StrategyThis strategy is an adaptive price channel strategy based on the Average True Range (ATR) indicator and the Average Directional Index (ADX). It aims to identify sideways markets and trends in the price movements and make trades accordingly.
The strategy uses a length parameter for the ATR and ADX indicators, which determines the length of the calculation for these indicators. The strategy also uses an ATR multiplier, which is multiplied by the ATR to determine the upper and lower bounds of the price channel.
The first step of the strategy is to calculate the highest high (HH) and lowest low (LL) over the specified length. The ATR is also calculated over the same length. Then the strategy calculates the positive directional indicator (+DI) and negative directional indicator (-DI) based on the up and down moves in the price, and uses these to calculate the ADX.
If the ADX is less than 25, the market is considered to be in a sideways phase. In this case, if the price closes above the upper bound of the price channel (HH - ATR multiplier * ATR), the strategy enters a long position, and if the price closes below the lower bound of the price channel (LL + ATR multiplier * ATR), the strategy enters a short position.
If the ADX is greater than or equal to 25 and the +DI is greater than the -DI, the market is considered to be in a bullish phase. In this case, if the price closes above the upper bound of the price channel, the strategy enters a long position. If the ADX is greater than or equal to 25 and the +DI is less than the -DI, the market is considered to be in a bearish phase. In this case, if the price closes below the lower bound of the price channel, the strategy enters a short position.
The strategy exits a position after a certain number of bars have passed since the entry, as specified by the exit_length input.
In summary, this strategy attempts to trade in accordance with the prevailing market conditions by identifying sideways markets and trends and making trades based on price movements within a dynamically-adjusted price channel.
This strategy takes a read on the market and either takes a channel strategy or trades volatility based on current trend. Works well on 2, 3 ,4, 12 hour for BTC. It’s my first attempt and creating a strategy. I am very interested in constructive criticism. I will look into better risk management, maybe a trailing stop loss. Other suggestions welcome. This is my first attempt at a strategy.
Here are the settings I used.
Inputs
Length 20
Exit 10
ATR 3.2
Dates I picked when I got into Crypto
Properties
Capital 1000
Order size 2 Contracts
Pyramiding 1
Commission .05
