Pattern Recognition Pullback Strategy profit calculatorThis script has been designed for use in botting Crypto spot / futures.
The intended use is send signals to a 3commas bot setup for the exchange. The bot uses candle measuring percentile nearest rank filters and range
breakouts to decide if the market is trending. When the market is trending it will look for pullbacks below a moving average and buy in the trend direction on a pullback discount. This is the profit calculator part of the script
With this script you will not be able to send tradingview signals, that is because it is a payed premium service and for security reasons I am the only one with access to making signals from this script.
I provided a user manual:
drive.google.com
Signals

Pattern Recognition Pullback StrategyThis script has been designed for use in botting Crypto spot / futures.
The intended use is send signals to a 3commas bot setup for the exchange. The bot uses candle measuring percentile nearest rank filters and range
breakouts to decide if the market is trending. When the market is trending it will look for pullbacks below a moving average and buy in the trend direction on a pullback discount.
With this script you will not be able to send tradingview signals, that is because it is a payed service and for security reasons I am the only one with access to making signals from this script. I will be uploading a second script which is the profit calculator. This way you can toy around to find your preferred settings for the bot and see the results it could have made.
I provided a user manual:
drive.google.com

Trendlines with Breaks [LuxAlgo]The trendlines with breaks indicator return pivot point based trendlines with highlighted breakouts. Users can control the steepness of the trendlines as well as their slope calculation method.
Trendline breakouts occur in real-time and are not subject to backpainting. Trendlines can however be subject to repainting unless turned off from the user settings.
The indicator includes integrated alerts for trendline breakouts.
🔶 USAGE
Any valid trendlines methodology can be used with the indicator, users can identify breakouts in order to infer future price movements.
The calculation method of the slope greatly affects the trendline's behaviors. By default, an average true range is used, returning a more constant slope amongst trendlines. Other methods might return trendlines with significantly different slopes.
Stdev makes use of the standard deviation for the slope calculation, while Linreg makes use of the slope of a linear regression.
The above chart shows the indicator using "Stdev" as a slope calculation method. The chart below makes use of the "Linreg" method.
By default trendlines are subject to backpainting, and as such are offset by length bars in the past. Disabling backpainting will not offset the trendlines.
🔶 SETTINGS
Length: Pivot points period
Slope: Slope steepness, values greater than 1 return a steeper slope. Using a slope of 0 would be equivalent to obtaining levels.
Slope Calculation Method: Determines how the slope is calculated.
Backpaint: Determine whether trendlines are backpainted, that is offset to past.

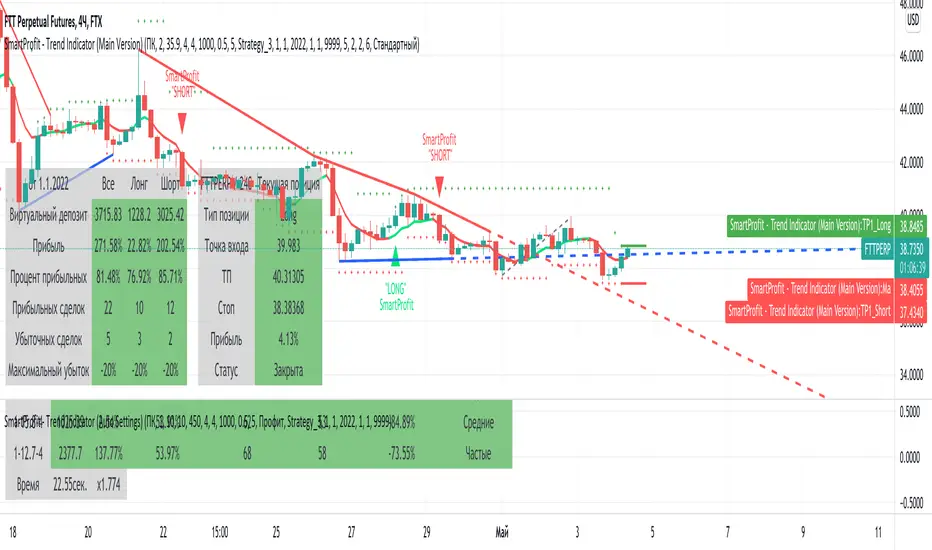
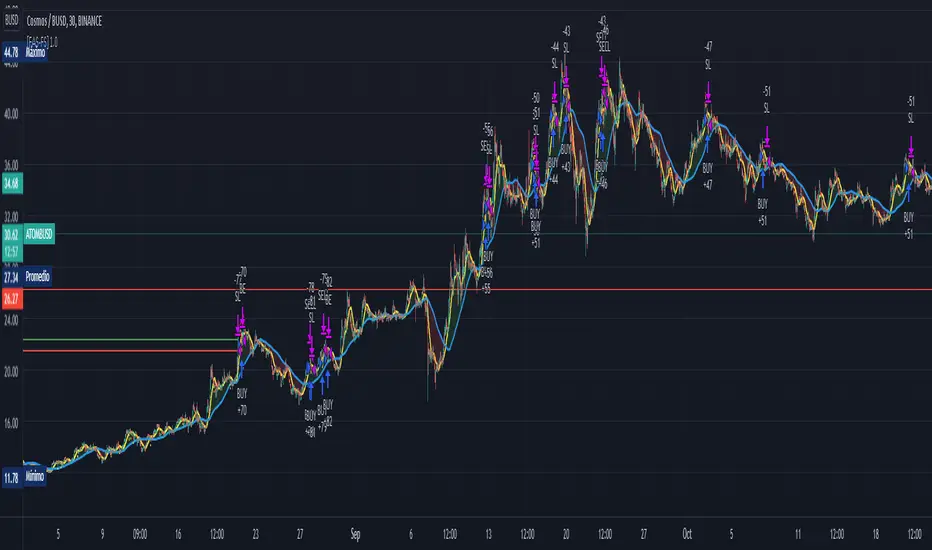
SmartProfit - Trend Indicator (Main Version) - RUSmartProfit - Trend Indicator (Main Version) detects trend direction and gives trading signals for Short and Long positions.
You can use "SmartProdit - Trend Indicator" for any timeframe, from daily, 4h, to fewer ones, even minute timeframe.
We recommend using those timeframes:
4h. and 3h. - for swing trading
15min. и 30min. - for scalping
"SmartProfit - Trend Indicator" features:
1. Sell and Buy signals ( For setup, we have three parameters: HB, sensitivity, and stop )
2. TakeProfit values for Long and Short signals ( Prices for profit fixing )
3. Profit table ( Show profit of current indicator settings for chosen time range )
4. Current position table ( Show data for the current position in real-time. At this table you have all that you need to enter the position )
5. Trend lines ( Draw Global and local trend lines. )
6. Fibonacci levels ( Automatically draw global and local Fibonacci levels )
7. Fibonacci channel ( Automatically draw global and local Fibonacci channels )
8. Auto setting - sorts out more than 6000 variants of settings at one loop and gives the best one.
For best results, you should set up an indicator for each trading pair. For setup, we have three parameters: HB, sensitivity, and stop. We have an additional feature for auto setting, which sorts out more than 6000 variants of settings at one loop and give the best one.
For work with indicators we made 3 strategies:
First - we enter the position after the signal is approved. Close and reenter to position with approved signal for another side.
Second and third - the same, we enter the position after the signal is approved, but we use TakeProfit and StopLoss values to fix the position.
"SmartProdit - Trend Indicator" определяет направления тренда и дает торговые сигналы для входа в Короткую или Длинную позицию.
Индикатор позволяет торговать на любых Таймфреймах , как на дневных, так и на более мелких временных интервалах, вплоть до минутных.
Мы рекомендуем использовать Таймфреймы:
4ч. или 3ч. - для Свинг-торговли
15мин. и 30мин. - для Скальпинга
Подробнее о функционале индикатора SmartProfit:
1. Сигналы Покупки или Продажи ( Для настройки используется уникальные параметры HB и Чувствительность )
2. Значения TakeProfit для Long и Short сигналов ( Зоны фиксации прибыли )
3. Таблица прибыльности ( Отображает прибыльность текущей настройки на выбранном интервале времени )
4. Таблица Текущей позиции ( Показывает текущую позицию в режиме реального времени - в ней есть всё, что нужно для входа в позицию )
5. Трендовые линии ( Рисует как Глобальные, так и локальные трендовые линии, в зависимости от настроек )
6. Уровни Фибоначчи ( Автоматически строит уровни Фибоначчи, как Глобальные так и Локальные )
7. Каналы по Фибоначчи ( Автоматически строит каналы по Фибоначчи, как Глобальные так и Локальные )
8. Автоподсчет всех настроек индикатора - автоматически делает подбор более 6000 вариаций настроек за раз и выдаёт лучшие под каждый актив. Вам не надо тратить недели и месяцы чтобы вручную подбирать настройки, наш инструмент подберет лучшие настройки для Вас.
Для более лучших результатов, для каждого актива индикатор настраивается отдельно !
Для настройки индикатора используются три Уникальных параметра:
HB, Чувствительность, Стоп.
Для работы с индикатором разработаны три стратегии:
Первая - мы входим в позицию при закреплении сигнала и переворачиваемся (то есть выходим из позиции и заходим в противоположную сторону) по обратному сигналу.
По 2-ой и 3-ей стратегии мы также входим после закрепления сигнала, но для фиксации прибыли используем зоны TakeProfit, указанные индикатором.
Подробнее о всех возможностях стратегий, а также настройке и работе с индикатором, вы узнаете из нашей инструкции, которую выдаем персонально.
SignalsThis script allows you to calculate position size, and future profit, loses.
- You can add 3 target values and 1 stop loss
- Optionally you can display table, position it as you like, and see risk ratio
Plans:
- add profit loss to the labels


M.Right_Relative Volume and PVT (cc)Hello Traders,
I hope you're all doing well and enjoying your holiday!
Today I am releasing a Relative Volume and Price Volume Trend indicator that will help traders assess current price action based on its volume and trend.
Volume is one of the most important aspects of trading that is often overlooked by new traders. Generally, when the volume is higher than normal, something is happening with said equity. Whether that's selling or buying volume it shows importance.
The higher the volume the higher the interest of traders in the equity, so a sudden increase in volume relative to its average volume (relative volume) can cause an increased probability that the price will move.
Relative volume is very self-explanatory , it’s the volume relative to its average. In this indicator, I use several different average calculations to give the trader a clear picture of where the volume stands and added a few different trends using these averages. One is a modified Price Volume Trend.
PVT or Price Volume Trend is a momentum-based indicator that measures money flow in relation to volume. It is usually used to confirm trends, but can be used as a trading signal; as I’ve created some in here. I didn’t added divergences, but using divergences in PVT is another strong way to use it. PVT tends to mirror the market price movements; hence, confirm trends.
You will find this indicator to be jam packed full of features.
-Fully customizable: colors, shapes, lines, on/off toggles for everything.
-Includes:
---Relative Volume Wave.
---Shadow Waves that can help with trend confirmation.
---Vibrant Relative Price Spike in the forefront.
---Additional Volume Trend on bottom of volume bars
---Stat box: showing the Current, Average, and Relative volume on the current user selected timeframe.
---Signals.
---Alerts: prefilled.
Enjoy!
Please add a thumbs up if you like this and follow the instructions for access.
Leave any other questions in the comments section.
Cheers,
Mike

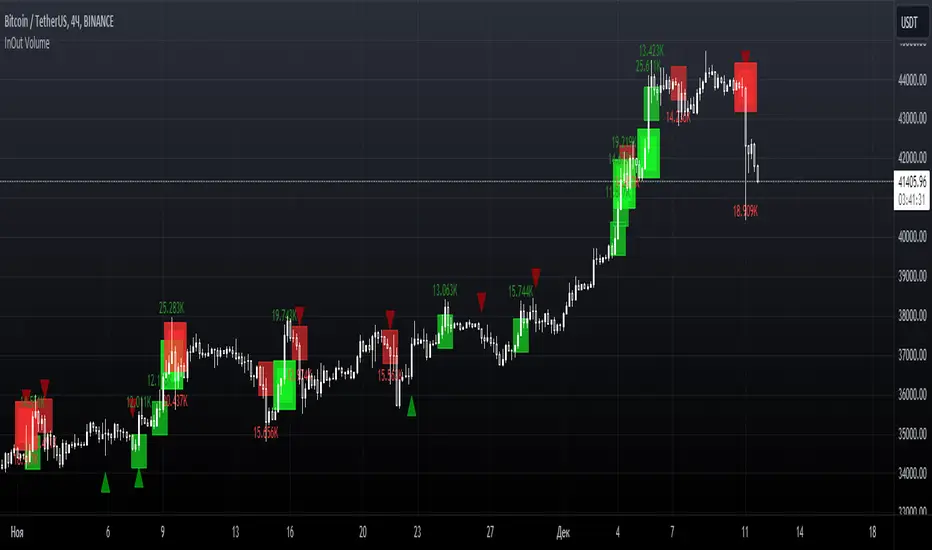
InOut VolumeInOut Volume indicator displays the places where large volume exits to buy or sell and shows signals based on the activity of major players in the market.
Large volumes indicate an increase in demand or supply of the selected asset and are an auxiliary means of analysis. Signals can be used both independently and in combination with other indicators for trading.
The visual display of large volumes and the number of signals depends on the interval applied to the chart, since the volume is concentrated directly in the candles.
-------------------------------------------------------------------------------------------------------------------
InOut Volume индикатор отображает места выхода крупного объема на покупку или продажу и показывает сигналы основанные на активности крупных игроков на рынке.
Крупные объемы указывают на увеличение спроса или предложения выбранного актива и являются вспомогательным средством анализа. Сигналы, в свою очередь, могут быть использованы как самостоятельно, так и в комбинациях с другими индикаторами для торговли, например с Pullback Levels.
Визуальное отображение крупных объемов и количества сигналов зависит от интервала, примененного на график, так как объем сосредотачивается непосредственно в свечах.
Diluted Earnings Per Share Signal [AstrideUnicorn]Earnings Per Share (EPS) is a financial metric closely monitored by investors. The so-called "positive earnings surprise" - a situation when EPS reading for a stock beats the value forecasted by analysts gives a bullish signal for this stock. The EPS reading lower than the analysts' estimate gives a bearish signal.
The Diluted Earnings Per Share (Diluted EPS) metric calculates a company's potential earnings per share value in the case if all convertible securities get converted to common shares. Convertible securities include preferred shares, stock options, warrants, convertible debt, etc. Diluted EPS is a more scientific way to estimate earnings per share, and it is usually lower than the ordinary EPS.
The Diluted EPS Signal indicator (DEPSS) is a fundamental indicator that calculates trading signals by comparing the Diluted EPS to the EPS Estimate. In many cases, Diluted EPS gives better insight into how a reported EPS reading may impact the stock price.
HOW TO USE
For each earnings date, the indicator calculates the Diluted Earnings Surprise percentage value :
Diluted Earnings Surprise = (Diluted EPS - EPS Estimate)/ EPS Estimate.
Diluted Earnings Surprise higher than the specified threshold value is a bullish signal. In this case, the indicator displays a green triangle pointing up.
Diluted Earnings Surprise lower than the specified threshold value is a bearish signal displayed as a red triangle pointing down.
As one can see on the chart, there are a lot of situations where EPS readings with green labels (the ones that beat analysts' estimates) lead to down moves. The DEPSS indicator can spot weak earnings and give opposite signals.
SETTINGS
Earnings Surprise Threshold (%) : the threshold value (in percentage units) for the Diluted Earnings Surprise. The calculated Diluted Earnings Surprise must be higher than Earnings Surprise Threshold to be considered a BUY signal or lower than minus Earnings Surprise Threshold to be considered a SELL signal. The default value for Earnings Surprise Threshold is 20%.

The GM Slip Signals - VIP Revactory - Public SignalsThe GM Slip Signals,
The GM Slip is a signal that uses the strategy based on Candlestick Formation.
This is the pattern formula of GM Slip signals :
1. BASIC SLIP STRATEGY,
- Bullish Basic Slip Pattern : ((BULLISH CANDLE) - (BULLISH CANDLE) - (BEARISH CANDLE) - (BULLISH CANDLE)) = BUY
- Bearish Basic Slip Pattern : ((BEARISH CANDLE) - (BEARISH CANDLE) - (BULLISH CANDLE) - (BEARISH CANDLE)) = SELL
2. COMBINATION SLIP STRATEGY,
- Bullish Combination Slip Pattern : ((BULLISH CANDLE) - (BULLISH CANDLE) - (BEARISH CANDLE) - (BULLISH OUTSIDEBAR CLOSE > UPPER BOLLINGER BANDS )) = BUY
- Bearish Combination Slip Pattern : ((BEARISH CANDLE) - (BEARISH CANDLE) - (BULLISH CANDLE) - (BEARISH OUTSIDEBAR CLOSE < LOWER BOLLINGER BANDS )) = SELL
// ----------- Add-ons Setting ----------- //
Setting for Basic Slip Strategy for Signals :
// ----------- Add-ons Setting ----------- //
Setting for Combination Slip Strategy for Signals :
--------
Recommendations Formula Entry for Binary Options,
// Formula : Timeframe X 1 = Expiration Entry
Ex,
Timeframe : M1 X 1 = 1 Minute
Timeframe : M5 X 1 = 5 Minute
Timeframe : M15 X 1 = 15 Minute
Etc.
--------
Signal Instructions,
1. Diamond BUY / SELL Arrow : PREPARATION SIGNAL
2. Highlight Line Arrow : OPEN POSITION SIGNAL
3. If lose, automatically will be appear "Highlight Line Arrow" on next bar for open position level 1 martingale
--------
Regards Profit Digdaya,
- VIP Revactory Indonesia
--------
DISCLAIMER: No sharing, copying, reselling, modifying, or any other forms of use are authorized for our documents, script / strategy, and the information published with them. This informational planning script / strategy is strictly for individual use and educational purposes only. This is not financial or investment advice. Investments are always made at your own risk and are based on your personal judgement. I am not responsible for any losses you may incur. Please invest wisely.*

Multi-Function RCI(strategic signal,alert and divergence)Japanese below / 日本語説明は下記
Overview
Multi-function RCI indicator with functions below.
1.Multiple signals according to conditions where 3 RCI lines cross
2.Alert when signals triggered
3.Auto divergence drawing
What is RCI?
RCI is one of the oscillator indicators such as RSI and stochastic, measuring overbought/oversold. While RSI and stochastic measures overbought/oversold by price axis, RCI measures by price and time axis.
Please see the details below.
Functions:
1.Multiple signals according to conditions where RCI 3 lines cross
There is two types of signals available in this indicator
A. Overbought/oversold signals
B. Strategic signals
A. Overbought/oversold signals
These signals are displayed when each RCI line crosses upperband/lowerband.
Conditions are as follows:
-RCI(Short) cross over/under upper band
-RCI(Short) cross over/under lower band
-RCI(Middle) cross over/under upper band
-RCI(Middle) cross over/under lower band
-RCI(Long) cross over/under upper band
-RCI(Long) cross over/under lower band
Upper band and lower band can be parameterized.
a. Cross over upper band/Cross under lower band:
These signal are good to judge trend maturity. Once trends get matured, market usually goes into sideways and lead to trend reversal.
b. Cross under upper band/Cross over lower band:
These signal are good to catch trend reversal.
The longer RCI period gets, the bigger price movement gets.
Sample chart
RCI(middle,dark blue) and RCI(Long, magenta) crosses over/under upper band/lower band
B. Strategic signals
Strategic signals are more appropriate to judge timing to enter a trade.
Signals will be appeared when conditions below met with option to select signal sensitivity.
-RCI(Short) crosses over RCI(Middle)
-RCI(Middle) crosses over RCI(Long) and RCI(Long) is below zero line
-RCI(Short) crosses over RCI(Long) and RCI(Long) is below zero line
-RCI(Short) crosses under RCI(Middle)
-RCI(Middle) crosses under RCI(Long) and RCI(Long) is below zero line
-RCI(Short) crosses under RCI(Long) and RCI(Long) is below zero line
With signal sensitivity “Advanced” selected, signals will be displayed when conditions above are met above upper band or below lower band.
Advanced mode is more suitable to aim bigger trend while standard mode is for short term up/down movement.
Signal sensitivity is designed for users to select depending on their trading style(Day trading, swing trading, scalping) and strategy.
Once strategic signals triggered, prepare for trend reversal, observing price action.
The two charts below describe how different signal sensitivity makes.
Sample chart(Standard)
RCI(middle, dark blue) and RCI(long,magenta) cross signals are displayed as an example
Sample chart(Advanced)
RCI(middle, dark blue) and RCI(long,magenta) cross signals are displayed as an example
As you can see, advanced mode is more suitable to aim big movement as RCI cross happens after maximum stretch, while standard is good to catch smaller wave.
2.Alert when signals triggered
Alert can be set with above-mentioned signal conditions.
3.Auto divergence drawing
Divergence line will be automatically drawn as per the logic below.
Also, users can select which RCI line(Short/middle/long) will be targeted to detect divergence.
Bearish : When two consecutive pivot highs go up but RCI values corresponding to each high go down.
Bullish: When two consecutive pivot lows go down but RCI values corresponding to each low go up.
Pivot highs(lows) are identified when those are preceded by n lower highs(lows) and proceeded by n lower highs(lows).
* n is parameterized.
See the diagram below.
How to access this indicator?
This indicator is paid and invited-only indicator.
Please see the instruction below.
Comment section is only for comments on the indicator or updates. Please refrain from contacting me using comments to follow TradingView house rules.
———————————————————————————————————————
多機能RCIインジケーターです。以下の機能が搭載されています。
1.複数タイプのシグナル表示(シグナル感度制御付き)
2.アラート設定
3.ダイバージェンス自動描画
RCIとは?
RCIはRSIやストキャスティクスと同様に買われすぎ・売られすぎを数値化するオシレーター系インジケーターの一つです。
RSIやストキャスティクスが価格軸だけを元に買われすぎ・売られすぎを数値化するのに対して、RCIは価格と時間軸の双方を考慮して買われすぎ・売られすぎを数値化するという違いがあります。
機能詳細は以下の通りです。
機能詳細
1.複数タイプのシグナル表示(シグナル感度制御付き)
3本のRCIとアッパーバンド・ロワーバンドとの交差条件で異なるシグナルを表示することができます。
このインジケーターには以下の2つのタイプのシグナルが存在します。
A. 買われすぎ/売られすぎシグナル
B. ストラテジーシグナル
A. 買われすぎ/売られすぎシグナル
RCIと買われすぎ・売られすぎの水準であるアッパーバンドとロワーバンドとのクロスでシグナルを表示します。
条件:
RCI(短期)がアッパーバンドを上抜いた時または下抜いた時
RCI(短期)がロワーバンドを下抜いた時または上抜いた時
RCI(中期)がアッパーバンドを上抜いた時または下抜いた時
RCI(中期)がロワーバンドを下抜いた時または上抜いた時
RCI(長期)がアッパーバンドを上抜いた時または下抜いた時
RCI(長期)がロワーバンドを下抜いた時または上抜いた時
アッパーバンドとロワーバンドはパラメータ設定可能です。(初期値は80と-80%)
<使い方>
A.アッパーバンドの上抜け/ロワーバンドの下抜け
トレンドの過熱感・成熟度の判断に使用。一般的にはトレンドが成熟しきった後に天井圏や底値圏を形成し、その後トレンド転換が発生します。
b.アッパーバンドの下抜け/ロワーバンドの上抜け
トレンド転換のタイミングを図るのに使用。
サンプルチャート
RCI中期(青)・長期(マゼンタ)が上下バンドを上抜いた時、下抜いた時
B. ストラテジーシグナル
3本のRCIの交差条件で発生するこのシグナルは相場の反転が期待できるシグナルということで、よりトレード機会の判断に向いています。
またシグナル発生の感度を、StandardとAdvancedの二つから選択することができます。
シグナル条件:
<シグナル感度: Standard>
<上昇示唆>
RCI(短期)がRCI(中期)を上抜いた時
RCI(中期)がRCI(長期)を上抜いた時かつ、RCI(長期)がゼロラインより下にある時※
RCI(短期)がRCI(長期)を上抜いた時かつ、RCI(長期)がゼロラインより下にある時
※ノイズを除去するため
<下落示唆>
RCI(短期)がRCI(中期)を下抜いた時
RCI(中期)がRCI(長期)を下抜いた時かつ、RCI(長期)がゼロラインより上にある時
RCI(短期)がRCI(長期)を下抜いた時かつ、RCI(長期)がゼロラインより上にある時
<シグナル感度: Advanced>
Advancedの場合は、RCIがアッパーバンドより上にある状態で上記の条件が満たされるか、ロワーバンドより下にある状態で上記条件が満たされた場合にのみシグナルが表示されます。
Advancedはよりトレンドの転換や大きな波を狙うのに適したものであるのに対し、Standardはより細かい動きを狙うためのシグナルとなるように設計しています。
この辺りの好みはトレードスタイルや狙いに応じて異なるため、トレーダーが各自選択できるように汎用的な作りとなっているのが特徴です。
ストラテジーシグナルが現れたらトレンド転換の可能性に備え、プライスアクションを見ながらトレードタイミングの判断を行います。
以下の二つのチャートでStandardとAdvancedモードで発せられるシグナルの違いが確認できます。
サンプルチャート(Standard モード)
中期RCI(青)と長期RCI(マゼンタ)の交差
サンプルチャート(Advanced モード)
中期RCI(青)と長期RCI(マゼンタ)の交差
AdvancedモードではRCIが最大限伸びたところからの交差を捉えているため、より大きな波を捉えられる一方で、Standardモードではより細かい波を捉えられることが確認できます。
3.ダイバージェンス自動描画機能
以下のロジックに基づきダイバージェンスを自動描画します。(初期表示:非表示)
下降示唆:2つの連続する高値(*)が切り上げられているが、 それぞれの高値に対応するRCIの値は切り下げている場合
上昇示唆:2つの連続する安値(*)が切り下がっているが、 それぞれの安値に対応するRCIは切り上がっている場合
*高値(安値)は、左右n本(**)ずつのローソク足の高値(安値)より高い(低い)高値(安値)をピボットハイ・ローとして算出しています。
** nはユーザ設定値です。
サンプルチャート
高値PL1はPL1の安値より左側にn個のより低い安値、右側にn個のより低い安値があった場合に安値として認識されます。
上記の例では安値がPL1>PL2と切り下がっていますが、対応するRCIの値はvalue1

Favorite Signals w/EMA FilterThe script combines my favorite signals then filters them with three EMAs.
Via the Style tab, you can choose to either have the signals color the bar and/or plot a shape above/below.
All signals can be turned off via the Inputs tab, which will remove the bar color and/or shape (if not already off in the Style tab) as well as remove the pattern from the alerts function.
Remember when using TV alerts, if you change the script settngs, you must create a new alert if you wish to be alerted for the changes you've made.
LONG/SHORT SIGNALS INCLUDED FOR:
- TD8s
- TD9s
- Hammer
- Shooting Star
- Bullish Harami
- Bearish Harami
- RSI Divergences
EMA FILTER LOGIC LONGS:
- Price < Fast EMA & Med EMA > Slow EMA = Possible Long Entry
- Price > Fast EMA & Med EMA > Slow EMA = Possible Reversal, Tighten Stop or Reduce Position
EMA FILTER LOGIC SHORTS:
- Price > Fast EMA & Med EMA < Slow EMA = Possible Short Entry
- Price < Fast EMA & Med EMA < Slow EMA = Possible Reversal, Tighten Stop/Reduce Position
Big up to @spdoinkal, @HPotter, @LonesomeTheBlue, for writing the originals scripts for the signals above.
Enjoy!
Sentiment Estimator [AstrideUnicorn]Sentiment Estimator is an indicator that estimates market sentiment using only its pricing data. It counts bullish and bearish candles in a rolling window and calculates their relative values as percentages of the total amount of candles in the window. Market sentiment shows the direction in which the market is biased to move or the current trend direction. Extreme values of the market sentiment are contrarian signals. When the market sentiment is too bullish, it is time to sell and vice versa.
HOW TO USE
Sentiment Estimator plots a pair of green and red circles for each candle. They represent bullish and bearish sentiments, respectively.
The vertical positions of the circles show corresponding sentiment values in percentage units. For example, if a green circle's height is 60, the market is 60% bullish. In this case, the red circle's height will be 40, as bullish and bearish parts of the market sentiment sum to 100%.
The blue line plotted at the 50% level shows the neutral sentiment level. If a green circle is above the blue line, the prevailing market sentiment at that time is bullish, and the market is biased to move up. If a red one is above, the market has predominantly bearish sentiment and is prone to move down.
The red level shows extreme sentiment level. If a green or red circle is above this line, it means that the market is extremely bullish or bearish, respectively. It is a contrarian signal, and one can expect a reversal soon. In this case, a blue label with the text "reversal expected" is shown.
SETTINGS
Timeframe - allows choosing a timeframe other than the chart's one for the indicator calculation.
Look-Back Window - sets the historical window length used to perform the calculations. You can adjust the window to get the best results for a particular market or timeframe.

[Fedra Algotrading Strategy Futures Signals]Linear Regression + Take Profit and Percentage Stop Loss
Optimize the parameters in backtesting to find the best entries, define your profit and risk strategy, take advantage of statistics and make trades without letting the psychological factor make you commit mistakes.
The strategy chooses the time to buy when the price breaks down the deviation of the linear regression calculated on the basis of the last lows prices and allows you to generate alerts.
It also includes an emergency exit at Break Even (1.5%) when it detects a negative trend in the short term.
It also has an advanced trend filter to avoid opening trades against the market.
*************************************
Regresión lineal + Take Profit y Stop loss porcentual
Optimice los parámetros en backtesting para encontrar las mejores entradas, defina su estrategia de profit y riesgo, apreveche las estadísticas y haga operaciones son dejar que el factor psicológico le haga cometer errores.
La estrategia elige el momento de compra cuando el precio rompe hacia abajo la desviación de la regresión lineal calculada en base a lows últimos precios y permite generar alertas.
También incluye una salida de emergencia en Break Even (1.5%) cuando detecta una tendencia negativa en el corto plazo.
Tiene también un filtro avanzado de tendencia para no abrir operaciones en contra del mercado.
CryptoGraph 3.2CryptoGraph 3.2 is an extensive version of CryptoGraph 3.
CryptoGraph 3.2 is based on 4 VWAP oscillator timeframes instead of 3.
What does it do?
CryptoGraph 3.2 visualises four different VWAPs based on four different timeframes.
- Whenever all four timeframes are increasing (this can either be above or below the 0 line), a green dot will be printed.
A green dot generally is a bullish indication.
- Whenever all four timeframes are decreasing (this can either be above or below the 0 line), a red dot will be printed.
A red dot generally is a bearish indication.
- Whenever all four timeframes have crossed above the 0 line, a green triangle will be printed.
A green triangle generally is a bullish indication.
- Whenever all four timeframes have crossed below the 0 line, a red triangle will be printed.
A red triangle generally is a bearish indication.
- Whenever the second timeframe switches from upward direction to downward, a green x will be printed.
A green x generally is a take profit indication for a long position.
- Whenever the second timeframe switches from downward direction to upward, a red x will be printed.
A red x generally is a take profit indication for a short position.
The green and red x's are by default set to 0% opacity so they won't be visible. Make sure to increase the opacity to have them visible on your chart.

BB+RSI+EMA BUY/SELL SignalsBINANCE:BTCUSDT
* * * TESTED ON BTCUSDT 4H CHART * * *
The indicator gives signals based on candles touching BB lines and RSI oversold/overbought conditions, also a 200 EMA filter is used to trade following the major trend.
Only LONG signals are given.
Signals are divided in 3 categories based on their strenght:
- Weak BUY/SELL (green/red circles on chart)
- normal BUY/SELL (green/red triangles with "BUY" or "SELL" text on chart)
- strong BUY/SELL (green/red labels with "STRONG BUY" or "STRONG SELL" text on chart)
You can use signals from the same category as triggers for entering or exiting a trade or you can try using signals from different categories
All indicators settings can be costumized
Every signal label can be turned ON/OFF
EMA that changes color based on last candle close can be turned ON/OFF
Alerts can be set for:
- General Signals (every signal will trigger it)
- Weak Signals (only weak signals will trigger it)
- Normal Signals (only normal signals will trigger it)
- Strong Signals (only strong signals will trigger it)

CryptoGraph MA DivergenceCryptoGraph MA Divergence is a multifunctional trading tool that identifies aspects of trend trading.
The indicator is based on moving averages, transformed into an oscillator. This way it becomes possible to get a better visualisation of MA's relative to each other, and more importantly, it enables us to spot divergences based on MA's.
This simply yet effective enhancement wasn't seen before as an oscillator, so I decided to make and share it.
Features of the indicator:
- Blue/Purple wave (Based on Moving Averages)
- White line (Average of Blue/Purple Wave)
- Green/Red Dots (Trend reversals)
- Red/Green lines (Wider red and green lines are regular divergences, thinner red and green lines are hidden divergences)
What to look for?
- A red or green dot may be a very early indication of a trend reversal, in times of consolidation they cluster together. Use other CryptoGraph indicators to filter these dot clusters.
- Blue/Purple wave crossing 0 line.
- Divergences. Divergences are automatically spotted in the indicator. HOWEVER, always try to find them manually, since the indicator won't be able to spot them all automatically.
For access contact me through TradingView or Discord.

NEXT Stochastic 3xVW (Triple Volume Weighted)Overview:
This responsive version of the Stochastic oscillator modifies and extends the original to incorporate volume. It does so on 2 levels: by using Volume-Weighted Moving Average (VWMA) as input and applying a triple volume weighting filter within the internal algorithm, intelligently blending volume with what is otherwise pure momentum/distribution analysis. The result is more binary-like curve behavior (%K and %D oscillator lines), whose polarizing movement acts as both a signal and filter.
Below is a screenshot comparing NEXT Stochastic 3xVW with default settings to the original Stochastic oscillator on NQ M1 chart.
Application and Strategy Ideas:
NEXT Stochastic 3xVW is intended to be used like the original Stochastic oscillator within the context of technical analysis: identifying overvalued (above upper limit) and undervalued (below lower limit) price action, as well as establishing a bias baseline (bullish if over 50; bearish if under 50). Higher NEXT Stochastic 3xVW bottoms compared to lower price bottoms signify bullish divergence; lower NEXT Stochastic 3xVW tops compared to higher price tops signify bearish divergence. Trading %K/%D line crossing is also a popular strategy, with %K crossing over %D indicating bullish sentiment and %K crossing under %D indicating bearish sentiment.
Below is a screenshot showing NEXT Stochastic 3xVW overbought/oversold intraday strategy on SPY M1 chart. NEXT Stochastic 3xVW is set to 5,10,1,3 with long signal issued at lower limit of 30 and short at upper limit of 70.
Input Parameters:
VWMA Length - controls the averaging length of the volume-weighted moving average (based on close price and volume); used as Stochastic input
%K Length - volume-driven averaging length of the %K oscillator line - this is the faster of the two Stochastic lines
%K Smoothing - volume-driven smoothing factor of the %K line
%D Smoothing - volume-driven averaging length of the %D oscillator line (a %K derivative, post smoothing) - this is the slower of the two Stochastic lines
Upper Limit - the NEXT Stochastic 3xVW level above which market is considered overbought, default is 80
Base Bias - the NEXT Stochastic 3xVW level above which market bias is considered bullish, and below bearish
Lower Limit - the NEXT Stochastic 3xVW level below which market is considered oversold, default is 20
Signals and Alerts:
Discover and visualize NEXT Stochastic 3xVW strategies using the companion NEXT Strategy Visualizer indicator. While the %K/%D cross alerts can be set via NEXT Stochastic 3xVW indicator, the Strategy Visualizer will only plot long/short signals when %K or %D cross over or under overbought/oversold levels (as hown in the above SPY M1 screenshot). That being said, the next version of the Strategy Visualizer will also support %K/%D crosses.
Here is how to set NEXT Stochastic 3xVW %K/%D crossing alerts: open a chart, attach NEXT Stochastic 3xVW, and right-click on chart -> Add Alert. Condition: Next Stochastic >> %K >> Crossing >> Next Stochastic >> %D

M.Right Bulls-V-Bears -Tug-of-War- SquidGame Themed(cc)Hello Traders,
I've decided to finally release an indicator I've spent several hours working to get just right and as far as I know, there isn’t one as accurate. And.... decided to add a little Squid Game theme to it just for fun.
……"The game is Tug of War, the side that pulls the rope from the middle to their side wins. Let the game begin."……
This indicator is not a typical one.
1) It shows visually when Bull volume or Bear volume is ‘pulling the rope to their side’.
2) It uses several different formulas to get an accurate read on the level of volume, but still keeps peaks and troughs within 100 for easy reading.
3) Update: It was originally meant to be used strictly with other indicators, but it can now be used as a standalone indicator.
Legend:
1) The top line signals give the major signals –
a. Red cross = Bearish volume strength and continuation.
b. Green cross = Bullish volume strength and continuation.
i. + Green Dot inside enhances signal.
ii. + Red Dot inside weakens signal.
c. Blue circle = Can indicate the beginning of a reversal to the upside or downside.
d. Pink circle = Can indicate the beginning of a reversal to the downside.
2) The Bottom signals are triggered when one circle-rope crosses over the other, these signals give confirmation to the top line signals – Red bearish / Green bullish.
3) As shown on the chart, the Reversal setup usually consists of a blue circle, followed by a red or green cross, then confirmation from the bottom signal.
4) Without the signals: green obviously is Bullish especially above the threshold set --Red bearish. The regular rope gives trend indication.
I've added tooltips to make it easy to understand, feel free to leave a comment if you still have a question!
Features:
-Tooltips (hover over - Info) for understanding.
-Works well on all timeframes; even 5min, I made a tooltip for recommended lengths.
-Customizable Signals; with the ability to turn on and off.
-Reversal signals: Pink and Blue circles can indicate reversals coming.
-Works well as a leading standalone indicator.
-Adjustable top signal row.
-Highlight background.
-Alerts
-Rules added (hover over).
Cheers,
Mike

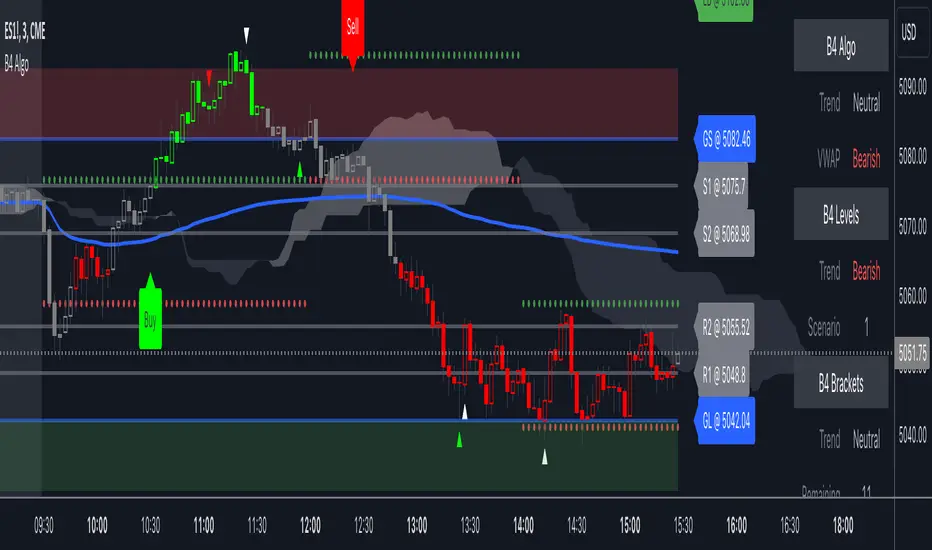
B4Signals Algo PremiumB4Signals Algo indicator is made up of more than 7+ innovative indicators carefully designed to generate high probability buy and sell signals while reducing risk. It derives its entries and exits from the B4Signals Indicator with added trend detection and volatility containment.
B4Signals Algo indicator detects the direction of trends for any asset and on any timeframe allowing traders to increase their confidence in positions, follow trends and stay in positions longer. Profit taking is up to the trader.
B4Signals Algo features:
Automatically generated buy and sell signals
Algo model selection in settings
Algo sensitivity selection in settings
Background chart shading for market hours
B4Signals Algo has two modes to choose from; each with an aggressive and a conservative approach to trading:
Algo 1 - Aggressive = Aims to detect very early trends, and is thus more reactive. Developed to catch both short term and long term trend reversal and provide clarity in the current trend direction. This setting attempts to make it easier to come in early in a new trend as well as to stay longer in that trend.
Algo 1 - Conservative = Aims to detect trend continuation where the stock price is likely to keep its current trend.
Algo 2 - Aggressive = Aims to detect very early confirmed trends, and is thus more reactive. Developed to catch both confirmed short term and confirmed long term trend reversals and provide confirmation in the current trend direction.
Algo 2 - Conservative = Aims to detect very early confirmed trends in conjunction with a filter to keep out false or choppy signals to leave the most accurate ones.
Disclaimer
Copyright by B4Signals.
The information contained in our scripts/indicators/ideas does not constitute financial advice or a solicitation to buy or sell any securities of any type. We will not accept liability for any loss or damage, including without limitation any loss of profit, which may arise directly or indirectly from the use of or reliance on such information.
All investments involve risk, and the past performance of a security, industry, sector, market, financial product, trading strategy, or individual’s trading does not guarantee future results or returns. Investors are fully responsible for any investment decisions they make. Such decisions should be based solely on an evaluation of their financial circumstances, investment objectives, risk tolerance, and liquidity needs.
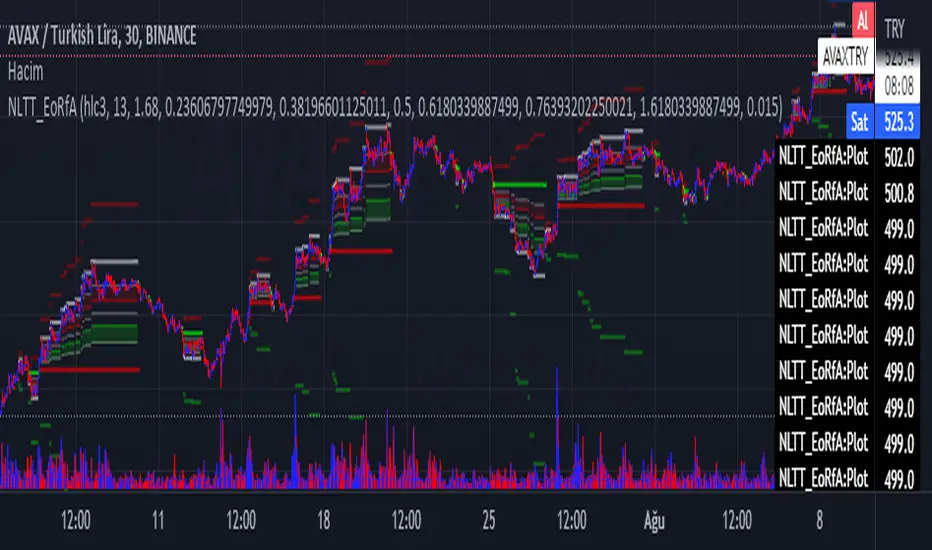
No-lose trading targets (Based on EoRfA) By Mustafa ÖZVERThis code shows expected reaction target prices after sudden moving based on (EoRfA) Escaping of Rate from Avarage. Red area means the price is on overbought area, green area means the price is on oversold area. If you see red area under price, you can make short option to next to the horizontal beginning price of red area. If you see green area over price, you can make long option to next to the horizontal beginning price of green area.
When this code works
- The green area starts where EoRfA value is on oversold
- The red area starts where EoRfA value is on overbought
Of course, this code may be failed, do not forget the target may never come. But hopefully price will cross over the target.
And you (as developers) can develop this code by using anything instead of EoRfA to get up-down target prices.
But only this values can not guarantee good results for trading. BE CAREFUL
Zendog LONG DCA Trigger RSI+StochRSIThis is a script that generates a BUY signal by combining RSI and Stochastic RSI into the same script and that can easily be integrated into an external Backtester like the one I published.
The script uses default values for RSI and Stochastic RSI oversold conditions.
They should be adjusted for specific assets and timeframes so they better match the current trend. Please beware you might overfit settings to match a short timeframe trend (like a few days or hours). If this is the case once the trend changes the signals will not be accurate.
The purpose of this script is to provide some pine code that can be used to further combine multiple indicators into a LONG Deal Start signal.
Integration with the Zendog Backtster:
- add the backtester on the chart
- add this script on the chart
- in the Zendog backtester Deal start type select "External indicator"
- in the Zendog backtester Indicator source and value select "Zendog LONG DCA Trigger RSI+StochRSI: SIGNAL"

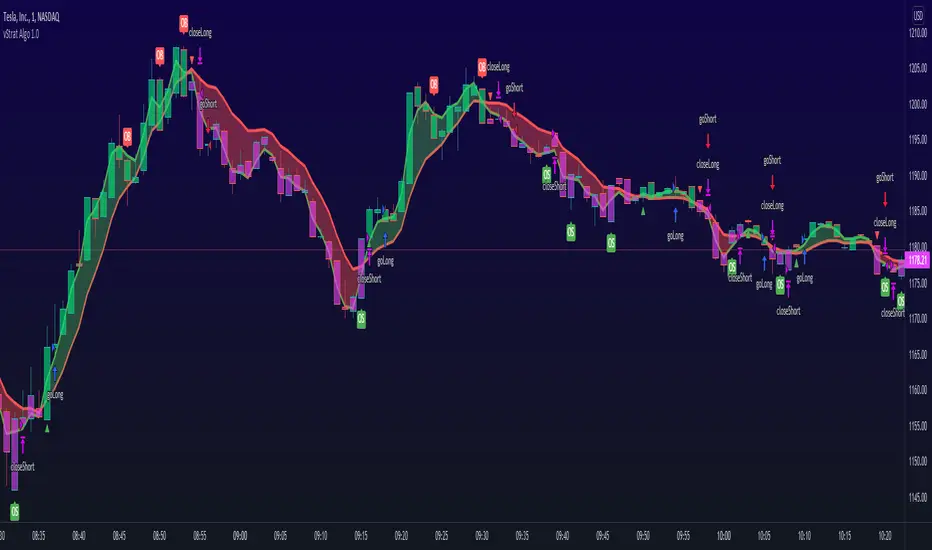
vStrat Algo 1.0 (BETA)vStrat Algo 1.0
The Very First Scalping/Intraday Trading Algo for Options
Note: If you have any favorite indicators that you use regularly and are helpful, feel free to use them in conjunction to this strategy.
Legend:
long = buy call
short = buy put
close entry = sell call/put
BULL = bullish engulfing
BEAR = bearish engulfing
OS = oversold
OB = overbought
Instructions:
1. You can choose to watch the 3 minute or 5 minute chart but be aware of the Pro’s and Con’s. It’s not recommended to use this strategy on the 1 minute chart, but this works on higher timeframes. Keep in mind that the signals will vary on each timeframe.
3 minute 5 minute
i.ibb.co i.ibb.co
2. It’s best to use this strategy right at market open. If a “long” (buy CALLS) or “short” (buy PUTS) signal was given at pre-market, I do not recommend taking it. Only take signals once the market opens. If you really wish to take the signal that was given 1-5 minutes before the market opened, you most definitely can, but its’s just riskier. What I would do is, wait 3-10 minutes after market open and if one Moving Average is respecting the other and holding above or below it, you can enter especially if the blow is bullish, the vStrat Algo 1.0 will also tell you if the candles are bearish or bullish. Use your best judgement.
i.ibb.co [
3. You do not have to wait for the exit signal, everyone's risk management is different so take profits whenever you're green or hold as long as the short-term MA is still trending above or below the long-term MA and is not touching or bouncing off it.
i.ibb.co
4. Avoid taking any signals from 11:30 AM ET - 2:30 PM ET, when stocks are trading sideways since the algo’s stop losses get triggered here due to the low volume.
i.ibb.co
5. Lastly, there is no magic indicator or strategy, this algorithm is designed based on multiple conditions. Each signal gets triggered when ALL the conditions are met. This strategy is based off advanced moving averages, one that reduces lag and responds quicker than the simple and exponential ones, RSI value, S/R, pivot points, and a few others. I’m always looking for ways to improve this scalping algorithm so rest assured any complaints or suggestions will be taken and fixed as timely as possible. For best results, avoid trading with your emotions. If you’re a new user, open a small position, set a stop loss, and let the algorithm decide how you will trade it for that day. Keep doing this until you get more familiar with the script then slowly increase your position sizing, but do not invest money you can’t afford to lose. Play with the settings, change the lengths if you wish, but the script was created to provide the most accurate signals as it is. If you do decide to change these inputs, the signals will also be different. Take profits whenever you see fit, the goal is to have a green day and grow your account slowly but surely. If you make a profit, do not risk giving your money back to the market by overtrading. Always do your own due diligence and use your best judgement. Good luck, Traders!
DISCLAIMER : All information found here, including any ideas, opinions, views, predictions, forecasts, commentaries, suggestions, or stock picks, expressed, or implied herein, are for informational, entertainment or educational purposes only and should not be construed as personal investment advice. While the information provided is believed to be accurate, it may include errors or inaccuracies. Conduct your own due diligence or consult a licensed financial advisor or broker before making any and all investment decisions. Any investments, trades, speculations, or decisions made on the basis of any information found on this site, expressed, or implied herein, are committed at your own risk, financial or otherwise.