How to automate this strategy for free using a chrome extension.Hey everyone,
Recently we developed a chrome extension for automating TradingView strategies using the alerts they provide. Initially we were charging a monthly fee for the extension, but we have now decided to make it FREE for everyone. So to display the power of automating strategies via TradingView, we figured we would also provide a profitable strategy along with the custom alert script and commands for the alerts so you can easily cut and paste to begin trading for profit while you sleep.
Step 1:
You are going to need to download the Chrome Extension called AutoView. You can get the extension for free by following this link: bit.ly ( I had to shorten the link as it contains Google and TV automatically converts it to a symbol)
Step 2: Go to your chrome extension page, and under the new extension you'll see a "settings" button. In the setting you will have to connect and give permission to the exchange 1broker allowing the extension to place your orders automatically when triggered by an alert.
Step 3: Setup the strategy and custom script for the alerts in TradingView. The attached script is the strategy, you can play with the settings yourself to try and get better numbers/performance if you please.
This following script is for the custom alerts:
//@version=2
study("4All-Alert", shorttitle="Alerts")
src = close
len = input(4, minval=1, title="Length")
up = rma(max(change(src), 0), len)
down = rma(-min(change(src), 0), len)
rsi = down == 0 ? 100 : up == 0 ? 0 : 100 - (100 / (1 + up / down))
rsin = input(5)
sn = 100 - rsin
ln = 0 + rsin
short = crossover(rsi, sn) ? 1 : 0
long = crossunder(rsi, ln) ? 1 : 0
plot(long, "Long", color=green)
plot(short, "Short", color=red)
Now that you have the extension installed, the custom strategy and alert scripts in place, you simply need to create the alerts.
To get the alerts to communicate with the extension properly, there is a specific syntax that you will need to put in the message of the alert. You can find more details about the syntax here : gist.github.com
For this specific strategy, I use the Alerts script, long/short greater than 0.9 on close.
In the message for a long place this as your message:
Long
c=order b=short
c=position b=short l=200 t=market
b=long q=0.01 l=200 t=market tp=13 sl=25
and for the short...
Short
c=order b=long
c=position b=long l=200 t=market
b=short q=0.01 l=200 t=market tp=13 sl=25
If you'll notice in my above messages, compared to the strategy my tp and sl (take profit and stop loss) vary by a few pips. This is to cover the market opens and spread on 1broker. You can change the tp and sl in the strategy to the above and see that the overall profit will not vary much at all.
I hope this all makes sense and it is enough to not only make some people money, but to show the power of coming up with your own strategy and automating it using TradingView alerts and the free Chrome Extension AutoView.
ps. I highly recommend upgrading your TradingView account so you have access to back testing and multiple alerts.
There is really no reason you won't cover the cost and then some on a monthly basis using the tools provided.
Best of luck and happy trading.
Note: The extension currently allows for automation on 2 exchanges; 1broker and Okcoin. If you do not have accounts there, we'd appreciate you signing up using our referral links.
www.okcoin.com
1broker.com
Strategy

Stochastic + RSI, Double Strategy (by ChartArt)This strategy combines the classic RSI strategy to sell when the RSI increases over 70 (or to buy when it falls below 30), with the classic Stochastic Slow strategy to sell when the Stochastic oscillator exceeds the value of 80 (and to buy when this value is below 20).
This simple strategy only triggers when both the RSI and the Stochastic are together in a overbought or oversold condition. The one hour chart of the S&P 500 worked quite well recently with this double strategy.
By the way this strategy should not be confused with the 'Stochastic RSI', which measures the RSI only.
All trading involves high risk; past performance is not necessarily indicative of future results.

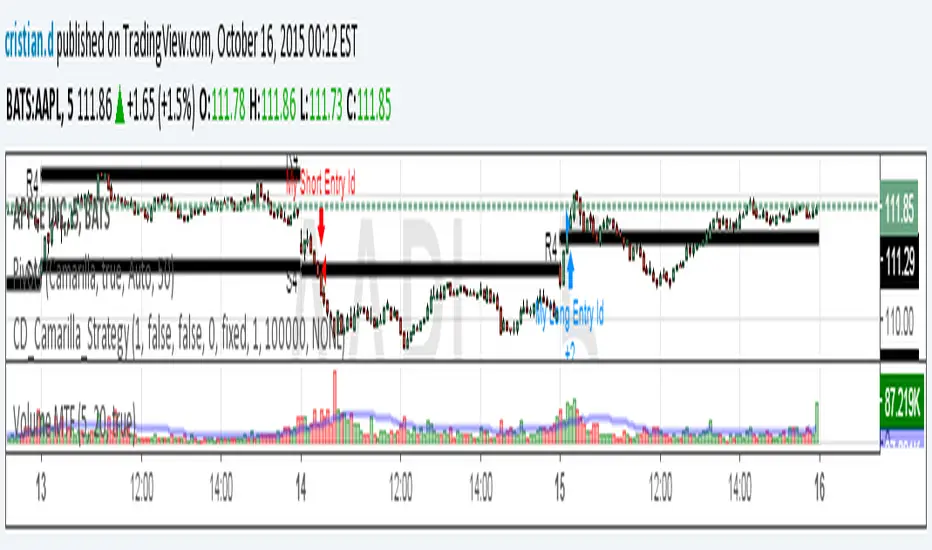
Camarilla Strategy - breakouts of H4 and L4Breakout strategy of H4 and L4 levels. Manual entries and exits - higher profits BUT because I am a novice in pinescript,
Can someone please:
1. Show me how to add exit strategy lines : close> ema(close,3) for exit short and opposite for long. I added myself but I can't make it to work in relation to camarilla entries; instead it shows all ema crossings..
2.Why some entries over/above my pivots are not shown.. Example:11.15 AM (short) and 13.10 PM (long) AAPL, October 15, today? Today would've been 3 signals, not one..
Thank you in advance for any advice. I am a strong Camarilla follower, but I am not a coder.
4H CCI Strategy 1.5Included adaptive lot size based on ATR, and also ATR based stop and take profit levels.
Risk/reward increased to 1:2 and should work in all ranging FX pairs as long as they are not trending.
Once the market starts trending it'll eat this bot alive.
Cheers,
Ivan Labrie
Time at Mode FX

4H CCI Strategy 1.4Here's the last version...quick hack job.
I'm sure it can be improved, but this is a rough sketch, code wise.
The strategy works in range bound enviroments, so cointegrated pairs like AUDCAD will shine with it.
Cheers,
Ivan Labrie
Time at Mode FX

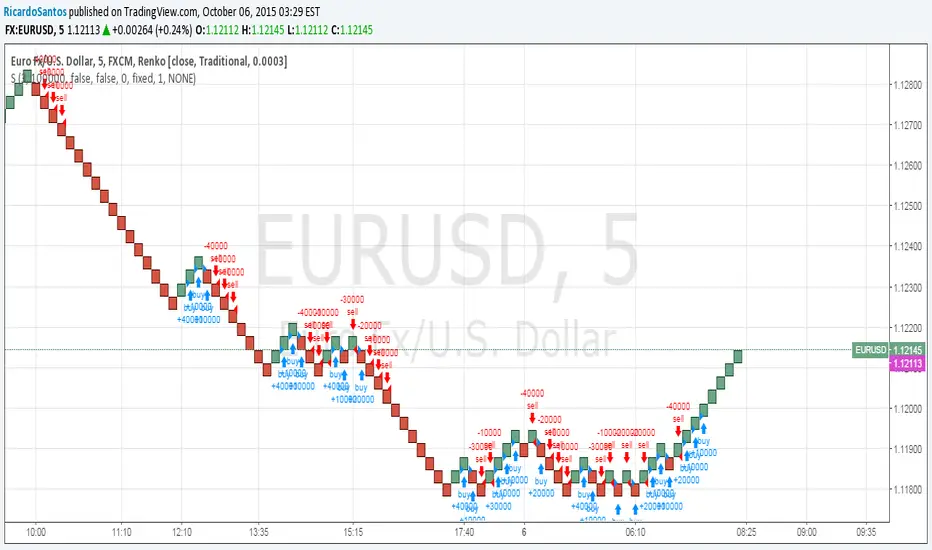
[STRATEGY][RS]The Illusion Strategy V0EXPERIMENTAL:
WARNING: this strategy does not work!!
one of the fallacy's of backtesting, renko chars signals usually will give signals when price is allready out of range.