Apex Wallet - Ultimate Multi-Oscillator (9-in-1) & Market TrendThe Apex Wallet Multi-Oscillator is a powerful "All-in-One" technical analysis tool designed to clean up your charts by combining nine of the most effective momentum and trend indicators into a single workspace. This script is engineered to adapt to different trading styles—Scalping, Day-Trading, or Swing-Trading—with a single click.
+4
Whether you are looking for trend exhaustion, momentum shifts, or volatility breakouts, this indicator provides a clear, visual summary of market dynamics.
+1
Key Features
9 Indicators in 1: Access RSI, Stochastic, StochRSI, MACD, Zero-Lag MACD, Andean Oscillator, and the Traders Dynamic Index (TDI).
+1
Smart Layout Modes:
Raw (Brut): Classic view with original values.
+1
Stacked (Empilé): Organizes indicators into fixed vertical zones to prevent overlapping.
+1
Proportional Stacking: Automatically calculates and adjusts the height of blocks based on active oscillators.
+2
Trading Presets: Switch between Scalping, Day-Trading, and Swing-Trading modes. The script automatically adjusts periods and lengths (e.g., RSI 7 for Scalping vs. 21 for Swing) to match the market speed.
+3
Included Oscillators
Stochastic & RSI: Standard momentum tools with color-coded signals.
Traders Dynamic Index (TDI): A full suite including the RSI Price Line, Signal Line, and Market Base Line with optional Bollinger Bandwidth columns.
+1
MACD & Zero-Lag MACD: Includes histogram fills and trend-colored lines for faster reaction to price movement.
+2
Andean Oscillator: An advanced tool to identify Bull/Bear dominance and market "Range" or "Reversal" states.
Visual Signals & Alerts
Market Trend: Optional visual coloring based on indicator crosses to quickly spot bullish or bearish momentum.
+3
Customizable UI: High-fidelity rendering with dashed levels and proportional fills for a professional, clean interface.
+1
Integrated Alerts: Pre-configured alerts for Andean Oscillator trend changes (Bullish, Bearish, or Reversal).
How to use
Select your Trading Mode in the settings based on your timeframe.
Toggle the indicators you want to see.
Use the Stacked mode if you want to keep your sub-window organized without lines crossing each other.
TDI

TDI Fibonacci Volatility Bands Candle Coloring [cryptalent]"This is an advanced Traders Dynamic Index (TDI) candle coloring system, designed for traders seeking precise dynamic analysis. Unlike traditional TDI, which typically relies on a 50 midline with a single standard deviation band (±1 SD), this indicator innovatively incorporates Fibonacci golden ratio multiples (1.618, 2.618, 3.618 times standard deviation) to create multi-layered dynamic bands. It precisely divides the RSI fast line (green line) position into five distinct strength zones, instantly reflecting them on the candle colors, allowing you to grasp market sentiment in real-time without switching to a sub-chart.
Core Calculation Logic:
RSI Period (default 20), Band Length (default 50), and Fast MA Smoothing Period (default 1) are all adjustable.
The midline is the Simple Moving Average (SMA) of RSI, with upper and lower bands calculated by multiplying Fibonacci multiples with Standard Deviation (STDEV), generating three dynamic band sets: 1.618, 2.618, and 3.618.
Traders can quickly identify the following scenarios:
Extreme Overbought Zone (Strong Bullish, Red): Fast line exceeds custom threshold (default 82) and breaks above the specified band (default 2.618). This often signals overheating, potentially a profit-taking point or reversal short entry, especially at trend tops.
Extreme Oversold Zone (Strong Bearish, Green): Fast line drops below custom threshold (default 28) and breaks below the specified band (default 2.618). This is a potential strong rebound starting point, ideal for bottom-fishing or long entries.
Medium Bullish Zone (Yellow): Fast line surpasses medium threshold (default 66) and stands above the specified band (default 1.618), indicating bullish dominance in trend continuation.
Medium Bearish Zone (Orange): Fast line falls below medium threshold (default 33) and breaks below the specified band (default 1.618), signaling bearish control in segment transitions.
Neutral Zone (No Color Change): Fast line within custom upper and lower limits (default 34~65), retaining original candle colors to avoid noise interference during consolidation.
Color priority logic flows from strong to weak (Extreme > Medium > Neutral), ensuring no conflicts. All parameters are highly customizable, including thresholds, band selections (1.618/2.618/3.618/Midline/None), color schemes, and even optional semi-transparent background coloring (default off, transparency 90%) for enhanced visual layering.
Applicable Scenarios:
Intraday Trading: Capture extreme color shifts as entry/exit signals.
Swing Trading: Use medium colors to confirm trend extensions.
Long-Term Trend Following: Filter noise in neutral zones to focus on major trends.
Supports various markets like forex, stocks, and cryptocurrencies. After installation, adjust parameters in settings to match your strategy, and combine with other indicators like moving averages or support/resistance for improved accuracy.
If you're a TDI enthusiast, this will make your trading more intuitive and efficient!

Machine Learning: Optimal RSI [YinYangAlgorithms]This Indicator, will rate multiple different lengths of RSIs to determine which RSI to RSI MA cross produced the highest profit within the lookback span. This ‘Optimal RSI’ is then passed back, and if toggled will then be thrown into a Machine Learning calculation. You have the option to Filter RSI and RSI MA’s within the Machine Learning calculation. What this does is, only other Optimal RSI’s which are in the same bullish or bearish direction (is the RSI above or below the RSI MA) will be added to the calculation.
You can either (by default) use a Simple Average; which is essentially just a Mean of all the Optimal RSI’s with a length of Machine Learning. Or, you can opt to use a k-Nearest Neighbour (KNN) calculation which takes a Fast and Slow Speed. We essentially turn the Optimal RSI into a MA with different lengths and then compare the distance between the two within our KNN Function.
RSI may very well be one of the most used Indicators for identifying crucial Overbought and Oversold locations. Not only that but when it crosses its Moving Average (MA) line it may also indicate good locations to Buy and Sell. Many traders simply use the RSI with the standard length (14), however, does that mean this is the best length?
By using the length of the top performing RSI and then applying some Machine Learning logic to it, we hope to create what may be a more accurate, smooth, optimal, RSI.
Tutorial:
This is a pretty zoomed out Perspective of what the Indicator looks like with its default settings (except with Bollinger Bands and Signals disabled). If you look at the Tables above, you’ll notice, currently the Top Performing RSI Length is 13 with an Optimal Profit % of: 1.00054973. On its default settings, what it does is Scan X amount of RSI Lengths and checks for when the RSI and RSI MA cross each other. It then records the profitability of each cross to identify which length produced the overall highest crossing profitability. Whichever length produces the highest profit is then the RSI length that is used in the plots, until another length takes its place. This may result in what we deem to be the ‘Optimal RSI’ as it is an adaptive RSI which changes based on performance.
In our next example, we changed the ‘Optimal RSI Type’ from ‘All Crossings’ to ‘Extremity Crossings’. If you compare the last two examples to each other, you’ll notice some similarities, but overall they’re quite different. The reason why is, the Optimal RSI is calculated differently. When using ‘All Crossings’ everytime the RSI and RSI MA cross, we evaluate it for profit (short and long). However, with ‘Extremity Crossings’, we only evaluate it when the RSI crosses over the RSI MA and RSI <= 40 or RSI crosses under the RSI MA and RSI >= 60. We conclude the crossing when it crosses back on its opposite of the extremity, and that is how it finds its Optimal RSI.
The way we determine the Optimal RSI is crucial to calculating which length is currently optimal.
In this next example we have zoomed in a bit, and have the full default settings on. Now we have signals (which you can set alerts for), for when the RSI and RSI MA cross (green is bullish and red is bearish). We also have our Optimal RSI Bollinger Bands enabled here too. These bands allow you to see where there may be Support and Resistance within the RSI at levels that aren’t static; such as 30 and 70. The length the RSI Bollinger Bands use is the Optimal RSI Length, allowing it to likewise change in correlation to the Optimal RSI.
In the example above, we’ve zoomed out as far as the Optimal RSI Bollinger Bands go. You’ll notice, the Bollinger Bands may act as Support and Resistance locations within and outside of the RSI Mid zone (30-70). In the next example we will highlight these areas so they may be easier to see.
Circled above, you may see how many times the Optimal RSI faced Support and Resistance locations on the Bollinger Bands. These Bollinger Bands may give a second location for Support and Resistance. The key Support and Resistance may still be the 30/50/70, however the Bollinger Bands allows us to have a more adaptive, moving form of Support and Resistance. This helps to show where it may ‘bounce’ if it surpasses any of the static levels (30/50/70).
Due to the fact that this Indicator may take a long time to execute and it can throw errors for such, we have added a Setting called: Adjust Optimal RSI Lookback and RSI Count. This settings will automatically modify the Optimal RSI Lookback Length and the RSI Count based on the Time Frame you are on and the Bar Indexes that are within. For instance, if we switch to the 1 Hour Time Frame, it will adjust the length from 200->90 and RSI Count from 30->20. If this wasn’t adjusted, the Indicator would Timeout.
You may however, change the Setting ‘Adjust Optimal RSI Lookback and RSI Count’ to ‘Manual’ from ‘Auto’. This will give you control over the ‘Optimal RSI Lookback Length’ and ‘RSI Count’ within the Settings. Please note, it will likely take some “fine tuning” to find working settings without the Indicator timing out, but there are definitely times you can find better settings than our ‘Auto’ will create; especially on higher Time Frames. The Minimum our ‘Auto’ will create is:
Optimal RSI Lookback Length: 90
RSI Count: 20
The Maximum it will create is:
Optimal RSI Lookback Length: 200
RSI Count: 30
If there isn’t much bar index history, for instance, if you’re on the 1 Day and the pair is BTC/USDT you’ll get < 4000 Bar Indexes worth of data. For this reason it is possible to manually increase the settings to say:
Optimal RSI Lookback Length: 500
RSI Count: 50
But, please note, if you make it too high, it may also lead to inaccuracies.
We will conclude our Tutorial here, hopefully this has given you some insight as to how calculating our Optimal RSI and then using it within Machine Learning may create a more adaptive RSI.
Settings:
Optimal RSI:
Show Crossing Signals: Display signals where the RSI and RSI Cross.
Show Tables: Display Information Tables to show information like, Optimal RSI Length, Best Profit, New Optimal RSI Lookback Length and New RSI Count.
Show Bollinger Bands: Show RSI Bollinger Bands. These bands work like the TDI Indicator, except its length changes as it uses the current RSI Optimal Length.
Optimal RSI Type: This is how we calculate our Optimal RSI. Do we use all RSI and RSI MA Crossings or just when it crosses within the Extremities.
Adjust Optimal RSI Lookback and RSI Count: Auto means the script will automatically adjust the Optimal RSI Lookback Length and RSI Count based on the current Time Frame and Bar Index's on chart. This will attempt to stop the script from 'Taking too long to Execute'. Manual means you have full control of the Optimal RSI Lookback Length and RSI Count.
Optimal RSI Lookback Length: How far back are we looking to see which RSI length is optimal? Please note the more bars the lower this needs to be. For instance with BTC/USDT you can use 500 here on 1D but only 200 for 15 Minutes; otherwise it will timeout.
RSI Count: How many lengths are we checking? For instance, if our 'RSI Minimum Length' is 4 and this is 30, the valid RSI lengths we check is 4-34.
RSI Minimum Length: What is the RSI length we start our scans at? We are capped with RSI Count otherwise it will cause the Indicator to timeout, so we don't want to waste any processing power on irrelevant lengths.
RSI MA Length: What length are we using to calculate the optimal RSI cross' and likewise plot our RSI MA with?
Extremity Crossings RSI Backup Length: When there is no Optimal RSI (if using Extremity Crossings), which RSI should we use instead?
Machine Learning:
Use Rational Quadratics: Rationalizing our Close may be beneficial for usage within ML calculations.
Filter RSI and RSI MA: Should we filter the RSI's before usage in ML calculations? Essentially should we only use RSI data that are of the same type as our Optimal RSI? For instance if our Optimal RSI is Bullish (RSI > RSI MA), should we only use ML RSI's that are likewise bullish?
Machine Learning Type: Are we using a Simple ML Average, KNN Mean Average, KNN Exponential Average or None?
KNN Distance Type: We need to check if distance is within the KNN Min/Max distance, which distance checks are we using.
Machine Learning Length: How far back is our Machine Learning going to keep data for.
k-Nearest Neighbour (KNN) Length: How many k-Nearest Neighbours will we account for?
Fast ML Data Length: What is our Fast ML Length? This is used with our Slow Length to create our KNN Distance.
Slow ML Data Length: What is our Slow ML Length? This is used with our Fast Length to create our KNN Distance.
If you have any questions, comments, ideas or concerns please don't hesitate to contact us.
HAPPY TRADING!

[DisDev] Tactical Analysis Part III: Oscillators🟩 Introducing the Oscillators Indicator by Disruptive Developers, a revolutionary tool designed to enhance your trading strategy. This indicator is the third part of our Tactical Analysis suite, combining two oscillator indicators to provide you with a comprehensive view of market conditions.
⚡ OVERVIEW ⚡
Key Features 🔑
Combines TDI Pro - Traders Dynamic Indicator by Dean Malone and WTO - Wave Trend Oscillator
Includes MFI - Money Flow Index and MACD - Moving Average Convergence Divergence
Incorporates VWAP - Volume Weighted Average Price
Benefits 💸
Enhances trading strategy by providing comprehensive market insights
Helps determine overbought or oversold conditions in ranging markets
Assists in identifying important entry and exit points
⚙️ CONFIGURATION & SETTINGS ⚙️
Inputs 🔧
Green / Red = The RSI Price-Line (Current Price Sentiment)
Dark Red = The Signal Line (Crossover for Entry & Exit)
Yellow = Market Base Line (Overall Sentiment)
Blue = Volatility Bands (Increasing/Decreasing Volatility)
Alerts 🔔
TDI Cross Short/Long Alerts
TDI MBL Cross Short/Long Alerts
TDI Hook Short/Long Alerts
💡 USAGE & STRATEGY 💡
Trading Strategies 📈
Look for regular and hidden divergences
Identify entries and exits based on crosses with Price-Line
Align trades with market sentiment
Timeframes and Symbols ⌚
Suitable for all timeframes and symbols
Optimized for Forex trading but applicable to all markets
🤖 DETAILS & METHODOLOGY 🤖
Algorithm and Calculation 🛡️
Based on the TDI indicator created by Dean Malone
Incorporates RSI, Signal Line, Market Base Line, and Volatility Bands
Signals for regular and hidden divergences
📚 ADDITIONAL RESOURCES 📚
Tutorials and Guides 📖
Detailed user manual available on our website
Video tutorials for setup and usage
Discord community forum for user discussions and tips
Visit our website for additional information, videos and pdf’s, link can be found below.
Chart Examples 📊
Trader’s Dynamic Index (TDI): Overbought/Oversold Signals
WaveTrend/Moneyflow/VWAP (WMV) Overbought/Oversold Signals
Tactical Analysis Indicator Suite. Parts I, II, and III.
🚀 CONCLUSION 🚀
In conclusion, the Tactical Analysis Part III: Oscillators indicator by Disruptive Developers is a powerful tool that combines multiple oscillators to provide a comprehensive view of market conditions. It is designed to enhance your trading strategy and help you make more informed trading decisions.
Access Parts I and II here:
Tactical Analysis Part I: High-Volume Recovery
Tactical Analysis Part II: Levels
⚠️ DISCLAIMER ⚠️
This indicator is provided as a tool for traders and should not be used as the sole basis for making trading decisions. Always conduct your own research and consider your risk tolerance before entering any trades.

Waddah Attar Explosion with TDI First of all, a big shoutout to @shayankm, @LazyBear, @Bromley, @Goldminds and @LuxAlgo, the ones that made this script possible.
This is a version of Waddah Attar Explosion with Traders Dynamic Index.
WAE provides volume and volatility information. Also, WAE calculation was changed to a full-on MACD, to provide the momentum: the idea is to "assess" which MACD bars have significant momentum (i.e. crossover the Explosion Line)
TDI provides momentum, divergences as well as overbought and oversold areas. There is also a RSI on a different timeframe, for convergence.
Almost everything is editable:
- All moving averages are customizable, including the TRAMA, from @LuxAlgo
Waddah Attar Explosion_
- Three different crossing signals: histogram crossing contracting Explosion Line, expanding Explosion Line and ascending Explosion Line while both Bolling Bands are expanding; Explosion Line shows different color when expanding.
- Explosion line signals: Below DeadZone line and Exhaustion (highest value in a given lookback period). You can set a predefined EPL slope to filter out some noise.
- Deadzone signal : Deadzone squeeze ( lowst value in a given lookback period)
TDI:
- Overbought an Oversold signals. The OB and OS shapes have two colors, in order to display extreme signals on current timeframe or extreme signals on current and different time frame.
- Visual display of RSI outside the Bollinger Bands, and crossing of RSI Moving Average crossing of zero line.
I believe this combination is great for so many reasons!
Like the idea of TTM Squeeze? You can tune the Deadzone and Explosion lines to look for a volatility breakout
Like trading divergences or want to filter out extreme areas? The RSI is great for that
You like the using the MACD strategy but don't like the amount of false signals given? this WAE version filters some of them out.
If you are a Bollinger bands fan, you can customize both indicators to trade breakouts and/or mean reversion strategies, and filter out exhaustion of the bands expansion
This is my first publication, so give it a go and provide feedback if possible.

ASFX A2 Entry (Beta)This script is a counter intuitive pullback system.
Directional bias:
The system is suitable for trading markets where a strong trend is present.
The trend is measured by the SMA of the RSI (middle of the TDI) also known as the L50.
When this SMA is above 50 the market is deemed bullish.
When this SMA is below 50 the market is deemed bearish.
The duration of time above and below the center 50 accentuates the current directional bias.
When each EMA is below its longer term EMA, the market is said to be in full trend bearish.
When each EMA is above its longer term EMA, the market is said to be in full trend bullish.
The EMAs and TDIs run in the background so as to allow the trader to focus on signals.
Letter gradings and colour are applied to the trend strength with A being the highest.
Counter trend signals are available if the trader wishes.
Signal painting can be selected and deselected by letter.
The letter grading system is covered by selecting the rules feature in the settings which will bring up a table.
The rules table will give more detail as to the specifics of the system if the trader wishes to see them.
Signal:
The signal occurs when we have our directional bias and a candle breaks the 21 EMA and closes in the direction opposite to our bias.
The midway point of the candle body must close however in the direction of our bias (below for shorts, above for longs)
Hypothesis and example:
We want to join a strong trend at the best possible price.
If we are in an uptrend we can join on a break and close of a candle below the 21 EMA, if the uptrend is to continue this would be a 'cheap' price for long positions
If we are in a downtrend we can join on a break and close of a candle above the 21 EMA, if the downtrend is to continue this would be an 'expensive' price for short positions.

TDI w/ Variety RSI, Averages, & Source Types [Loxx]This hybrid indicator is developed to assist traders in their ability to decipher and monitor market conditions related to trend direction, market strength, and market volatility. Even though comprehensive, the Traders Dynamic Index (TDI) is easy to read and use. This version of TDI has 7 different types of RSI, 38 different types of Moving Averages, 33 source types, and 5 types of signals as well as alerts and coloring. Default RSI type is set to Jurik's RSX. This indicator can be used on any timeframe.
Green/Red line = RSI Price line
White line = Trade Signal line
Dark Green/Red lines = Volatility Band
Yellow line = Market Base Line
Gray dashed lines = Horizontal boundary lines, oversold/overbought
5 Signal Types w/ Alerts
Signal Crosses = Green/Red line crosses over or under White line
Floating Boundary Crosses = Green/Red line crosses over or under upper Dark Green/ lower Red lines
Horizontal Boundary Crosses = Green/Red line crosses over or under Gray dashed upper/lower lines
Floating Middle Crosses = Green/Red line crosses over or under Yellow line
Horizontal Middle Crosses = Green/Red line crosses over or under Gray dashed middle line
Manual Signal Types (no alerts included, this requires manual analysis)
Volatility Band Signals (Dark Green/Red lines) = When the Dark Green/Red lines are expanding, the market is strong and trending. When Dark Green/Red lines are constricting, the market is weak and in a range. When the Dark Green/Red lines are extremely tight in a narrow range, expect an economic announcement or other market condition to spike the market
Beyond these simple signal rules, there are various other signals or methods that can be used to derive long/short/exit signals from TDI included slope of the Green/Red line and bounces off the Yellow line.
Included
Loxx's Expanded Source Types
Loxx's Variety RSI
Loxx's Moving Averages
Signals
Alerts
Bar coloring
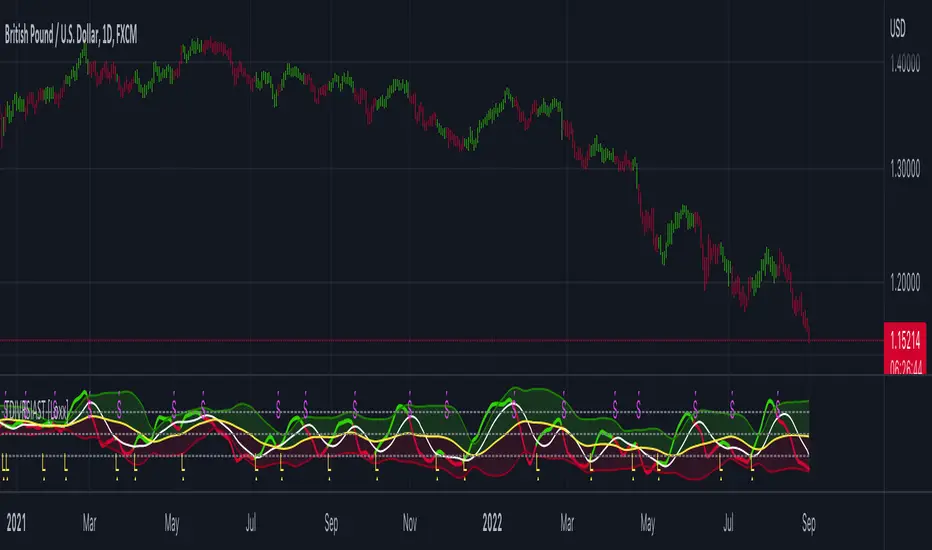
BTMM|TDIThis is the trader's dynamic index inspired by Steve Mauro's BTMM strategy.
In addition to the RSI, Trendline, Baseline, Volatility Bands I have also included additional trend biases that are painted in the background to provide more confluence when the markets break out in either direction.
For convenience, a position size calculator is included for all users to quickly calculate lot sizes on forex pairs with difference account balance currencies. The calculator works accurately on forex pairs. DO NOT USE for crypto or indices as some brokers have unique contract sizes that could not be fully incorporated into the tool.
There is also data table that displays historical values of the RSI, Trendline, Baseline, and an EMA vs Price scoring procedure that covers the current candle (t0) and up to 3 candles back. The table is meant to provide a snapshot view of either bullish or bearish dominance that can be deciphered with a quick glance.
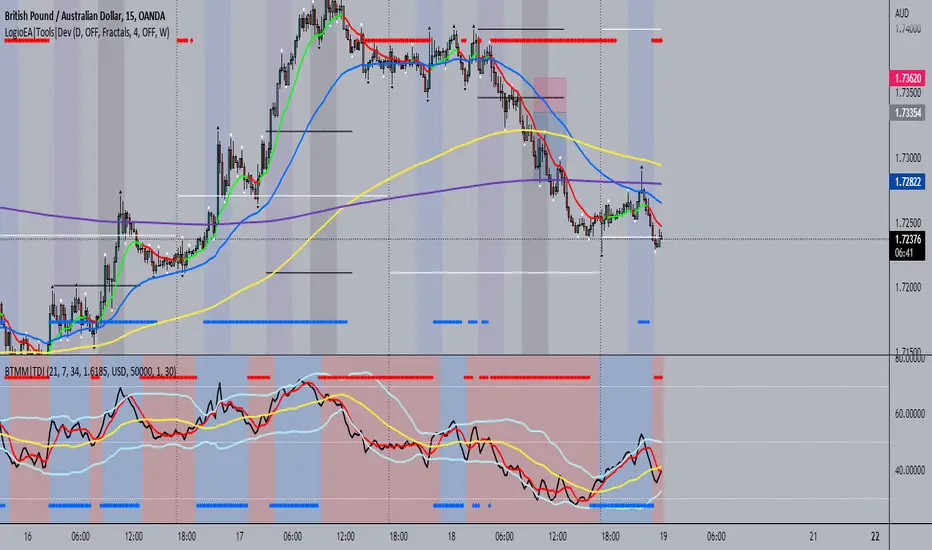
TDI Hedge Strategy
This is the incomplete version but upon multiple requests, I have released it early. All of the strategy and alert functions are yet to be written and I'll get around to it soon.
This indicator aims to be the best TDI indicator on TradingView. It is a strategy or study. It will have all of the filter, entry, and exit conditions for the strategies around the TDI.
What is implemented
MFI or RSI: the MFI is a much better TDI baseline than the RSI, in my opinion, and very effective
EMA or SMA used for the moving averages on fast, slow, and volatility band
Dynamic timeframe: set a factor of current timeframe and indicator will analyse higher timeframe automatically
Manual timeframe: set a higher timeframe to analyse different to currently viewed
Features for later
conditions for TDI filters/entries/exits
Strategy functions to use built-in strategy tester
BTE signal plot for Backtesting & Trading Engine
alerts
Enjoy!

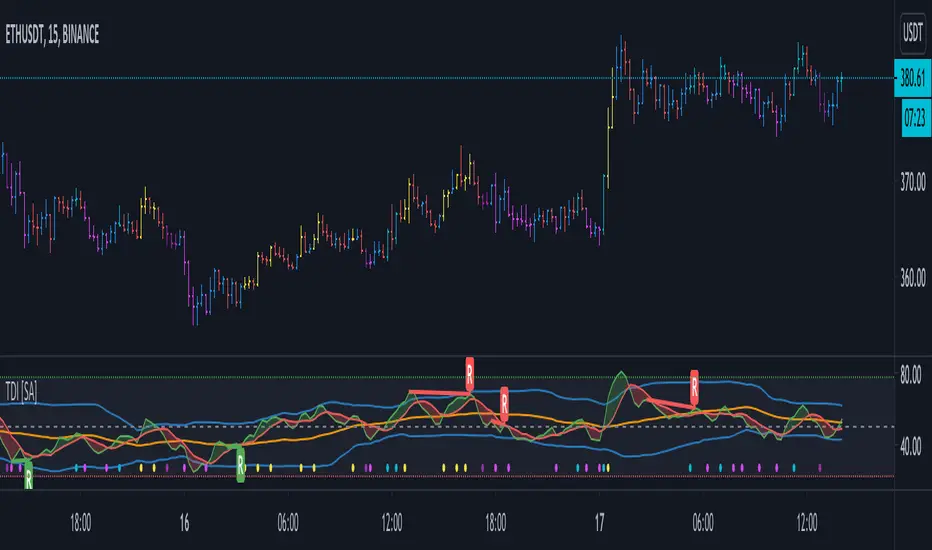
TDI - Traders Dynamic Index + RSI Divergences + Buy/Sell SignalsTraders Dynamic Index + RSI Divergences + Buy/Sell Signals
Credits to LazyBear (original code author) and JustUncleL (modifications)..
I added some new features:
1- RSI Divergences (Original code from 'Divergence Indicator')
2- Buy/Sell Signals with alerts (Green label 'Buy' - Red label 'Sell')
3- Background colouring when RSI (Green line) crosses above MBL (yellow line)
- Buy and Sell Signals are generated using Dean Malone's method (The Author of the TDI indicator) as mentioned in his PDF: (( www.forexfactory.com )), according to:
** Buy (Green Label) = RSI > 50, Red line, & Yellow line
** Sell (Red Label) = RSI < 50, Red line, & Yellow line
- I found that the best quality long trades generated when RSI crosses above red line, yellow line and they are all above 50, and vice versa for sell trades.
-I figured out another way to generate Buy/Sell Signals when RSI crosses above the yellow line, and you can stay with the trade till RSI crosses under the yellow line (I made a background colouring for that to be easily detected)
Hope you all wonderful trades..
مؤلف المؤشر هو (Dean Malone)
وكتب LazyBear كوده في tradingview
وأضاف JustUncleL بعض التعديلات عليه
أضفت إليه بعض المزايا الأخرى المتمثلة في:
1- رصد انحرافات مؤشر القوة النسبية
2- إشارات بيع وشراء بناء على طريقة مؤلف المؤشر
3- تظليل بالأخضر للمنطقة التي يعبر فيها مؤشر القوة النسبية الخط الأوسط (الخط الأصفر)
إشارات البيع والشراء تكون كالتالي:
** الشراء عندما يكون مؤشر القوة النسبية فوق الخط الأحمر وفوق خط الـ 50 وفوق الخط الأصفر
** البيع عندما يكون مؤشر القوة النسبية تحت الخط الأحمر وتحت خط الـ 50 وتحت الخط الأصفر
** أفضل إشارات الشراء حينما يعبر مؤشر القوة النسبية فوق الخط الأحمر والأصفر، ويكونوا جميعا فوق خط الـ 50، والعكس بالنسبة لإشارات البيع
يمكن استخدام المؤشر في دخول صفقات متوسط المدى، وذلك عندما يعبر مؤشر القوة النسبية فوق الخط الأصفر (قمت بتظليل المنطقة بالأخضر لسهولة رصدها) والخروج من الصفقة إذا نزل مؤشر القوة النسبية عن الخط الأصفر،
يرجى التنبه إلى أن الدخول والخروج يكون بأسباب فنية مدروسة، والمؤشر يدعم قراراتك فقط، ولا يمكن الاعتماد عليه منفردا في تحديد نقاط الدخول أوالخروج.
تجارة موفقة لكم جميعا :)

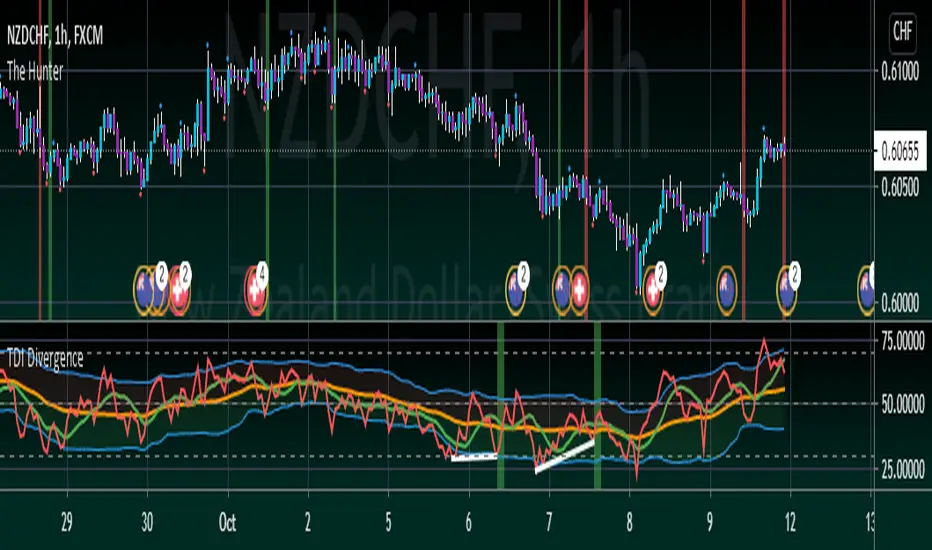
TDI DivergenceScript looks for divergencies on TDI. Divergencies are created by fast MA. First divergence leg has to be outside of volatility bands. After that, fast MA has to cross middle of volatility bands and then create second leg. When second leg is created, there have to be two candles with the same color in the direction of divergence.
Alerts are supported.
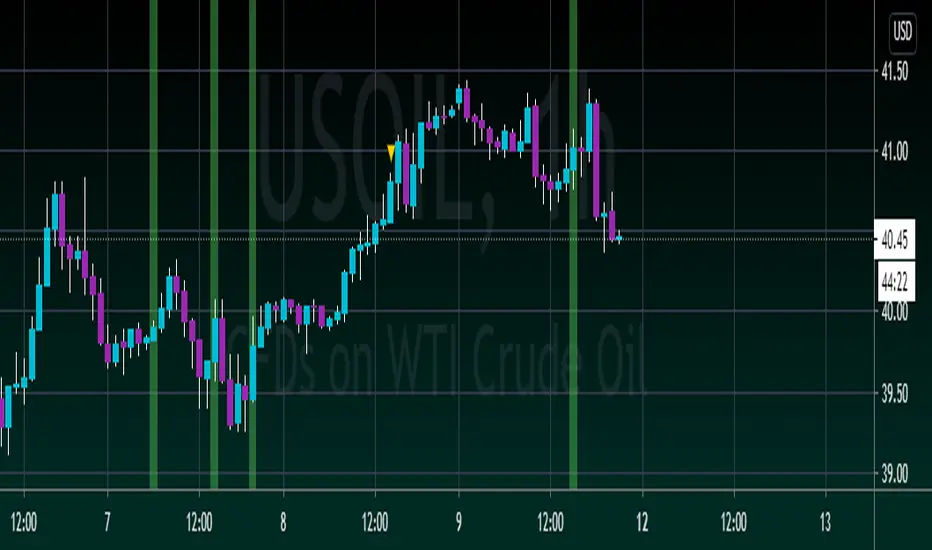
TDI + EMA20This indicator looks for situations when fast MA crosses slow MA in TDI and this cross has to be in volatility bands. When this happens, it looks for 1. or 2. or 3. bar that closes above/below ema20.
When fast MA crossover slow MA, indicator looks for 1. or 2. or 3. bar closed above ema20. When fast MA crossunder slow MA, indicator looks for 1. or 2. or 3 bar closed below ema20.
This indicator supports alerts.
Have fun :)
Traders Dynamic Index(TDI) + Momentum Candles[CW_Trades]The Traders Dynamic Index(TDI) is a trend, momentum and volatility indicator. The TDI is comprised of a standard Relative Strength Index(RSI) line, but also includes an RSI signal line, Bollinger Bands of the RSI and adjusted horizontal overbought/oversold levels. This version of the TDI offers the ability to color the RSI line based on RSI momentum. This version colors the horizontal background levels of the RSI depending on whether price is in a bull trend or bear trend. This version also allows you to color the price candles based on RSI momentum.
When reading the TDI the first line you want to look at is the RSI line, which is the line that changes color. The RSI line in this indicator is set to a lookback period of 13 rather than 14 as in the standard RSI indicator.
-The RSI line color is derived from the line's horizontal position(0-100). When the RSI line is between 45-55 the RSI line will be gray which indicates no momentum, or that price is neutral.
-When the RSI line is above 55 the line will be colored shades of green which indicate bullish price momentum:
--55-60 = dark green = weak bullish momentum
--60-70 = green = bullish momentum
--70-80 = light green = strong bullish momentum
--above 80 = bright green = extreme/overbought bullish momentum
---The brighter the shade of green the stronger the bullish momentum.
-When the RSI line is below 45 the line will be colored shades of purple which indicate bearish price momentum:
--45-40 = dark purple = weak bearish momentum
--40-30 = purple = bearish momentum
--30-20 = light purple = strong bearish momentum
--below 20 = bright purple = extreme/oversold bearish momentum
---The brighter the shade of purple the stronger the bearish momentum.
The next line in the TDI is the RSI Signal Line and it is an 8-period average of the RSI. The RSI Signal Line shows short-term trend in momentum. When the RSI line is above the RSI signal line the short-term momentum trend is considered bullish. When the RSI line is below the RSI signal line the short-term momentum trend is considered bullish.
The next set of lines you want to look at after the RSI line are the Bollinger Bands of the RSI, which are preset to the color blue. The RSI Bollinger Bands are read just as standard price Bollinger Bands in that the RSI trending above the middle of the bands is considered bullish and an RSI line trending below the middle of the bands is considered bearish. Breaches above the upper Bollinger Band and breaches below the lower Bollinger Band are considered to be signs of extreme volatility. A breach of the upper band indicates that momentum is extremely volatile to upside and price could potentially reverse, or make a short-term top. When this occurs the RSI line is colored yellow. When the RSI line breaches the lower Bollinger Band it indicates that momentum is extremely volatile to the downside and price could potentially reverse, or make a short-term bottom. When this occurs the RSI line is colored red.
Along with watching where the RSI line is relative to the Bollinger Bands, you also want to watch where the middle Bollinger Band is on the horizontal range(0-100). When the middle Bollinger Band is above 50 it indicates intermediate-term bullish momentum. When the middle Bollinger Band gets near or above 70 it usually marks a short-term top or end of a bull rally. When the middle Bollinger Band is below 50 it indicates intermediate-term bearish momentum. When the middle Bollinger Band gets near or below 30 it usually marks a short-term bottom or end of a bear rally.
When the middle Bollinger Band crosses above and below the horizontal 50 level it changes the color of the TDI background. When the middle band is above 50 the background is colored green and when the middle band is below 50 the background is colored purple. The green background will fill the 40-80 levels and is where you want to see most of the RSI line action during a bull trend in price. When the RSI is mostly trending between 40-80 the overall trend behind price is considered bullish. The purple background will fill the 20-60 levels and is where most of the RSI line action will be during a bear trend in price. When the RSI line is mostly trending between 20-60 the overall trend behind price is considered bearish.
The TDI is a great tool for any trader, especially if you already use the RSI indicator since the TDI is basically and improved/advanced RSI.

TDI - Traders Dynamic Index [SystemAlpha]Traders Dynamic Index with Divergence
Credits to the original code author LazyBear and modifications by JustUncleL
TDI Traders Dynamic Index Alerts v1 - BonavestTo add this indicator to your charts:
Click the 'Add to Favorite Scripts' button down below this description.
This indicator places BUY and SELL tags on the chart using the Trader's Dynamic Index Indicator created by Dan Malone. This indicator is RSI based and is best used with ranging markets and will tend to create a trail of false signals (colored tags) when price is at it's extremes for a long period of time. Utlizing some other indicator such as a volume based one will assist in optimizing signals.
I have used this indicator with success for a few years, however I do not plan to support users of this indicator. It is offered as-is.
I use this indicator for:
Counter Trend Trading (colored tags)
Detecting Best Entries to Follow Trend (gray tags)
Trading Extreme Overbought/Oversold Price Areas (bright colored tags)
Detecting RSI Divergences (circles)
SETTINGS
Custom Timeframe - Default current chart timeframe. Custom selection only works when selecting a smaller timeframe than what is on the chart.
Lengthrsi - RSI Period
Lengthband - TDI Band Length
Lengthrsipl - TDI Price Line Length
Lengthtradesl - TDI Signal Line Length
There are 5 Built-In Notifications already created for you and are available by simply right clicking in the indicator area and selecting:
Condition: TDI Alerts v1
Then 1 of the 5 Alerts:
BUY Signal - All Green colored tags
SELL Signal - All Red colored tags
Gray BUY signal - All Gray BUY tags
Gray SELL signal - All Gray SELL tags
All Signals - All colored and gray tags
This adaptation was based off of the original code from the talented LazyBear.

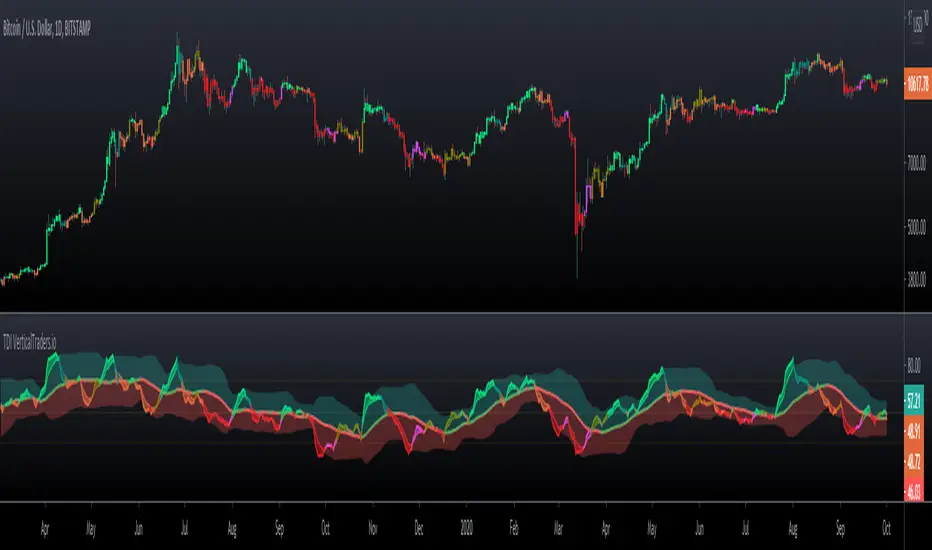
TDITDI
- Calculate strength and market direction by analyzing relative strength
- Ribbon mode, according to the TDI conditions
- Candlestick same as TDI Ribbon colors
- 6 colors to define market strength
[BACKTEST]Traders Dynamic Index Indicator Alert by JustUncleLBy request, this script is a "strategy" version of my "Traders Dynamic Index Indicator Alert" script, made available for backtesting to help find optimal trade settings for a particular asset.

Assassin TDI SQUEEZEcombine Assassin TDI indicator and squeeze indicator.
the hline(0) black show squeeze coming.
Other works like TDI indicator.
Thanks The big E.

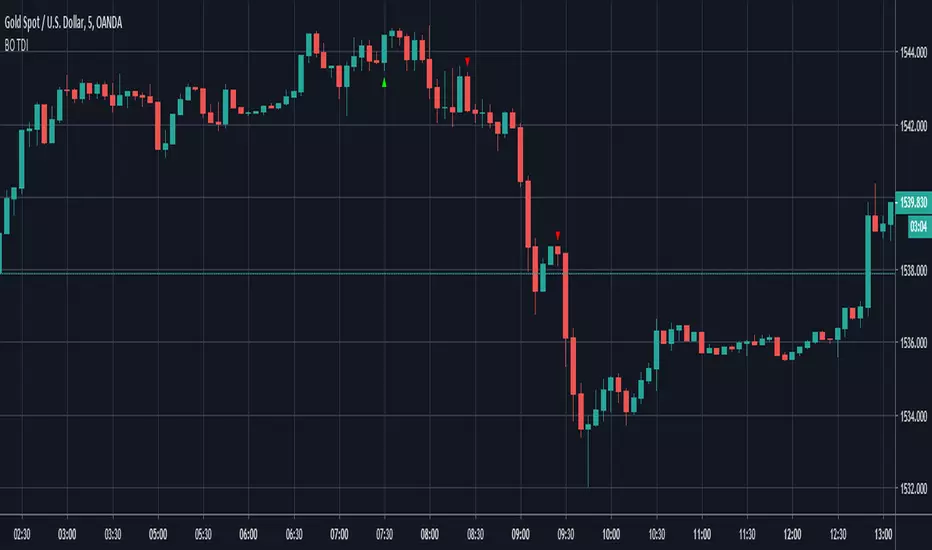
BO TDIBinary Option strategy based on TDI indicator, Put or Call at the beginning of the next candle, expire 5m for 5m candle.


TDI RSX JMATDI based on RSX and JMA from Jurik.
Green dot = Rsx cross JMA below 50--> Long
Blue dot = JMA cross Mid Band --> Long
Red dot = Rsx cross JMA above 50 -->Short
Orange dot =JMA cross Mid Band --> Short
