Frankator BBRSI🧭Strategy Description of Frankator BBRSI: Bollinger Bands + RSI Signal (only on 5 min chart)
Overview
This indicator combines Bollinger Bands and the Relative Strength Index (RSI) to identify potential overbought and oversold market conditions.
It generates buy and sell signals when the price reaches extreme levels confirmed by RSI momentum — helping traders anticipate potential reversals or continuation setups.
📊 How It Works
Bollinger Bands
The script plots three lines:
Upper Band: SMA + (Standard Deviation × Multiplier)
Basis (Middle Band): Simple Moving Average (SMA)
Lower Band: SMA - (Standard Deviation × Multiplier)
When the price touches or breaks the upper band, it may indicate an overbought market.
When the price touches or drops below the lower band, it may indicate an oversold market.
RSI Confirmation
RSI measures momentum to confirm whether the market is truly overbought or oversold.
Default RSI levels:
Overbought: RSI > 70
Oversold: RSI < 30
Signal Conditions
Buy Signal:
Price closes at or below the lower Bollinger Band
RSI < 30 (oversold)
A green triangle appears below the candle
Sell Signal:
Price closes at or above the upper Bollinger Band
RSI > 70 (overbought)
A red triangle appears above the candle
Alerts
You can set TradingView alerts for automatic notifications when either a Buy or Sell condition is met.
Go to “Add Alert” → “Condition” → Choose this indicator → Select Buy/Sell Signal, or Any alert for both alerts.
⚠️ Disclaimer
This indicator is a technical analysis tool, not a guarantee of future performance. Always use proper risk management and confirm signals with other indicators or price patterns before entering trades.
ボラティリティ

Liquidity Levels - PMH/PWH/PDH/HODWhat is it?
An indicator that tracks the main liquidity levels on TradingView, displaying the highs and lows of reference for month, week, previous day and current day.
What's it for?
It identifies price zones where there are many pending orders (liquidity). Traders use it to:
Find support and resistance points
Identify areas where price could bounce or break through
Receive alerts when price touches or breaks these levels
Which levels does it show?
LevelDescriptionColorLinePMH/PMLPrevious month's high and lowPurpleSolidPWH/PWLPrevious week's high and lowBlueSolidPDH/PDLPrevious day's high and lowOrangeSolidHOD/LODCurrent day's high and lowGrayDotted
How to use it?
Apply the indicator to your chart
Customize colors and enable/disable the levels you prefer
Set alerts to receive notifications when price touches or breaks levels
Use the levels to make trading decisions (entry, exit, stop loss)
Perfect for: Scalping, Day Trading, Swing Trading on any asset (forex, crypto, stocks)

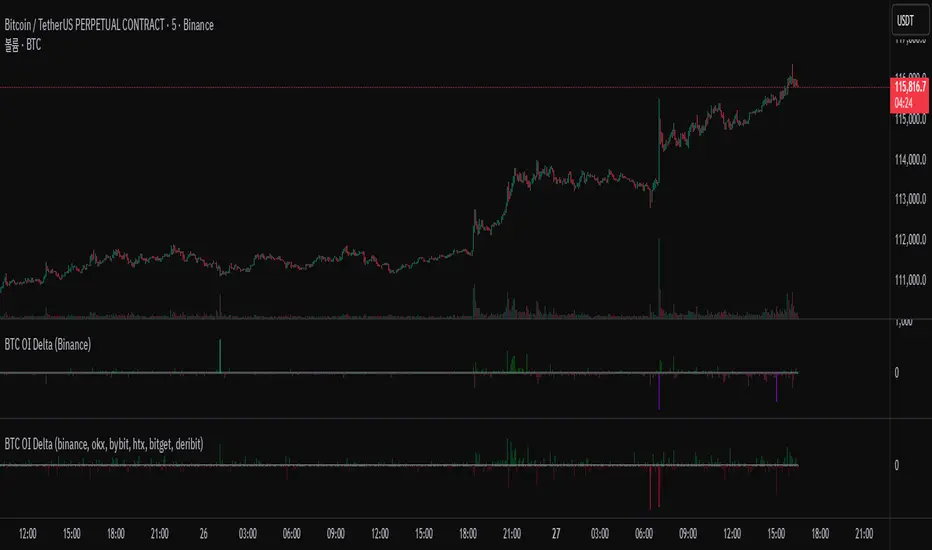
BTC OI Delta (binance, okx, bybit, htx, bitget, deribit)📊 BTC Open Interest (OI) Delta (Binance, OKX, Bybit, HTX, Bitget, Deribit)
📝 Overview
This Pine Script indicator tracks and visualizes the changes (delta) in Bitcoin (BTC) open interest (OI) for perpetual futures across multiple major crypto exchanges: Binance, OKX, Bybit, Bitget, HTX, and Deribit. It calculates the total net delta by summing the OI delta from each exchange and displays positive (OI increase) and negative (OI decrease) deltas as separate column charts. Users can choose which exchanges to include or exclude and utilize the spike highlight feature to differentiate delta intensity with color based on user-defined thresholds.
⚡ Key Features
🌐 Multi-exchange OI delta tracking
Fetches and calculates BTC perpetual futures OI delta individually from Binance, OKX, Bybit, Bitget, HTX, and Deribit.
📈 Total net delta calculation
Sums the OI delta from all selected exchanges to represent overall market open interest changes.
🎨 Visualization
Column plots: Displays net OI increases (positive delta) and decreases (negative delta) as separate column charts for intuitive trend analysis.
Spike highlights: Changes in OI delta are color-coded according to user-defined thresholds to make significant moves easily identifiable.
⚙️ User settings
Users can select which exchanges to display, enable/disable spike highlights, and set thresholds for “strong” and “very strong” OI delta changes.
🛠 Input Settings
Show Zero Line (bool, default: true): Show a zero baseline on the chart.
Highlight Spikes (bool, default: true): Enable color highlighting based on OI delta intensity.
Strong Threshold (int, default: 1000): Delta value considered a “strong” change (in BTC).
Very Strong Threshold (int, default: 2000): Delta value considered a “very strong” change (in BTC).
Show Binance (bool, default: true): Include Binance OI delta.
Show OKX (bool, default: true): Include OKX OI delta.
Show Bybit (bool, default: true): Include Bybit OI delta.
Show Bitget (bool, default: true): Include Bitget OI delta.
Show HTX (bool, default: true): Include HTX OI delta.
Show Deribit (bool, default: true): Include Deribit OI delta.
🔢 Calculation Method
🧮 Individual OI request
Uses request.security() to fetch OI data from each exchange.
➕ Delta calculation
Current bar OI minus previous bar OI (oi - oi ).
❌ Handling na values
If OI data is missing (exchange disabled or no data), the delta is treated as 0 to avoid sum errors.
🔗 Total net delta
Sums all selected exchange deltas as totalCombinedDelta.
↔️ Separate net increase/decrease
Positive (netIncreaseCombined) and negative (netDecreaseCombined) parts of total delta are split.
🎨 Color determination
getNetDeltaHighlightedColor function dynamically sets column colors based on highlightSpike and threshold settings.
🎨 Color Scheme
Highlight disabled:
Positive delta: teal shades
Negative delta: red shades
Highlight enabled:
Positive delta (normal): dark teal (#026628)
Positive delta (strong): bright teal (#00ff95)
Positive delta (very strong): yellow (#eeff00)
Negative delta (normal): dark red (#6b0d0d)
Negative delta (strong): bright red (#ff1044)
Negative delta (very strong): pink (#ff00ea)
📊 Usage
💹 Market sentiment analysis
Total net OI delta increase → capital inflow and position building
Total net OI delta decrease → capital outflow and position liquidation
⚖️ Position interpretation
BTC rising + positive OI delta → increasing long positions
BTC falling + negative OI delta → decreasing long positions
BTC falling + positive OI delta → increasing short positions
BTC rising + negative OI delta → decreasing short positions
📈 Trend confirmation
Sustained positive delta → bullish signal
Sustained negative delta → bearish signal
🌪 Volatility prediction
“Strong” or “very strong” spikes may indicate increased price volatility.
🏦 Exchange-specific impact
Enable/disable exchanges to analyze how each exchange’s OI changes affect the overall market.
Gaussian RibbonSummary
Adaptive Gaussian ribbon with inner/outer sigma bands and soft regime colors—green trend, red pressure, gray neutral.
What it is
A clean Gaussian filter ribbon that maps trend + volatility without the jitter. It uses a Gaussian smoother, a tiny EMA basis, and two standard-deviation bands. Color fades with distance from the basis, and flips softly (no knife-edge).
How it works
Gaussian core: IIR-style smoothing on your chosen source (default hlc3).
Basis: EMA(3) of the Gaussian for a steadier slope.
Bands: Inner = Basis ± (σ × Inner Mult), Outer = Basis ± (σ × Outer Mult).
Regime: z-score → softsign → EMA(3) → bull / neutral / bear.
Faded look: opacity ramps with distance; neutral turns gray.
What “Regime” Means (Simple)
A regime is the market’s “weather.” It shifts between Bull, Neutral, and Bear. Different tactics work in each.
How this indicator detects regime
Builds a smoothed score of price vs. the basis (z-score → softsign → EMA).
Score > 0 = Bull, score < 0 = Bear. Inside the inner band = Neutral filter to cut noise.
Color changes are soft (faded) so flips don’t knife-edge.
Playbook (What to do)
Bull (Green): Buy pullbacks to the inner band; add on strength; cut fast if price falls back inside the ribbon.
Neutral (Gray): Reduce size, fade extremes, or stand down. Wait for a clean break in either direction.
Bear (Red): Sell/short rallies to the ribbon; protect capital; flip long only after a confirmed regime turn.
For Pros (Tuning & Confirmation)
Timeframe bias: Use higher TF (1W/2W) for context; trade on 1D/4H in the higher-TF direction.
Smoother vs faster: Increase Length to reduce flip-flop; decrease for earlier turns.
Vol filter: Widen Outer/Inner multipliers in choppy markets; narrow in strong trends.
Confirm: Use structure (HH/HL vs LH/LL), volume/OBV, or your MA; ribbon = context, not a standalone trigger.
How to read it
Green = trend support; pullbacks to the inner band are typical buy-the-dip zones.
Gray = inside ribbon; chop/mean reversion. Size down or wait.
Red = trend pressure; rallies into ribbon are fade zones until regime flips.
Opacity increases with distance = stronger momentum.
Good starting presets
Macro (1W–2W): Length 90–110, Outer 2.3, Inner 1.3, Source hlc3.
Swing (1D): Length 60–80, Outer 2.0, Inner 1.4.
Intraday (1–4H): Length 30–40, Outer 1.8, Inner 1.2.
Options
Opens in a separate pane (overlay=false). Set overlay=true to place on candles (consider +5 transparency on fills).
Watermark is “CAYEN” (table-based, no editor drama).
Why it’s “safe”
No repaint. No lookahead; uses only closed-bar data.
Deterministic state and divide-by-zero guards.
Limitations
It’s a context tool. It will lag at regime turns (by design). Use structure/volume to time entries.
Credits
Script by Jason Cayen. Gaussian smoothing is classic DSP math (public domain).
Release notes (v1.0)
Initial public release: faded bands, neutral zone, soft regime colors, Non-repainting; pane by default.

THAIT Moving Averages Tight within # ATR EMA SMA convergence
THAIT(tight) indicator is a powerful tool for identifying moving average convergence in price action. This indicator plots four user-defined moving averages (EMA or SMA). It highlights moments when the MAs converge within a user specified number of ATRs, adjusted by the 14-period ATR, signaling potential trend shifts or consolidation.
A convergence is flagged when MA1 is the maximum, the spread between MAs is tight, and the price is above MA1, excluding cases where the longest MA (MA4) is the highest. The indicator alerts and visually marks convergence zones with a shaded green background, making it ideal for traders seeking precise entry or exit points.

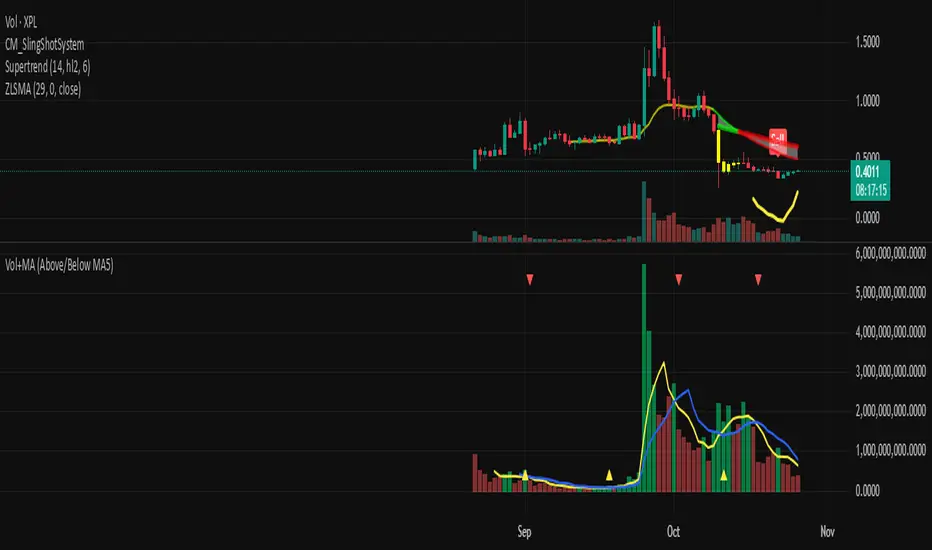
Flux AI PullBack System (Hybrid Pro)Flux AI PullBack System (Hybrid Pro)
//Session-Aware | Adaptive Confluence | Grace Confirm Logic//
Overview:
The Flux AI PullBack System (Hybrid Pro v5) is an adaptive, session-aware pullback indicator designed to identify high-probability continuation setups within trending markets. It automatically adjusts between “Classic” and “Enhanced” logic modes based on volatility, volume, and ATR slope, allowing it to perform seamlessly across different market sessions (Asian, London, and New York).
Core Features:
Hybrid Auto Mode — Dynamically switches between Classic (fast-moving) and Enhanced (strict) modes.
Session-Aware Context — Optimized for intraday trading in ES, NQ, and SPY.
Grace Confirmation Logic — Validates pullbacks with a follow-through condition to reduce noise.
Adaptive EMA Zone (38/62) — Highlights pullback areas with dynamic aqua fill and transparency linked to trend strength.
Noise Suppression Filter — Prevents false pullbacks during EMA crossovers or unstable transitions.
Weighted Confluence Model — Combines trend, ATR, volume, and swing structure for confirmation strength.
Pine v6 Compliant Alerts — Constant-string safe, ready for webhooks and automation.
Visual Elements:
Aqua EMA Zone: Displays the “breathing” pullback band (tightens during volatility spikes).
PB↑ / PB↓ Markers: Confirmed pullbacks with subtle transparency and fixed label size.
Bar Highlights: Yellow for pullbacks; ice-blue for confirmed continuation.
Use Cases
Perfect for:
Intraday trend traders
0DTE SPX / ES scalpers
Futures traders (NQ, MNQ, MES)
Algorithmic strategy builders using webhooks
Recommended Timeframes:
1–15 minute charts (scalping / intraday)
Higher timeframes for swing confirmations.
Attribution:
This open-source script was inspired by Chris Moody’s “CM Slingshot System” and JustUncleL’s Pullback Tools, but it was built from scratch using AI-assisted code refinement (ChatGPT).
All logic and enhancements are original, not derived from proprietary software.
License: MIT (Open Source)
© 2025 Ken Anderson — You may modify, use, or redistribute with credit.
Keywords:
Pullback, Reversal, AI Trading, EMA Zone, Session Aware, Futures Trading, SPX, ES, NQ, ATR Filter, Volume Confirmation, Flux System, Pine Script v6, Non-Repainting, Adaptive Trading Indicator.

williams vix fix strategy maybe working thshshtssrjsrndbf
hrthnnndhzmhfbdhdrzmh
nnnfgngmhmxfnxhm
xmmxfhnmfndygngny
ngf
mfm

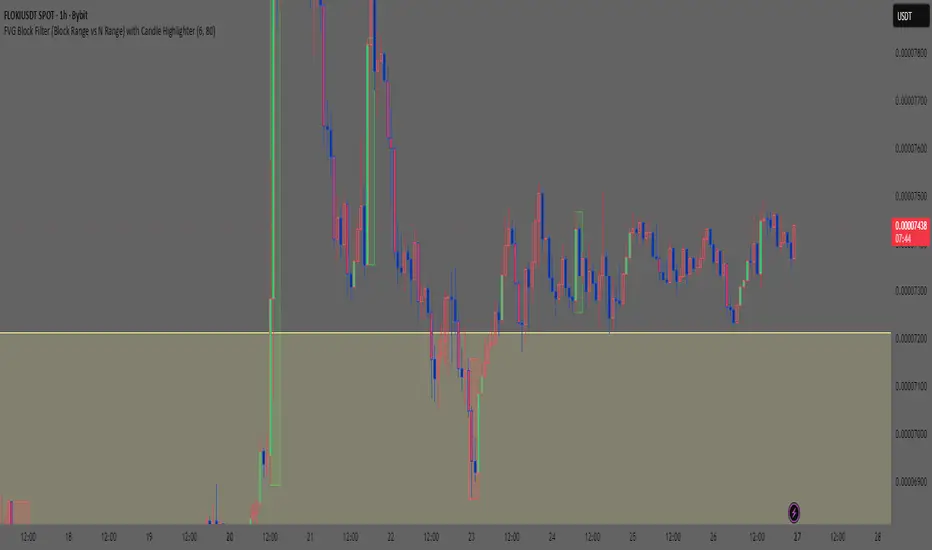
Smart Money Concept: FVG Block Filter Smart Money Concept: FVG Block Filter (FVG Block Range vs N Range) with Candle Highlighter
Summary:
Smart Money Concept (SMC): An advanced indicator designed to visualize and filter Fair Value Gaps (FVG) blocks based on their size (Range) compared to the preceding N Range candle movement. It also includes a customizable Candle Highlighter function that marks the specific candle responsible for creating the FVG. The indicator allows full color customization for both blocks and the highlighter, and features clean, label-free charts by default.
Key Features:
FVG Block Detection: Automatically identifies and groups sequential FVG imbalances to form consolidated FVG blocks.
FVG Block Filtering (N Range): Filters blocks based on a user-defined rule, comparing the block's size (Range) to the range of the preceding N candles (e.g., requiring the FVG block to be larger than the range of the previous 6 candles).
Customizable Candle Highlighter: Marks the central candle (B) within the FVG structure (A-B-C) to highlight the source of the price imbalance. Highlighter colors are fully adjustable via inputs.
Visualization Control: Labels are turned OFF by default to keep the chart clean but can be easily enabled via the indicator settings.
Full Color Customization: Allows independent customization of Bullish and Bearish FVG Block colors, Block Transparency, and Bullish/Bearish Highlighter colors.
Keywords:
Smart Money Concept, SMC, Fair Value Gap, FVG, Imbalance, Block Filter, Candle Highlighter, Range.
FluxVector Liquidity Universal Trendline FluxVector Liquidity Trendline FFTL
Summary in one paragraph
FFTL is a single adaptive trendline for stocks ETFs FX crypto and indices on one minute to daily. It fires only when price action pressure and volatility curvature align. It is original because it fuses a directional liquidity pulse from candle geometry and normalized volume with realized volatility curvature and an impact efficiency term to modulate a Kalman like state without ATR VWAP or moving averages. Add it to a clean chart and use the colored line plus alerts. Shapes can move while a bar is open and settle on close. For conservative alerts select on bar close.
Scope and intent
• Markets. Major FX pairs index futures large cap equities liquid crypto top ETFs
• Timeframes. One minute to daily
• Default demo used in the publication. SPY on 30min
• Purpose. Reduce false flips and chop by gating the line reaction to noise and by using a one bar projection
• Limits. This is a strategy. Orders are simulated on standard candles only
Originality and usefulness
• Unique fusion. Directional Liquidity Pulse plus Volatility Curvature plus Impact Efficiency drives an adaptive gain for a one dimensional state
• Failure mode addressed. One or two shock candles that break ordinary trendlines and saw chop in flat regimes
• Testability. All windows and gains are inputs
• Portable yardstick. Returns use natural log units and range is bar high minus low
• Protected scripts. Not used. Method disclosed plainly here
Method overview in plain language
Base measures
• Return basis. Natural log of close over prior close. Average absolute return over a window is a unit of motion
Components
• Directional Liquidity Pulse DLP. Measures signed participation from body and wick imbalance scaled by normalized volume and variance stabilized
• Volatility Curvature. Second difference of realized volatility from returns highlights expansion or compression
• Impact Efficiency. Price change per unit range and volume boosts gain during efficient moves
• Energy score. Z scores of the above form a single energy that controls the state gain
• One bar projection. Current slope extended by one bar for anticipatory checks
Fusion rule
Weighted sum inside the energy score then logistic mapping to a gain between k min and k max. The state updates toward price plus a small flow push.
Signal rule
• Long suggestion and order when close is below trend and the one bar projection is above the trend
• Short suggestion and flip when close is above trend and the one bar projection is below the trend
• WAIT is implicit when neither condition holds
• In position states end on the opposite condition
What you will see on the chart
• Colored trendline teal for rising red for falling gray for flat
• Optional projection line one bar ahead
• Optional background can be enabled in code
• Alerts on price cross and on slope flips
Inputs with guidance
Setup
• Price source. Close by default
Logic
• Flow window. Typical range 20 to 80. Higher smooths the pulse and reduces flips
• Vol window. Typical range 30 to 120. Higher calms curvature
• Energy window. Typical range 20 to 80. Higher slows regime changes
• Min gain and Max gain. Raise max to react faster. Raise min to keep momentum in chop
UI
• Show 1 bar projection. Colors for up down flat
Properties visible in this publication
• Initial capital 25000
• Base currency USD
• Commission percent 0.03
• Slippage 5
• Default order size method percent of equity value 3%
• Pyramiding 0
• Process orders on close off
• Calc on every tick off
• Recalculate after order is filled off
Realism and responsible publication
• No performance claims
• Intrabar reminder. Shapes can move while a bar forms and settle on close
• Strategy uses standard candles only
Honest limitations and failure modes
• Sudden gaps and thin liquidity can still produce fast flips
• Very quiet regimes reduce contrast. Use larger windows and lower max gain
• Session time uses the exchange time of the chart if you enable any windows later
• Past results never guarantee future outcomes
Open source reuse and credits
• None

NEURAL FLOW INDEX — Core Energy • Momentum Stream • Pulse SyncNeural Flow Index (NFI) — Advanced Triple-Layer Reversal Framework
The Neural Flow Index (NFI) is a next-generation market oscillator designed to reveal the hidden synchronization between trend energy, cyclical momentum, and internal pulse dynamics.
It merges three powerful analytical layers into a single, normalized view:
Core Energy Curve (based on RSO logic) — captures structural trend bias and volatility expansion.
Momentum Stream (WaveTrend algorithm) — visualizes cyclical motion of price waves.
Pulse Sync (Stochastic RSI adaptation) — measures short-term momentum rhythm and overextension.
Each layer feeds into a unified flow model that adapts to both trend-following and reversal conditions. The goal is not to chase every fluctuation, but to sense where momentum, direction, and volatility converge into true inflection points.
Conceptual Mechanics
The oscillator translates complex market behavior into an elegant, multi-phase signal system:
Core Energy Curve (RSO foundation):
A smoothed dynamic field representing the overall strength and direction of market pressure.
Green energy indicates expansion (bullish dominance); red energy reflects contraction (bearish decay).
Momentum Stream (WaveTrend):
The teal line functions like an electro-wave, oscillating through phases of expansion and exhaustion.
It provides the heartbeat of the market — smooth, rhythmic, and beautifully cyclic.
Pulse Sync (Stochastic RSI):
The purple line acts as the market’s nervous pulse, reacting to micro-momentum changes before the larger trend adjusts.
It identifies micro-tops and micro-bottoms that precede major trend shifts.
When these three forces align, they create high-probability reversal zones known as Neural Nodes — regions where energy, momentum, and rhythm converge.
Trading Logic
Potential Entry Zones:
When the purple Pulse Sync line crosses the green Momentum Stream near the lower or upper bounds of the oscillator, a potential turning point forms.
Yet, these crossovers are only validated when the Core Energy histogram (RSO) simultaneously supports the same direction — confirming that energy and rhythm are synchronized.
Histogram Confirmation:
The histogram is the “voice” of the oscillator.
Rising green volume within the histogram during a Pulse-Momentum crossover suggests a legitimate upward reversal.
Conversely, expanding red energy during an upper-band cross indicates momentum exhaustion and an early short-side opportunity.
Neutral Zones:
When all three layers flatten near the zero line, the market enters an equilibrium phase — no clear trend dominance, ideal for patience and re-entry planning.
| Layer | Representation | Color | Function |
| --------------------- | ------------------- | ----------------- | ------------------------------ |
| **Core Energy Curve** | Area / Histogram | Lime-Red gradient | Trend bias & volatility energy |
| **Momentum Stream** | WaveTrend line | Teal | Cyclical flow of price |
| **Pulse Sync** | Stochastic RSI line | Purple | Short-term momentum rhythm |
Interpretation Summary
Converging Waves: Trend, momentum, and pulse move together → strong continuation.
Diverging Waves: Pulse or Momentum decouple from Core Energy → early reversal warnings.
Histogram Expansion: Confirms direction and strength of the new wave.
Crossovers at Extremes: Potential entries, especially when confirmed by energy alignment.
🪶 Philosophy Behind NFI
The Neural Flow Index is not just a technical indicator — it’s a behavioral visualization system.
Instead of focusing on lagging confirmations, it captures the neural pattern of price motion:
how liquidity flows, contracts, and expands through time.
It bridges the gap between pure mathematics and market intuition — giving traders a cinematic, harmonic view of energy transition inside price structure.

GARCH Range PredictorThis was inspired by deltatrendtrading's video on GARCH models to predict daily trading ranges and identify favorable trading conditions. Based on advanced volatility forecasting techniques, it predicts whether a trading day's true range will exceed a threshold, helping traders decide when to trade or skip a session.
Key Features
GARCH(1,1) Volatility Modeling: Uses log-transformed true ranges with exponential moving average centering
Forward-Looking Predictions: Makes predictions at session start before the day unfolds
Dynamic or Static Thresholds: Choose between fixed dollar thresholds or adaptive 20-day averages
Accuracy Tracking: Monitors prediction accuracy with overall and recent (20-day) hit rates
Visual Session Boxes: Colors trading sessions green (trade) or red (skip) based on predictions
Real-Time Statistics: Displays current predictions, thresholds, and performance metrics
How It Works
Data Transformation: Log-transforms daily true ranges and centers them using an EMA
Variance Modeling: Updates GARCH variance using: σ²ₜ = ω + α(residual²) + β(σ²ₜ₋₁)
Prediction Generation: Back-transforms log predictions to dollar values
Signal Generation: Compares predictions to threshold to generate trade/skip signals
Performance Tracking: Validates predictions against actual outcomes
Parameters
GARCH Parameters (ω, α, β): Control volatility persistence and mean reversion
EMA Period: Smoothing period for log range centering
Threshold Settings: Static dollar amount or dynamic multiplier of recent averages
Session Time: Define regular trading hours for analysis
Best Use Cases
Breakout and momentum strategies that perform better on high-range days
Risk management by avoiding low-volatility sessions
Futures day trading (optimized for MNQ/NQ detection)
Any strategy where daily range impacts profitability
Important Notes
Requires 5+ sessions for initialization and warm-up
Accuracy depends heavily on proper parameter tuning for your specific instrument
Default parameters may need adjustment for different markets
Monitor the hit rate to validate effectiveness on your timeframe

Volume + MA5 & MA10This Volume + MA5 & MA10 (Technical Volume Trend Analysis)
The Volume + MA5 & MA10 indicator provides a precise view of market participation and volume momentum by combining raw volume data with two moving averages (MA5 and MA10). It’s designed for traders who rely on volume-based confirmation to validate price movements, breakouts, and trend reversals.
🔍 Overview
This indicator displays volume bars alongside two smooth volume averages — MA5 (short-term) and MA10 (medium-term) — making it easier to detect shifts in market activity.
When the short-term average crosses above or below the long-term average, it signals a potential change in trading intensity or market sentiment.
⚙️ Key Features
Dual Volume Moving Averages (MA5 & MA10) for short- and medium-term analysis.
Dynamic Bar Coloring based on whether current volume exceeds MA5 or MA10.
Crossover Detection with visual markers for MA5/MA10 intersections.
Alert Conditions to notify you of significant volume trend shifts.
Fully customizable appearance and smoothing options.
📊 How to Interpret
MA5 > MA10 → Increasing short-term volume activity (strengthening momentum).
MA5 < MA10 → Decreasing short-term volume (weakening participation).
Rising volume with price → Confirms trend strength.
Falling volume with rising/falling price → Suggests potential reversal or reduced conviction.
💡 Applications
Confirm breakouts and trend continuations.
Identify momentum divergences between price and volume.
Filter out low-volume or weak-trend setups.
Combine with RSI, MACD, or moving averages for enhanced signal validation.
✅ Advantages
Simple yet powerful structure for clean visual analysis.
Works across all timeframes and markets (crypto, stocks, forex, indices).
No repainting — reliable for both live and historical backtesting.
Use Volume + MA5 & MA10 to strengthen your technical analysis and gain a deeper understanding of how market participation drives price trends.
EdgeBox: MA DistanceEdgeBox: MA Distance adds a clean HUD showing the percentage distance from the current close to your selected moving averages (default: SMA 100/150/200/250). Values are positive when MAs are above price and negative when below. Also includes ATR% (volatility) and RSI(14). Fully customizable: corner position, font sizes, and text/background colors. A fast context panel for trend and volatility at a glance.

PG ATM Strike Line with Call & Put PremiumsPine Script: ATM Strike Line with Call & Put Premiums (Simplified)This Pine Script for TradingView displays the At-The-Money (ATM) strike price, futures price, call/put premiums (time value), and two ratios—Premium Ratio (PR) and Volume Ratio (VR)—for a user-selected underlying asset (e.g., NIFTY, BANKNIFTY, or stocks). It helps traders gauge near-term market direction using options data.How the Script WorksInputs:Expiry: Select year (e.g., '25), month (01–12), day (01–31) for option expiry (e.g., '251028').
Timeframe: Choose data timeframe (e.g., Daily, 15-min).
Symbol: Auto-detects chart symbol or select from Indian indices/stocks.
Strike: Auto-ATM (based on futures) or manual strike input.
Interval: Auto (e.g., 100 for NIFTY) or custom strike interval.
Colors: Customizable for ATM line, labels (Futures Price, CPR, PPR, VR, PR).
Calculations:Futures Price (FP): Fetches front-month futures price (e.g., NSE:NIFTY1!).
ATM Strike: Rounds futures price to nearest strike interval.
Option Data: Retrieves Last Traded Price (LTP) and volume for ATM call/put options (e.g., NSE:NIFTY251028C24200).
Call Premium (CPR): Call LTP minus intrinsic value (max(0, FP - Strike)).
Put Premium (PPR): Put LTP minus intrinsic value (max(0, Strike - FP)).
Premium Ratio (PR): PPR / CPR.
Volume Ratio (VR): Put Volume / Call Volume.
Visuals:Draws ATM strike line on chart.
Displays labels: FP (futures price), CPR (call premium), PPR (put premium), VR, PR.
VR/PR labels: Red (≥ 1.25, bearish), Green (≤ 0.75, bullish), Gray (0.75–1.25, neutral).
Updates on last confirmed bar to avoid redraws.
Using PR and VR for Market DirectionPremium Ratio (PR):PR ≥ 1.25 (Red): High put premiums suggest bearish sentiment (expect price drop).
PR ≤ 0.75 (Green): High call premiums suggest bullish sentiment (expect price rise).
0.75 < PR < 1.25 (Gray): Neutral, no clear direction.
Use: High PR favors bearish trades (e.g., buy puts); low PR favors bullish trades (e.g., buy calls).
Volume Ratio (VR):VR ≥ 1.25 (Red): High put volume indicates bearish activity.
VR ≤ 0.75 (Green): High call volume indicates bullish activity.
0.75 < VR < 1.25 (Gray): Neutral trading activity.
Use: High VR suggests bearish moves; low VR suggests bullish moves.
Combined Signals:High PR & VR: Strong bearish signal; consider put buying or call selling.
Low PR & VR: Strong bullish signal; consider call buying or put selling.
Mixed/Neutral: Use price action or support/resistance for confirmation.
Tips:Combine with technical analysis (e.g., trends, levels).
Match timeframe to trading horizon (e.g., 15-min for intraday).
Monitor FP for context; check volatility or news for accuracy.
ExampleNIFTY: FP = 24,237.50, ATM = 24,200, CPR = 120.25, PPR = 180.50, PR = 1.50 (Red), VR = 1.30 (Red).
Insight: High PR/VR suggests bearish bias; consider bearish trades if price nears resistance.
Action: Buy puts or exit longs, confirm with price action.
Conclusion: This script provides a concise tool for options traders, showing ATM strike, premiums, and PR/VR ratios. High PR/VR (≥ 1.25) signals bearish sentiment, low PR/VR (≤ 0.75) signals bullish sentiment, and neutral (0.75–1.25) suggests indecision. Combine with technical analysis for robust trading decisions in the Indian options market.

HV Spike Strategy (HVP + OR Breakout + Reversal + TP/SL Modes)Here is a script that I tried to make it simple, although it has several parameters, I will try to explain, here we go:
Logic: Open Range Breakout: otherwise knows as First Candle Rule, usually used for the first candle in the opening of a market session, in my strategy there is an option to use it even for Crypto that operate 24/7, how to do that? Simply by detecting Volatility from the HVP (Historical Volatility Percentile). Then the ORB logic kicks in and the first candle with high volatility gives the ranges for the trades. The proper HVP Activation Threshold has to be selected for each currency pair/index/crypto in order to have maximum profit.
Enter a trade: when the price goes 100% above/below the First Candle Rule Range. That way it is filtering fake breakouts. Also if the price reverses back into the range the strategy takes the opposite trade.
Exit a trade: SL/TP By percentage or ATR, selection in the input menu.
My intention is to avoid using lagging indicators or guessing of Price Action, purely Bull/Bear indication by the first candle.
I hope you find this helpful! Wishing all successful Trades!

ATR Trailing Stop with Entry Date & First-Day MultiplierATR based trailing stop based on a X post of Aksel Kibar.

Jesses 1.2This indicator detects Break of Structure (BOS) using a strict “break-only + one opposite candle to the left” rule. On confirmation, it draws a sticky zone box (orange for BUY, teal for SELL) anchored to the origin candle and extends it until breached. It includes session filtering (Sydney/Tokyo, London, New York in NZ time), optional origin-candle tint with adjustable opacity, and alerts that trigger only when a box is created. Internally it tracks bullish/bearish runs, enforces one-per-reference logic, rotates recent boxes, and freezes active boxes at the daily boundary.

Nosreme v6 - Kulture MetricsNosreme v6 — Kulture Metrics
The evolution of Klarity.
Nosreme brings refined volume intelligence and conviction-based trade mapping to the Kulture Metrics framework.
It only triggers when trend structure and real participation align — filtering false breakouts and fake volume.
Core Elements
• Simple Moving Average (SMA) defines trend bias
• Volume SMA filter validates momentum participation
• ATR-based dynamic risk levels project targets & stops
• Visual “BUY/SELL (Nosreme)” markers at confirmed triggers
• Background shading for directional bias (green = bullish, red = bearish)
Usage
Add to chart, any asset or timeframe (ideal: 15 min – 4 h).
Set alerts “Once per bar close” on Nosreme BUY or Nosreme SELL.
Tune ATR Multiplier / R:R ratio to match volatility profile.
Kulture Metrics • Detroit × Atlanta • Billions Mindset • © 2025
Precision. Discipline. Nosreme.

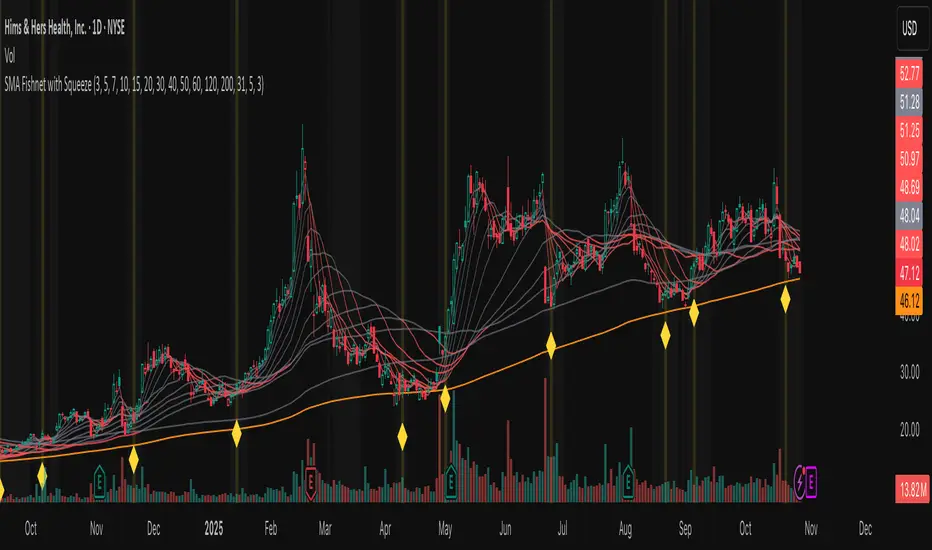
Fishnet Squeeze [Osprey]🟠 Overview
The SMA Fishnet with Squeeze indicator combines a multi-timeframe moving average ribbon system with an advanced squeeze detection algorithm to help traders identify both trend direction and potential breakout opportunities.
🟠 How to Use This Indicator
- Squeeze Breakout Trading
When the indicator signals a squeeze (yellow diamond marker and highlighted background), prepare for a potential breakout in either direction
- Support and Resistance Identification
The twelve SMA levels act as dynamic support and resistance zones. Price often bounces or pauses at these levels, especially at the convergence of multiple SMAs.
Squeeze Settings
- **Enable/Disable**: Toggle squeeze detection on or off
- **Lookback Period**: Adjust the historical comparison window (20-200 bars)
- **Percentile Threshold**: Set sensitivity for squeeze detection (1-20%)
- **Minimum Duration**: Define how many bars must confirm a squeeze (1-10)
- **Visual Customization**: Modify squeeze marker colors to suit your preferences
‼️ Test different values for Lookback Period ! Lower lookback period = more frequent squeeze marks. I suggest using 31 or 100.
🟠 The Fishnet Structure
The indicator employs twelve SMAs ranging from ultra-short-term (3-period) to long-term (200-period), creating a "fishnet" pattern on your chart. This graduated approach provides a comprehensive view of price action across multiple timeframes simultaneously:
🟠 Advanced Squeeze Detection Algorithm
The squeeze detection component identifies periods when all twelve SMAs converge into an unusually tight range, indicating market indecision and potential energy buildup. The algorithm uses several sophisticated filters:
1. ATR-Normalized Range Calculation: The indicator normalizes the SMA range using Average True Range (ATR) to ensure consistent squeeze detection across different volatility environments and price levels.
2. Historical Percentile Analysis: Compares the current normalized range against a customizable lookback period (default: 31 bars) to identify when SMAs are in the bottom percentile of historical tightness.
3. Statistical Validation: Uses z-score analysis to confirm that the current range is significantly below the mean, filtering out false signals.
4. Duration Confirmation: Requires the squeeze condition to persist for a minimum number of consecutive bars (default: 3) to validate genuine compression.
5. Local Minimum Verification: Confirms that the current squeeze represents the tightest point in recent history (20-bar window).
Directional EMA - For Loop | Lyro RSDirectional EMA - For Loop | Lyro RS
Introduction
This indicator combines multi-type moving averages, loop-based momentum scoring, and divergence detection for adaptive trend and reversal analysis.
Key Features:
Multiple Moving Average Selection System: Choose from 16 different MA types - HMA, ALMA and JMA etc. To match your style best.
For Loop Based Scoring: Uses a From / To system to calculate cumulative buying/selling pressure across recent price action.
Signal Threshold: Long / Short threshold levels to control the sensitivity for different market conditions.
Divergence Detection: Regular bullish / bearish with clear labels for potential reversal points.
Clean Visuals: Multiple color themes with table and color based indicator line for easy reading.
How It Works:
Core Calculation: The indicator first creates a directional signal by comparing price to your selected moving average, normalized for current volatility.
Loop Analysis: This signal feeds into a for-loop that scores recent price history, generating a cumulative momentum value.
Signal Generation:
Bullish signals trigger when the score crosses above the Upper Threshold
Bearish signals trigger when the score crosses below the Lower Threshold
Divergence Alerts: Automatically detects when price makes new highs/lows that aren't confirmed by the oscillator.
Practical Use:
Trend Identification: The color-coded oscillator and signal table help confirm trend direction.
Reversal Warning: Divergence labels highlight potential trend exhaustion points for careful watch.
Customization:
Adjust MA type and length for sensitivity tuning
Modify loop parameters (From/To) to change analysis depth
Fine-tune threshold levels for signal frequency
Enable/disable divergence detection as needed
⚠️ Disclaimer
This tool is for technical analysis education only. It does not guarantee results or constitute financial advice. Always use proper risk management and combine with other analysis methods. Past performance doesn't predict future results.

Bollinger Band Spread (Dunk)Bollinger Band Width measures the distance between the upper and lower Bollinger Bands. It reflects market volatility—wider bands mean higher volatility, narrower bands mean lower volatility.
When the width contracts to low levels, it can signal price consolidation and potential breakouts. When the width expands, it indicates active markets or strong trends.
Traders use it to spot volatility squeezes, confirm breakouts, and compare relative volatility across assets or timeframes.

Inflection Nexus - SPAInflection Nexus - SPA: Self-Adapting Trend Reversal System
Overview
Inflection Nexus - SPA (Shadow Portfolio Adaptation) is an adaptive trend-following indicator that automatically optimizes its parameters in real-time through a unique shadow testing methodology. Unlike traditional static indicators that use fixed ATR periods and multipliers, this system continuously evaluates multiple parameter combinations in the background and dynamically adjusts to current market conditions without manual intervention.
What Makes This Original
The core innovation is the Shadow Portfolio Adaptation (SPA) engine, which runs parallel virtual portfolios in the background to test different ATR period and multiplier combinations. The system tracks the performance of these shadow portfolios over rolling windows and automatically switches to the best-performing parameter set. This creates a self-improving indicator that adapts to changing volatility regimes, trending vs. ranging markets, and shifting market dynamics without requiring user reconfiguration.
This is not simply a combination of existing indicators. The SPA engine is a novel approach that transforms the traditional Supertrend methodology from a static tool into an adaptive system with built-in machine learning principles.
Core Components and How They Work Together
1. Adaptive Supertrend Foundation
The base trend detection uses an ATR-based Supertrend calculation with your chosen source (default: hlcc4 for smoothness). Rather than using fixed parameters, the system starts with your configured ATR Period and Multiplier as baseline values.
2. Shadow Portfolio Adaptation Engine
This is where the innovation happens. The system simultaneously tests multiple parameter variations in the background:
- Creates shadow portfolios with different ATR periods (spanning from your base period minus a range to plus a range)
- Tests different ATR multipliers for each period
- Each shadow portfolio tracks virtual trade performance over a configurable lookback window
- Calculates a confidence score based on win rate, profit factor, and trade frequency
- Automatically switches to the best-performing parameter combination
- Implements smooth transitions to prevent whipsaw from parameter changes
The adaptation happens continuously, allowing the system to shift from tight, responsive settings during low volatility to wider, more conservative settings during high volatility periods.
3. Signal Generation Logic
The system offers two complementary signal modes:
Reversal Mode (default): Identifies potential trend exhaustion points. A sell signal requires price to make a new structural high while the trend is bullish, then flip bearish. This captures the exact moment a trend runs out of momentum. The "Require New High/Low During Trend" filter ensures signals only occur at genuine extremes, not mid-range noise.
Breakout Mode (optional): Identifies trend continuation. Signals occur when price breaks to new highs/lows in the direction of the current trend, confirming momentum rather than reversing it.
4. Multi-Layer Confirmation Filters
Each signal passes through optional quality filters:
- RSI Momentum Filter : Ensures buy signals occur after RSI has been oversold (preventing buying into exhaustion) and sell signals occur after RSI has been overbought
- Volume Spike Confirmation : Requires increased volume relative to recent average, confirming conviction behind the move
- Major Level Filter : Ensures signals only occur after significant price moves (measured in ATR multiples), filtering out minor fluctuations
5. Risk Management Integration
The dashboard displays real-time metrics including:
- Current regime classification (Trending, Volatile, Ranging)
- Shadow portfolio performance tracking
- Adaptive confidence scores
- Parameter evolution log
- Market heat map showing probability zones
How to Use This Indicator
Setup:
1. Apply the indicator to your chart
2. Start with default settings for your first session
3. The SPA engine requires a warm-up period (controlled by "Learning Window") to gather sufficient data - expect optimal adaptation after 100-200 bars
4. Enable the dashboard to monitor the adaptation process and current market regime
Signal Interpretation:
- Long signals (green triangles below price): Enter long when the system detects a potential bullish reversal or breakout
- Short signals (red triangles above price): Enter short when the system detects a potential bearish reversal or breakout
- Dashboard color coding : Green regime = favorable for trend-following, Yellow = volatile (use caution), Red = choppy (consider reducing position size)
Best Practices:
- Use Reversal Mode in swing trading environments where you want to catch major turning points
- Use Breakout Mode in strong trending markets where you want confirmation entries
- Enable both modes for comprehensive coverage, but filter by the regime indicator
- The "Min Bars Between Signals" setting prevents over-trading - start at 10-12 bars for most timeframes
- Pay attention to the "Map Heat" metric - higher active cells indicate more defined market structure
Parameter Optimization:
The system is designed to self-optimize, but you can guide it:
- Sensitivity : Lower values (15-25) for intraday scalping, higher values (40-60) for swing trading
- ATR Period : Your baseline starting point - the SPA engine will explore around this value
- Multiplier : Your baseline band width - the engine tests variations of this
- Learning Window : How many bars of data the shadow portfolios evaluate (200-500 for most markets)
- Adaptation Frequency : How often the system checks for better parameters (30-50 bars balances responsiveness and stability)
Dashboard Insights:
The three-panel dashboard provides real-time intelligence:
- Panel A shows current signal state, trend direction, and overall market regime
- Panel B displays shadow portfolio statistics, confidence scores, and the adaptation log
- The regime classification helps you understand if current market conditions favor trending strategies or if you should reduce exposure
Calculation Methodology
The system operates in three phases:
Phase 1 - Base Calculation:
- Calculates ATR using your specified period and method (RMA for smoothness)
- Identifies structural highs/lows using the sensitivity parameter
- Computes initial Supertrend bands: Price ± (ATR × Multiplier)
Phase 2 - Shadow Testing:
- Creates a grid of parameter combinations (ATR periods from base-5 to base+15, multipliers from base-0.5 to base+1.0)
- For each combination, simulates trade entries and exits over the learning window
- Tracks metrics: win rate, profit factor, max drawdown, trade count
- Calculates a confidence score using weighted metrics (win rate × 0.4 + profit factor × 0.3 + normalized trade frequency × 0.3)
Phase 3 - Adaptive Selection:
- Every N bars (adaptation frequency), ranks all shadow portfolios by confidence score
- Selects the highest-scoring parameter set
- Implements parameter change with transition smoothing to prevent signal disruption
- Logs the change and updates the dashboard
This creates a continuous feedback loop where the indicator learns from recent market behavior and adjusts its sensitivity accordingly.
Ideal Market Conditions
Best Performance:
- Markets with clear swing structure (forex majors, liquid stocks, major indices)
- Timeframes from 5-minute to daily (indicator adapts across timeframes)
- Trending markets with periodic consolidations (where reversals are meaningful)
Challenging Conditions:
- Extremely low liquidity assets (insufficient price action for adaptation)
- Very low timeframes (1-minute or below) where noise dominates
- Markets in deep consolidation for extended periods (the system will reduce signal frequency appropriately)
Technical Notes
- The indicator uses lookback functions with a 5000-bar maximum, ensuring sufficient historical context
- Shadow portfolios are lightweight - they don't execute actual trades, only track hypothetical P&L
- The confidence-based selection prevents the system from chasing random variations
- The minimum bars between signals prevents over-fitting to short-term fluctuations
- All calculations are performed on closed bars to prevent repainting
Recommended Settings by Trading Style
Day Trading (5-15 min charts):
- Sensitivity: 20-30
- ATR Period: 14-20
- Multiplier: 1.2-1.5
- Min Bars Between Signals: 8-12
- Enable RSI Filter: Yes
Swing Trading (1H-4H charts):
- Sensitivity: 30-50
- ATR Period: 20-30
- Multiplier: 1.5-2.0
- Min Bars Between Signals: 10-15
- Enable Major Levels Only: Optional
Position Trading (Daily charts):
- Sensitivity: 50-80
- ATR Period: 30-40
- Multiplier: 2.0-2.5
- Min Bars Between Signals: 5-10
- Enable Breakout Mode: Consider
The SPA engine will refine these starting points automatically based on actual market performance.
Important Disclaimers
This indicator is a technical analysis tool designed to identify potential trend changes and continuation points. It should not be used as a standalone trading system. Always combine with proper risk management, position sizing, and additional confirmation methods. Past performance of the adaptation engine does not guarantee future results. The shadow portfolio system is designed to improve parameter selection, but no indicator can predict market movements with certainty.
— Dskyz, Trade with insight. Trade with anticipation.
