RSI Median DeviationRSI Median Deviation – Adaptive Statistical RSI for High-Probability Extremes
The Relative Strength Index (RSI) is a momentum oscillator developed by J. Welles Wilder in 1978 to measure the magnitude of recent price changes and identify potential overbought or oversold conditions. It calculates the ratio of upward to downward price movements over a specified period, scaled to 0-100. However, standard RSI often relies on fixed thresholds like 70/30, which can produce unreliable signals in varying market regimes due to their lack of adaptability to the actual distribution of RSI values.
This indicator was developed because I needed a reliable tool for spotting intermediate high-probability bottoms and tops. Instead of arbitrary horizontal lines, it uses the RSI’s own historical median as a dynamic centerline and measures how far the current RSI deviates from that median over a chosen lookback period. The main signals are triggered only at 2 standard deviation (2σ) extremes — statistically rare events that occur roughly 5 % of the time under a normal distribution. I selected 2σ because it is extreme enough to be meaningful yet frequent enough for practical trading. For oversold signals I further require RSI to be below 42, a filter that significantly improved results in my mean-reversion tests (enter on oversold, exit on the first bar the condition is no longer true).
The combination of percentile median + standard deviation bands is deliberate: the median is far more robust to outliers than a simple average, while the SD bands automatically adjust to the current volatility of the RSI itself, producing adaptive envelopes that work equally well in ranging and trending markets.
Underlying Concepts and Calculations
Base RSI: RSI = 100 − (100 / (1 + RS)), RS = average gain / average loss (default length 10).
Percentile Median: 50th percentile of the last "N" RSI values (default 28 = 4 weeks)
→ dynamic, outlier-resistant centerline.
Standard Deviation Bands: rolling stdev of RSI (default length 27 = = 4 weeks (almost))
→ bands = median ± 1σ / 2σ.
Optional Dynamic MA Envelopes: user-selectable moving average (TEMA, WMA, etc., default WMA length 37) for additional momentum context.
Trend Bias Coloring
Independent of the statistical extremes, the RSI line itself is colored green when above the user-defined Long Threshold (default 60) and red when below the Short Threshold (default 47). This provides an instant bullish/bearish bias overlay similar to classic RSI usage, without interfering with the main 2σ extreme signals.
Extremes are highlighted with background color (green for oversold 2σ + RSI<42, magenta for overbought 2σ) and small diamond markers for ultra-extremes (RSI <25 or >85).
Originality and Development Rationale
The indicator was built and refined through extensive testing on dozens of assets including major cryptocurrencies:
(BTC, ETH, SOL, SUI, BNB, XRP, TRX, DOGE, LINK, PAXG, CVX, HYPE, VIRTUAL and many more),
the Magnificent 7 stocks,, QQQ, SPX, and gold.
Default parameters were chosen to deliver consistent profitability in simple mean-reversion setups while maximizing Sortino ratio and minimizing maximum drawdown across this broad universe — ensuring the settings are robust and not overfitted to any single instrument or timeframe.
How to Use It
Ideal for swing / position trading on the 1h to daily charts (the same defaults work).
Oversold (high-probability long): RSI crosses below lower 2σ band AND RSI < 42
→ green background
→ enter long, exit the first bar the condition disappears.
Overbought (high-probability short): RSI crosses above upper 2σ band
→ magenta background
→ enter short, exit on opposite signal or at median. (Shorts were not tested, it's only an idea)
Use the green/red RSI line coloring for quick trend context and to avoid fighting strong momentum.
Always confirm with price action and manage risk appropriately.
This indicator is not a standalone trading system.
Disclaimer: This is not financial advice. Backtests are based on past results and are not indicative of future performance.
ボラティリティ

Standard Deviation Levels with Settlement Price and VolatilityStandard Deviation Levels with Settlement Price and Volatility.
This indicator plots the standard deviation levels based on the settlement price and the implied volatility. It works for all Equity Stocks and Futures.
For Futures
Symbol Volatility Symbol (Implied Volatility)
NQ VXN
ES VIX
YM VXD
RTY RVX
CL OVX
GC GVZ
BTC DVOL
The plot gives you an ideas that the price has what probability staying in the range of 1SD,2SD,3SD ( In normal distribution method)
Please provide the feedback or comments if you find any improvements

ATR R-LevelsATR-R Levels is built for clarity of risk management.
The script takes your account size, chosen risk %, and the market’s volatility, then turns all of that into exact stop-loss, take-profit, and position size so there’s no guessing.
It’s inspired by key principles from NNFX, especially ATR-based stop placement and fixed-risk position sizing, but redesigned for fast intraday crypto trading. You get the same consistency and discipline NNFX is known for, adapted to a much shorter timeframe.
ATR-R Levels gives you:
A volatility-based stop using ATR
A clean 2R (or custom R-multiple) target
Automatic position sizing based on your risk rules
A simple HUD showing ATR, entry, stop, TP, size, and risk
Optional net profit estimates after fees
Let me know what you think or if you use it!


Volatility Trend FollowerThe script combines several classic technical analysis techniques:
SuperTrend / Adaptive Band - The main idea comes from the SuperTrend indicator, which uses ATR (Average True Range) to create a trailing band that adapts to volatility
ATR (Average True Range) - A volatility measure developed by J. Welles Wilder Jr.
EMA (Exponential Moving Average) - Used as a global trend filter
Heikin Ashi - An option to smooth prices and reduce noise

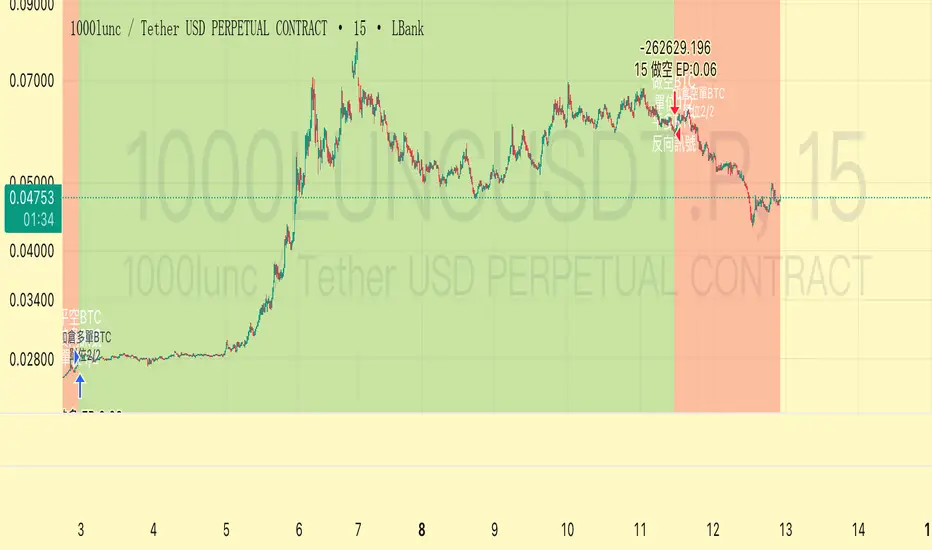
Trend Following $BTC - Multi-Timeframe Structure + ReversTREND FOLLOWING STRATEGY - MULTI-TIMEFRAME STRUCTURE BREAKOUT SYSTEM
Strategy Overview
This is an enhanced Turtle Trading system designed for cryptocurrency spot trading. It combines Donchian Channel breakouts with multi-timeframe structure filtering and ATR-based dynamic risk management. The strategy trades both long and short positions using reverse signal exits to maximize trend capture.
Core Features
Multi-Timeframe Structure Filtering
The strategy uses Swing High/Low analysis to identify market structure trends. You can customize the structure timeframe (default: 3 minutes) to match your trading style. Only enters trades aligned with the identified trend direction, avoiding counter-trend positions that often lead to losses.
Reverse Signal Exit System
Instead of using fixed stop-losses or time-based exits, this strategy exits positions only when a reverse entry signal triggers. This approach maximizes trend profits and reduces premature exits during normal market retracements.
ATR Dynamic Pyramiding
Automatically adds positions when price moves 0.5 ATR in your favor. Supports up to 2 units maximum (adjustable). This pyramid scaling enhances profitability during strong trends while maintaining disciplined risk management.
Complete Risk Management
Fixed position sizing at 5000 USD per unit. Includes realistic commission fees of 0.06% (Binance spot rate). Initial capital set at 10,000 USD. All backtest parameters reflect real-world trading conditions.
Trading Logic
Entry Conditions
Long Entry: Close price breaks above the 20-period high AND structure trend is bullish (price breaks above Swing High)
Short Entry: Close price breaks below the 20-period low AND structure trend is bearish (price breaks below Swing Low)
Position Scaling
Long positions: Add when price rises 0.5 ATR or more
Short positions: Add when price falls 0.5 ATR or more
Maximum 2 units including initial entry
Exit Conditions
Long Exit: Triggers when short entry signal appears (price breaks 20-period low + structure turns bearish)
Short Exit: Triggers when long entry signal appears (price breaks 20-period high + structure turns bullish)
Default Parameters
Channel Settings
Entry Channel Period: 20 (Donchian Channel breakout period)
Exit Channel Period: 10 (reserved parameter)
ATR Settings
ATR Period: 20
Stop Loss ATR Multiplier: 2.0
Add Position ATR Multiplier: 0.5
Structure Filter
Swing Length: 300 (Swing High/Low calculation period)
Structure Timeframe: 3 minutes
Adjust these based on your trading timeframe and asset volatility
Position Management
Maximum Units: 2 (including initial entry)
Capital Per Unit: 5000 USD
Visualization Features
Background Colors
Light Green: Bullish market structure
Light Red: Bearish market structure
Dark Green: Long position entry
Dark Red: Short position entry
Optional Display Elements (Default: OFF)
Entry and exit channel lines
Structure high/low reference lines
ATR stop-loss indicator
Next position add level
Entry/exit labels
Alert Message Format
The strategy sends notifications with the following format:
Entry: "5m Long EP:90450.50"
Add Position: "15m Add Long 2/2 EP:91000.25"
Exit: "5m Close Long Reverse Signal"
Where the first part shows your current chart timeframe and EP indicates Entry Price
Backtest Settings
Capital Allocation
Initial Capital: 10,000 USD
Per Entry: 5,000 USD (split into 2 potential entries)
Leverage: 0x (spot trading only)
Trading Costs
Commission: 0.06% (Binance spot VIP0 rate)
Slippage: 0 (adjust based on your experience)
Best Use Cases
Ideal Scenarios
Trending markets with clear directional movement
Moderate to high volatility assets
Timeframes from 1-minute to 4-hour charts
Best suited for major cryptocurrencies with good liquidity
Not Recommended For
Highly volatile choppy/ranging markets
Low liquidity small-cap coins
Extreme market conditions or black swan events
Usage Recommendations
Timeframe Guidelines
1-5 minute charts: Use for scalping, consider Swing Length 100-160
15-30 minute charts: Good for short-term trading, Swing Length 50-100
1-4 hour charts: Suitable for swing trading, Swing Length 20-50
Optimization Tips
Always backtest on historical data before live trading
Adjust swing length based on asset volatility and your timeframe
Different cryptocurrencies may require different parameter settings
Enable visualization options initially to understand entry/exit points
Monitor win rate and drawdown during backtesting
Technical Details
Built on Pine Script v6
No repainting - uses proper bar referencing with offset
Prevents lookahead bias with lookahead=off parameter
Strategy mode with accurate commission and slippage modeling
Multi-timeframe security function for structure analysis
Proper position state tracking to avoid duplicate signals
Risk Disclaimer
This strategy is provided for educational and research purposes only. Past performance does not guarantee future results. Backtesting results may differ from live trading due to slippage, execution delays, and changing market conditions. The strategy performs best in trending markets and may experience drawdowns during ranging conditions. Always practice proper risk management and never risk more than you can afford to lose. It is recommended to paper trade first and start with small position sizes when going live.
How to Use
Add the strategy to your TradingView chart
Select your desired timeframe (1m to 4h recommended)
Adjust parameters based on your risk tolerance and trading style
Review backtest results in the Strategy Tester tab
Set up alerts for automated notifications
Consider paper trading before risking real capital
Tags
Trend Following, Turtle Trading, Donchian Channel, Structure Breakout, ATR, Cryptocurrency, Spot Trading, Risk Management, Pyramiding, Multi-Timeframe Analysis
---
Strategy Name: Trend Following BTC
Version: v1.0
Pine Script Version: v6
Last Updated: December 2025
FF calculation Saptarshi ChatterjeeForward factor (in options contexts) measures implied volatility (IV) for a future period between two expirations, like from 30 DTE (days to expiry) front-month to 60 DTE back-month options.
This indicator calculates the FORWARD FACTOR(FF) using 2 IVs of 2 DTEs.
+ve value means front DTE is rich in premium and back expiry is cheap.
-ve value means front DTE IV is cheap and 2nd DTE is expensive
we can use this term structure disbalance to trade calendar spreads with edge.

Trend Following $ZEC - Multi-Timeframe Structure Filter + Revers# Trend Following CRYPTOCAP:ZEC - Strategy Guide
## 📊 Strategy Overview
Trend Following CRYPTOCAP:ZEC is an enhanced Turtle Trading system designed for cryptocurrency spot trading, combining Donchian Channel breakouts, multi-timeframe structure filtering, and ATR-based dynamic risk management for both long and short positions.
---
## 🎯 Core Features
1. Multi-Timeframe Structure Filtering
- Uses Swing High/Low to identify market structure
- Customizable structure timeframe (default: 1 minute)
- Only enters trades in the direction of the trend, avoiding counter-trend positions
2. Reverse Signal Exit
- No fixed stop-loss or fixed-period exits
- Exits only when a reverse entry signal triggers
- Maximizes trend profits, reduces premature exits
3. ATR Dynamic Pyramiding
- Adds positions when price moves 0.5 ATR in favorable direction
- Supports up to 2 units maximum (adjustable)
- Pyramid scaling to enhance profitability
4. Complete Risk Management
- Fixed position size (5000 USD per unit)
- Commission fee 0.06% (Binance spot rate)
- Initial capital 10,000 USD
---
## 📈 Trading Logic
Entry Conditions
✅ Long Entry:
- Close price breaks above 20-period high
- Structure trend is bullish (price breaks above Swing High)
✅ Short Entry:
- Close price breaks below 20-period low
- Structure trend is bearish (price breaks below Swing Low)
Add Position Conditions
- Long: Price rises ≥ 0.5 ATR
- Short: Price falls ≥ 0.5 ATR
- Maximum 2 units including initial entry
Exit Conditions
- Long Exit: When short entry signal triggers (price breaks 20-period low + structure turns bearish)
- Short Exit: When long entry signal triggers (price breaks 20-period high + structure turns bullish)
---
## ⚙️ Parameter Settings
Channel Settings
- Entry Channel Period: 20 (Donchian Channel breakout period)
- Exit Channel Period: 10 (reserved parameter, actually uses reverse signal exit)
ATR Settings
- ATR Period: 20
- Stop Loss ATR Multiplier: 2.0 (reserved parameter)
- Add Position ATR Multiplier: 0.5
Structure Filter
- Swing Length: 160 (Swing High/Low calculation period)
- Structure Timeframe: 1 minute (can change to 5/15/60, etc.)
Position Management
- Maximum Units: 2 (including initial entry)
- Capital Per Unit: 5000 USD
---
## 🎨 Visualization Features
Background Colors
- Light Green: Bullish structure
- Light Red: Bearish structure
- Dark Green: Long entry
- Dark Red: Short entry
Optional Display (Default: OFF)
- Entry/exit channel lines
- Structure high/low lines
- ATR stop-loss line
- Next add position indicator
- Entry/exit labels
---
## 📱 Alert Message Format
Strategy sends notifications on entry/exit with the following format:
- Entry: `1m Long EP:428.26`
- Add Position: `15m Add Long 2/2 EP:429.50`
- Exit: `1m Close Long Reverse Signal`
Where:
- `1m`/`15m` = Current chart timeframe
- `EP` = Entry Price
---
## 💰 Backtest Settings
Capital Allocation
- Initial Capital: 10,000 USD
- Per Entry: 5,000 USD (split into 2 entries)
- Leverage: 0x (spot trading)
Trading Costs
- Commission: 0.06% (Binance spot VIP0)
- Slippage: 0
---
## 🎯 Use Cases
✅ Best Scenarios
- Trending markets
- Moderate volatility assets
- 1-minute to 4-hour timeframes
⚠️ Not Suitable For
- Highly volatile choppy markets
- Low liquidity small-cap coins
- Extreme market conditions (black swan events)
---
## 📊 Usage Recommendations
Timeframe Suggestions
| Timeframe | Trading Style | Suggested Parameter Adjustment |
|-----------|--------------|-------------------------------|
| 1-5 min | Scalping | Swing Length 100-160 |
| 15-30 min | Short-term | Swing Length 50-100 |
| 1-4 hour | Swing Trading | Swing Length 20-50 |
Optimization Tips
1. Adjust swing length based on backtest results
2. Different coins may require different parameters
3. Recommend backtesting on 1-minute chart first before live trading
4. Enable labels to observe entry/exit points
---
## ⚠️ Risk Disclaimer
1. Past Performance Does Not Guarantee Future Results
- Backtest data is for reference only
- Live trading may be affected by slippage, delays, etc.
2. Market Condition Changes
- Strategy performs better in trending markets
- May experience frequent stops in ranging markets
3. Capital Management
- Do not invest more than you can afford to lose
- Recommend setting total capital stop-loss threshold
4. Commission Impact
- Frequent trading accumulates commission fees
- Recommend using exchange discounts (BNB fee reduction, etc.)
---
## 🔧 Troubleshooting
Q: No entry signals?
A: Check if structure filter is too strict, adjust swing length or timeframe
Q: Too many labels displayed?
A: Turn off "Show Labels" option in settings
Q: Poor backtest performance?
A:
1. Check if the coin is suitable for trend-following strategies
2. Adjust parameters (swing length, channel period)
3. Try different timeframes
Q: How to set alerts?
A:
1. Click "Alert" in top-right corner of chart
2. Condition: Select "Strategy - Trend Following CRYPTOCAP:ZEC "
3. Choose "Order filled"
4. Set notification method (Webhook/Email/App)
---
## 📞 Contact Information
Strategy Name: Trend Following CRYPTOCAP:ZEC
Version: v1.0
Pine Script Version: v6
Last Updated: December 2025
---
## 📄 Copyright Notice
This strategy is for educational and research purposes only.
All risks of using this strategy for live trading are borne by the user.
Commercial use without authorization is prohibited.
---
## 🎓 Learning Resources
To understand the strategy principles in depth, recommended reading:
- "The Complete TurtleTrader" - Curtis Faith
- "Trend Following" - Michael Covel
- TradingView Pine Script Official Documentation
---
Happy Trading! Remember to manage your risk 📈


StrategyScript77 Is a rule-based strategy built on top of an Ichimoku based engine.
Ichimoku concepts are used as the backbone for trend and momentum filtering, so the strategy tends to stay on the side of the dominant move instead of fighting it.
The name “Super77” comes from the behavior I consistently observed in testing because the win rate tends to hover around the 70–80% range, often clustering around ~77% when used as intended.
It’s not a promise or guarantee, but it reflects the core design philosophy: frequent, relatively small but steady wins, with controlled and manageable losses.
Trading Style – Built for Conservative Traders
Super77 is intentionally designed for traders who prefer a conservative and calm approach:
Entries only at bar close
The strategy waits for bar close confirmation before entering a position. No intrabar guessing, no chasing half-formed signals. If the signal is still valid at close, only then will it enter.
Exits automated on bar close
Exits are also managed on bar close, which makes the logic transparent, easy to review on the chart, and more robust in backtesting compared to tick-based or intrabar hacks.
Semi-auto friendly
If you like to keep some discretion, you can treat it as semi-automatic:
Let the strategy generate entry signals
Manually cancel or skip certain trades if market context changes (news, extreme volatility, etc.)
This combination makes Super77 suitable for traders who don’t want to stare at the screen all day but still want structure and automation.
How to Use
Works best with bar-close execution (avoid trying to simulate intrabar fills if you want consistent behavior).
Designed for conservative, trend-aligned trading, not for hyper-scalping or news gambling.
Can be used as:
Fully automated (let all entries/exits trigger on bar close), or
Semi-automated (use alerts/signals but manually cancel some entries).
Step-by-Step: Automation with Cornix (Webhook Setup)
You can automate Super77 using Cornix by connecting TradingView alerts to your Cornix group via webhook.
Note: Exact button names may differ slightly depending on Cornix / TradingView updates, but the flow is always the same:
Cornix group → get webhook URL & mapping → TradingView alerts → signals sent to Cornix.
(Optional) Map specific pairs / directions
If you use UUID / signal mapping per symbol and per side (long/short), set them up in Cornix according to your own template.
Super77 can be used either:
On a single pair (simple setup), or
On multiple pairs if your alert / webhook structure supports that. So you can pick many pairs with 1 script.
Final Notes & Disclaimer
Super77 is an educational and experimental trading tool, not financial advice.
Past performance in back tests does not guarantee future results.
Always:
Test on demo or paper first
Adjust risk to match your own profile
Accept that losses and drawdowns are a natural part of any strategy
If you’re looking for a strategy that reflects a conservative, confirmation-based trading style with a focus on steady win rate and smoother equity behavior, Super77 was built exactly with that mindset in mind.

Volatility Value BandsThis indicator is a modern adaptation of Mark Helweg's original Value Charts concept, focused on visually displaying volatility zones and "extreme value" areas directly on the price chart. It does not replicate the original work but draws inspiration from the logic of normalizing price by volatility to highlight statistically stretched regions.
1. Introduction
This study displays three lines directly on the chart:
- a central reference line (base),
- an upper overvaluation band,
- and a lower undervaluation band.
The bands are calculated from the relationship between price, moving average, and volatility (via true range/ATR), following Mark Helweg's Value Charts concept but with a custom implementation and adjustable parameters for different assets and timeframes. This allows objectively visualizing when price is in a statistically extended region relative to its recent behavior.
2. Key Features
- Volatility-normalized base
The indicator converts price deviation into "value units" using a combination of moving average and smoothed volatility (true range/ATR), making levels comparable across different assets and time horizons.
- Auto-adjusting limits (optional)
An automatic mode can calculate upper and lower limits from recent value unit extremes, using a configurable sampling window and percentile, allowing bands to adapt to the current volatility regime without manual recalibration.
- Direct plot on price chart
The three lines (central, upper, and lower) are drawn directly on the main asset chart (`overlay`), making it easy to read context: it's clear when price "touches" or breaks the volatility bands without switching to a separate pane.
- Flexible parameters
Users can control:
- base moving average period (length)
- volatility factor (manual or automatic)
- independent windows for volatility and limits calculation
- limits mode (auto or manual) and percentile used
This allows adapting behavior to different markets (stocks, indices, forex, crypto).
3. How to Use
- Basic interpretation
- When price approaches or exceeds the upper band, it indicates a statistically overvalued zone where the asset is stretched upward relative to recent volatility.
- When price approaches or exceeds the lower band, it indicates a statistically undervalued zone.
- The central line serves as a reference for recent "average value," derived from the base moving average.
- Recommended initial setup
- Choose the Value Chart period (e.g., 144 bars) for the base.
- Enable automatic limits mode for coherent bands matching the asset's volatility.
- Adjust the limits window and percentile for tighter bands (more signals) or wider bands (fewer but more extreme).
- Best practices
- Use bands as context filters, not standalone buy/sell signals. Combine with trend, market structure, or other confirmation indicators.
- Avoid decisions solely because price touched a band; in strong trends, price can "walk the edge" for extended periods.
- Always follow TradingView community rules when publishing: clearly state in the description that the study is "inspired by Mark Helweg's Value Charts concept," without claiming official status, reproducing proprietary code, or violating copyrights.

IV vs Realised Volatility (VIX/HV Comparator)VIX / HV Comparator – Implied vs Realised Volatility
This indicator compares Implied Volatility (IV) from a volatility index (VIX, India VIX, etc.) with the Realised / Historical Volatility (HV) of the current chart symbol.
It helps you see whether options are pricing volatility as rich or cheap relative to what the underlying is actually doing.
What it does
Pulls IV from any user-selected vol index symbol (e.g. CBOE:VIX for SPX, NSEINDIA:INDIAVIX for Nifty).
Calculates realised volatility from the chart’s price data using returns over a user-defined lookback.
Annualises HV so IV and HV are displayed on the same percentage scale, on any timeframe (intraday or higher).
Optionally shows an IV/HV ratio in a separate pane to highlight when options are rich or cheap relative to realised volatility.
How to read it
Main panel:
Orange line – Implied Volatility (IV) from your chosen vol index.
Aqua line – Realised / Historical Volatility (HV) of the current chart symbol.
Fill between lines:
Green shading -> IV > HV -> options are priced richer than what the underlying is currently realising.
Red shading -> HV > IV -> realised vol is higher than the options market is implying.
Sub-panel (optional):
IV / HV ratio
- Above 1 -> IV > HV (vol rich).
- Below 1 -> IV < HV (vol cheap).
- Horizontal guides (for example 1.2 / 0.8) help frame “significantly rich/cheap” zones.
A small label on the latest bar displays the current IV, HV and their difference in vol points.
Inputs (key ones)
IV Index Symbol – choose the volatility index that corresponds to your underlying (VIX, India VIX, etc.).
Realised Vol Lookback – number of bars used to compute HV (for example 20).
Trading Days per Year and Active Hours per Day – used for annualising HV so it stays consistent across timeframes.
IV Scale Factor – adjust if your IV index is quoted in decimals (0.15) instead of points (15).
Practical uses
Context for options trades – Quickly see if current IV is high or low relative to realised volatility when deciding on strategies (premium selling vs buying, spreads, hedges).
Vol regime analysis – Track shifts where HV starts to rise above IV (real stress building) or IV spikes far above HV (fear premium / insurance bid).
Cross-timeframe checks – Use on intraday charts for short-term trading context, or on daily/weekly charts for bigger picture vol regimes.
This tool is not a stand-alone signal generator. It is meant to be a volatility dashboard you combine with your usual price action, trend, and options strategy rules to understand how the options market is pricing risk vs what the underlying is actually delivering.

Institutional Equity DashboardAn overlay indicator with everything you need:
Trend Ribbon - 8/21/50/200 EMA cloud with bullish/bearish fill
VWAP + Bands - The institutional benchmark with deviation bands
Auto S/R Detection - Pivot-based support/resistance levels
ATR-Based Stops - Dynamic stop-loss levels that adjust to volatility
Confluence Signals - Multi-factor buy/sell signals (regular + strong)
Real-Time Dashboard showing:
Market regime (Strong Uptrend → Strong Downtrend)
Trend score (0-100)
RSI, MACD, Stochastic status
Volume ratio and VWAP position
Risk metrics (ATR%, Historical Vol, Risk Level)
Relative strength vs. benchmark

Elliott Wave Full Fractal System v2.0Elliott Wave Full Fractal System v2.0 – Q.C. FINAL (Guaranteed R/R)
Elliott Wave Full Fractal System is a multi-timeframe wave engine that automatically labels Elliott impulses and ABC corrections, then builds a rule-based, ATR-driven risk/reward framework around the “W3–W4–W5” leg.
“Guaranteed R/R” here means every order is placed with a predefined stop-loss and take-profit that respect a minimum Reward:Risk ratio – it does not mean guaranteed profits.
Core Idea
This strategy turns a full fractal Elliott Wave labelling engine into a systematic trading model.
It scans fractal pivots on three wave degrees (Primary, Intermediate, Minor) to detect 5-wave impulses and ABC corrections.
A separate “Trading Degree” pivot stream, filtered by a 200-EMA trend filter and ATR-based dynamic pivots, is then used to find W4 pullback entries with a minimum, user-defined Reward:Risk ratio.
Default Properties & Risk Assumptions
The backtest uses realistic but conservative defaults:
// Default properties used for backtesting
strategy(
"Elliott Wave Full Fractal System - Q.C. FINAL (Guaranteed R/R)",
overlay = true,
initial_capital = 10000, // realistic account size
default_qty_type = strategy.percent_of_equity,
default_qty_value = 1, // 1% risk per trade
commission_type = strategy.commission.cash_per_contract,
commission_value = 0.005, // example stock commission
slippage = 0 // see notes below
)
Account size: 10,000 (can be changed to match your own account).
Position sizing: 1% of equity per trade to keep risk per idea sustainable and aligned with TradingView’s recommendations.
Commission: 0.005 cash per contract/share as a realistic example for stock trading.
Slippage: set to 0 in code for clarity of “pure logic” backtesting. Real-life trading will experience slippage, so users should adjust this according to their market and broker.
Always re-run the backtest after changing any of these values, and avoid using high risk fractions (5–10%+) as that is rarely sustainable.
1. Full Fractal Wave Engine
The script builds and maintains four pivot streams using ATR-adaptive fractals:
Primary Degree (Macro Trend):
Captures the large swings that define the major trend. Labels ①–⑤ and ⒶⒷⒸ using blue “Circle” labels and thicker lines.
Intermediate Degree (Trading Degree):
Captures the medium swings (swing-trading horizon). Uses teal labels ( (1)…(5), (A)(B)(C) ).
Minor Degree (Micro Structure):
Tracks short-term swings inside the larger waves. Uses red roman numerals (i…v, a b c).
ABC Corrections (Optional):
When enabled, the engine tries to detect standard A–B–C corrective structures that follow a completed 5-wave impulse and plots them with dashed lines.
Each degree uses a dynamic pivot lookback that expands when ATR is above its EMA, so the system naturally requires “stronger” pivots in volatile environments and reacts faster in quiet conditions.
2. Theory Rules & Strict Mode
Normal Mode: More permissive detection. Designed to show more wave structures for educational / exploratory use.
Strict Mode: Enforces key Elliott constraints:
Wave 3 not shorter than waves 1 and 5.
No invalid W4 overlap with W1 (for standard impulses).
ABC Logic: After a confirmed bullish impulse, the script expects a down-up-down corrective pattern (A,B,C). After a bearish impulse, it looks for up-down-up.
3. Trend Filter & Pivots
EMA Trend Filter: A configurable EMA (default 200) is used as a non-wave trend filter.
Price above EMA → Only long setups are considered.
Price below EMA → Only short setups are considered.
ATR-Adaptive Pivots: The pivot engine scales its left/right bars based on current ATR vs ATR EMA, making waves and trading pivots more robust in volatile regimes.
4. Dynamic Risk Management (Guaranteed R/R Engine)
The trading engine is designed around risk, not just pattern recognition:
ATR-Based Stop:
Stop-loss is placed at:
Entry ± ATR × Multiplier (user-configurable, default 2.0).
This anchors risk to current volatility.
Minimum Reward:Risk Ratio:
For each setup, the script:
Computes the distance from entry to stop (risk).
Projects a take-profit target at risk × min_rr_ratio away from entry.
Only accepts the setup if risk is positive and the required R:R ratio is achievable.
Result: Every order is created with both TP and SL at a predefined distance, so each trade starts with a known, minimum Reward:Risk profile by design.
“Guaranteed R/R” refers exclusively to this order placement logic (TP/SL geometry), not to win-rate or profitability.
5. Trading Logic – W3–W4–W5 Pattern
The Trading pivot stream (separate from visual wave degrees) looks for a simple but powerful pattern:
Bullish structure:
Sequence of pivots forms a higher-high / higher-low pattern.
Price is above the EMA trend filter.
A strong “W3” leg is confirmed with structure rules (optionally stricter in Strict mode).
Entry (Long – W4 Pullback):
The “height” of W3 is measured.
Entry is placed at a configurable Fibonacci pullback (default 50%) inside that leg.
ATR-based stop is placed below entry.
Take-profit is projected to satisfy min Reward:Risk.
Bearish structure:
Mirrored logic (lower highs/lows, price below EMA, W3 down, W4 retrace up, W5 continuation down).
Once a valid setup is found, the script draws a colored box around the entry zone and a label describing the type of signal (“LONG SETUP” or “SHORT SETUP”) with the suggested limit price.
6. Orders & Execution
Entry Orders: The strategy uses limit orders at the computed W4 level (“Sniper Long” or “Sniper Short”).
Exits: A single strategy.exit() is attached to each entry with:
Take-profit at the projected minimum R:R target.
Stop-loss at ATR-based level.
One Trade at a Time: New setups are only used when there is no open position (strategy.opentrades == 0) to keep the logic clear and risk contained.
7. Visual Guide on the Chart
Wave Labels:
Primary: ①,②,③,④,⑤, ⒶⒷⒸ
Intermediate: (1)…(5), (A)(B)(C)
Minor: i…v, a b c
Trend EMA: Single blue EMA showing the dominant trend.
Setup Boxes:
Green transparent box → long entry zone.
Red transparent box → short entry zone.
Labels: “LONG SETUP / SHORT SETUP” labels mark the proposed limit entry with price.
8. How to Use This Strategy
Attach the strategy to your chart
Choose your market (stocks, indices, FX, crypto, futures, etc.) and timeframe (for example 1h, 4h, or Daily). Then add the strategy to the chart from your Scripts list.
Start with the default settings
Leave all inputs on their defaults first. This lets you see the “intended” behaviour and the exact properties used for the published backtest (account size, 1% risk, commission, etc.).
Study the wave map
Zoom in and out and look at the three wave degrees:
Blue circles → Primary degree (big picture trend).
Teal (1)…(5) → Intermediate degree (swing structure).
Red i…v → Minor degree (micro waves).
Use this to understand how the engine is interpreting the Elliott structure on your symbol.
Watch for valid setups
Look for the coloured boxes and labels:
Green box + “LONG SETUP” label → potential W4 pullback long in an uptrend.
Red box + “SHORT SETUP” label → potential W4 pullback short in a downtrend.
Only trades in the direction of the EMA trend filter are allowed by the strategy.
Check the Reward:Risk of each idea
For each setup, inspect:
Limit entry price.
ATR-based stop level.
Projected take-profit level.
Make sure the minimum Reward:Risk ratio matches your own rules before you consider trading it.
Backtest and evaluate
Open the Strategy Tester:
Verify you have a decent sample size (ideally 100+ trades).
Check drawdowns, average trade, win-rate and R:R distribution.
Change markets and timeframes to see where the logic behaves best.
Adapt to your own risk profile
If you plan to use it live:
Set Initial Capital to your real account size.
Adjust default_qty_value to a risk level you are comfortable with (often 0.5–2% per trade).
Set commission and slippage to realistic broker values.
Re-run the backtest after every major change.
Use as a framework, not a signal machine
Treat this as a structured Elliott/R:R framework:
Filter signals by higher-timeframe trend, major S/R, volume, or fundamentals.
Optionally hide some wave degrees or ABC labels if you want a cleaner chart.
Combine the system’s structure with your own trade management and discretion.
Best Practices & Limitations
This is an approximate Elliott Wave engine based on fractal pivots. It does not replace a full discretionary Elliott analysis.
All wave counts are algorithmic and can differ from a manual analyst’s interpretation.
Like any backtest, results depend heavily on:
Symbol and timeframe.
Sample size (more trades are better).
Realistic commission/slippage settings.
The 0-slippage default is chosen only to show the “raw logic”. In real markets, slippage can significantly impact performance.
No strategy wins all the time. Losing streaks and drawdowns will still occur even with a strict R:R framework.
Disclaimer
This script is for educational and research purposes only and does not constitute financial advice or a recommendation to buy or sell any security. Past performance, whether real or simulated, is not indicative of future results. Always test on multiple symbols/timeframes, use conservative risk, and consult your financial advisor before trading live capital.

VCAI MACD LiteVCAI MACD Lite is a clean, modern version of the classic MACD oscillator, rebuilt with selectable EMA/SMA types and a 2-tone histogram using VCAI’s visual style.
It keeps the indicator lightweight and easy to read while giving clearer momentum shifts through rising/falling histogram colour changes.
What it does
Calculates MACD using your choice of EMA or SMA
Plots signal line and histogram with 2-tone VCAI colours
Highlights changes in momentum strength as histogram bars rise or fade
Works on any market and timeframe
How to use it
Expanding yellow bars reflect strengthening upside momentum; dim yellow shows fading strength.
Darker and lighter VCAI purple tones show momentum behaviour below zero, helping you see when bearish pressure is increasing or weakening.
Part of the VCAI Lite Series — clean, minimal tools.

Institutional MF-Vol Compression Scanner v4.0 [BIG]═══════════════════════════════════════════════════════════════════════════════
BIG COMPRESSION SCANNER v4.0
═══════════════════════════════════════════════════════════════════════════════
OVERVIEW
The BIG Compression Scanner v4.0 is a proprietary volatility regime detection system designed for systematic Daily options deployment. This framework identifies pre-expansion volatility compression zones through multi-dimensional market structure analysis, combining institutional positioning patterns with hierarchical timeframe confirmation and options market structure to generate high-conviction directional signals for premium strategies.
The methodology synthesizes volatility dynamics, liquidity flow patterns, and cross-timeframe regime alignment into a probabilistic scoring system that isolates asymmetric risk-reward setups characteristic of compression-to-expansion transitions. The framework is calibrated specifically for 30-45 DTE options strategies where timing precision and volatility environment assessment are critical to edge generation.
═══════════════════════════════════════════════════════════════════════════════
CORE METHODOLOGY
═══════════════════════════════════════════════════════════════════════════════
• Proprietary Compression Detection
The system employs a multi-factor compression identification framework that monitors volatility regime transitions across price dispersion metrics and range contraction patterns. Unlike single-indicator squeeze systems, this methodology uses weighted ensemble logic to distinguish true pre-expansion compression from random consolidation noise.
Compression strength is quantified through a proprietary scoring algorithm (0-100%) that evaluates:
- Statistical volatility contraction relative to historical norms
- Price range compression within dynamic envelope systems
- Institutional volume signature analysis during low-volatility periods
- Cross-timeframe compression alignment (Daily/Weekly/Monthly hierarchy)
The framework filters compression events based on minimum strength thresholds and multi-bar confirmation to eliminate premature signals characteristic of retail squeeze indicators.
• Hierarchical Multi-Timeframe Architecture
The indicator integrates a three-tier temporal analysis structure where higher timeframes constrain and validate lower timeframe signals:
Strategic Layer (Monthly) – Establishes macro directional bias and identifies structural market positioning. This layer determines whether intermediate trends align with or counter dominant regime dynamics.
Structural Layer (Weekly) – Provides tactical context through key price levels, momentum assessment, and volatility regime confirmation. Weekly analysis filters signals that would occur in unfavorable proximity to structural inflection zones.
Execution Layer (Daily) – Generates precise entry timing through intraday regime shift detection, momentum confluence analysis, and institutional flow pattern recognition.
Each layer contributes weighted influence to the composite directional probability model, with recalibration logic that adjusts timeframe importance based on current market regime characteristics. The exact weighting algorithm is proprietary and adapts to volatility environment dynamics.
• Options Market Structure Integration
Version 4.0 incorporates options-specific market intelligence not available in standard technical analysis frameworks:
Volatility Environment Assessment – The system continuously monitors implied volatility regime characteristics through proprietary estimation models. These models identify whether current premium levels favor buying or selling strategies, adjusting signal generation accordingly.
Temporal Decay Awareness – Built-in expiration cycle logic ensures signals only trigger when sufficient time value remains for thesis development. The framework approximates days-to-expiration and applies minimum threshold filters to prevent entries in high theta decay regimes.
Greeks-Aware Targeting – Price targets are dynamically calibrated based on volatility expansion expectations and estimated leverage characteristics. Target multipliers adjust to current options market structure rather than using fixed risk-reward ratios.
Premium Environment Classification – Signals are enhanced with real-time assessment of whether current volatility levels favor long premium, short premium, or spread strategies based on historical percentile analysis.
• Probabilistic Directional Scoring System
Rather than binary bullish/bearish classification, the framework generates probability-weighted directional bias through a proprietary multi-factor model. This model synthesizes trend alignment metrics, momentum characteristics, structural positioning, and institutional flow signatures into normalized probability distributions.
The scoring system evaluates dozens of market structure variables across multiple timeframes, applies regime-dependent weighting, and produces directional probabilities that reflect actual edge rather than arbitrary technical indicator thresholds. Signal generation occurs only when directional probability exceeds user-defined conviction thresholds (55-65% depending on sensitivity setting).
This probabilistic approach allows traders to calibrate position sizing and strategy selection (outright vs. spreads) to the strength of directional conviction rather than treating all signals as equal weight.
• Institutional Flow Detection
The framework monitors volume and price interaction patterns characteristic of institutional accumulation or distribution during compression phases. This analysis identifies whether compression zones contain building directional positions (high probability of sustained move post-breakout) versus thin, choppy consolidation (high false breakout risk).
Flow detection employs proprietary algorithms that distinguish genuine institutional activity from retail volume spikes, providing critical context for signal validation.
═══════════════════════════════════════════════════════════════════════════════
SIGNAL ARCHITECTURE
═══════════════════════════════════════════════════════════════════════════════
Call Option Signals trigger when compression strength, directional probability, timeframe alignment, options market structure, and institutional flow patterns simultaneously satisfy proprietary threshold criteria. Signals are filtered against weekly structural levels to avoid low-probability entries near major resistance zones.
Put Option Signals follow equivalent logic with inverse directional parameters, ensuring symmetrical framework application across bull and bear setups.
All signals include:
- Directional conviction probability (percentage)
- Current volatility environment assessment (IV Rank proxy)
- Dynamic price target based on expansion expectations
- Multi-timeframe alignment status
Signal cooldown logic prevents excessive signal generation during extended consolidation periods, maintaining signal quality over quantity.
═══════════════════════════════════════════════════════════════════════════════
VISUAL INTELLIGENCE
═══════════════════════════════════════════════════════════════════════════════
Real-Time Multi-Timeframe Dashboard
The top-right panel provides continuous visibility into:
- Trend alignment across Daily/Weekly/Monthly timeframes
- Current compression status at each temporal layer
- Momentum regime characteristics (RSI values)
- Options environment assessment (IV Rank, optimal strategy)
- Composite signal readiness (compression strength percentage)
This dashboard enables rapid regime assessment without manual multi-timeframe chart analysis.
Chart Integration
Visual overlays include:
- Volatility envelope systems (dynamic bands)
- Weekly structural price levels (pivot, resistance, support)
- Compression zone highlighting (background shading)
- Active squeeze indicators (Daily and Weekly differentiation)
Signal Labels
When setups trigger, comprehensive labels display:
📈 CALL OPTION
Prob: XX%
IV Rank: XX%
Target: $XXX.XX
Labels provide all critical execution information without requiring dashboard consultation.
═══════════════════════════════════════════════════════════════════════════════
KEY CAPABILITIES
═══════════════════════════════════════════════════════════════════════════════
- Proprietary multi-factor compression detection with adaptive thresholds
- Hierarchical multi-timeframe confirmation (Daily/Weekly/Monthly)
- Options-specific filters (IV regime, DTE requirements, Greeks awareness)
- Probabilistic directional scoring (0-100% conviction levels)
- Institutional flow pattern recognition during compression
- Weekly structural level integration with proximity filters
- Dynamic target calibration based on volatility expansion expectations
- Real-time multi-timeframe regime dashboard
- Customizable sensitivity and threshold parameters
- Non-repainting signal architecture (bar close confirmation)
- Comprehensive alert system for proactive monitoring
═══════════════════════════════════════════════════════════════════════════════
APPLICATION GUIDELINES
═══════════════════════════════════════════════════════════════════════════════
1. Timeframe Selection
Apply to Daily (D1) charts only. Framework calibration is timeframe-specific; other intervals produce suboptimal results.
2. Options Mode Activation
Enable Options Trading Mode for premium strategy optimization. This activates IV filtering, DTE thresholds, and Greeks-aware targeting.
3. Strategy Calibration
- Premium Buying: Set IV threshold to 50th percentile, DTE minimum 30+ days, target multiplier 2.5-3.0×
- Premium Selling: Set IV threshold to 70th+ percentile, DTE minimum 20-30 days, target multiplier 1.5-2.0×
4. MTF Dashboard Monitoring
Verify multi-timeframe alignment before execution:
- Ideal setup: Daily + Weekly compression both active
- Confirm trend alignment across timeframes
- Check IV Rank for premium environment assessment
- Wait for "READY" status (green) indicating threshold satisfaction
5. Signal Execution
When labels appear:
- Review directional probability (target >65% for high conviction)
- Assess IV environment (low IV favors buying, high IV favors selling)
- Use price target for strike selection and profit objectives
- Consider 30-45 DTE options for thesis development time
6. Risk Management
- Position size: 2-5% options capital per signal
- Stop loss: Exit if compression breaks opposite direction without follow-through
- Time stop: Reassess if position stagnant after 5-7 days
- Profit taking: Scale out at provided targets or weekly pivot levels
7. Sensitivity Adjustment
- High (55%): More signals, lower conviction, diversified approach
- Medium (60%): Balanced, default setting (2-4 signals/month typical)
- Low (65%): Fewer signals, higher conviction, concentrated positions
═══════════════════════════════════════════════════════════════════════════════
FRAMEWORK LIMITATIONS
═══════════════════════════════════════════════════════════════════════════════
- Optimized exclusively for Daily timeframe analysis
- Compression development requires patience (2-4 weeks typical)
- IV metrics are proprietary proxies, not direct exchange data
- Greeks estimations approximate actual options contract characteristics
- DTE calculations simplified vs. precise monthly expiration dates
- Multi-timeframe filtering reduces but cannot eliminate false breakouts
- Requires liquid options markets (tight spreads, adequate open interest)
- Not designed for earnings-driven volatility events (IV crush risk)
- Framework identifies timing, not specific strike or expiration selection
═══════════════════════════════════════════════════════════════════════════════
TECHNICAL SPECIFICATIONS
═══════════════════════════════════════════════════════════════════════════════
- Pine Script v5 architecture
- Non-repainting signal confirmation (bar close validation)
- Multi-security data integration (Weekly/Monthly via request.security)
- Real-time multi-timeframe analysis dashboard
- 4 alert conditions (Call/Put options, directional generic)
- Fully customizable parameters (compression, scoring, filters, visuals)
- Professional-grade visual hierarchy and information density
═══════════════════════════════════════════════════════════════════════════════
PROFESSIONAL CONTEXT
═══════════════════════════════════════════════════════════════════════════════
This framework is designed for systematic options traders with working knowledge of:
- Volatility regime dynamics and expansion/contraction cycles
- Options Greeks and their impact on P&L across various market conditions
- Implied Volatility Rank interpretation and premium pricing assessment
- Multi-timeframe analysis methodology and trend hierarchy
- Risk-adjusted position sizing and portfolio construction principles
The system identifies when market structure favors options deployment but does not prescribe how to construct positions. Strike selection, expiration choice, spread architecture, and position sizing require independent trader judgment based on account parameters and risk tolerance.
Optimal deployment combines this framework with:
- Options analytics platform (actual IV, Greeks, probability calculations)
- Earnings calendar awareness (pre-earnings IV inflation vs. post-earnings crush)
- Broader market regime context (VIX, correlation, sector rotation)
- Portfolio-level risk management (concentration limits, correlation analysis)
═══════════════════════════════════════════════════════════════════════════════
Proprietary compression-to-expansion framework for systematic Daily options deployment. Methodology incorporates multi-dimensional volatility analysis, hierarchical timeframe confirmation, and options market structure intelligence.

Majors FX-REER/NEER Suite [BIG]═══════════════════════════════════════════════════════════════════════════════
BIG MAJORS FX-REER/NEER SUITE
═══════════════════════════════════════════════════════════════════════════════
OVERVIEW
The BIG Majors FX-REER/NEER Suite is a multi-currency valuation framework designed for institutional FX traders, macro strategists, and systematic currency allocators. This indicator calculates Real Effective Exchange Rates (REER) and Nominal Effective Exchange Rates (NEER) for the seven major currency pairs (G7 FX), integrating macroeconomic fundamentals (CPI inflation differentials) with technical trend analysis to identify structural currency misvaluations and mean-reversion opportunities.
Unlike standard FX indicators that only analyze bilateral price action, this suite constructs trade-weighted basket indices that measure each currency's strength against a portfolio of its major trading partners, adjusted for inflation differentials. This approach mirrors central bank and sovereign wealth fund methodologies for assessing equilibrium exchange rate levels.
The framework combines:
- Fundamental valuation metrics – REER/NEER indices with Z-score normalization
- Technical trend filters – Ichimoku Cloud and Aroon oscillator confluence
- Signal classification system – Long/Short/Watch/Conflict regime identification
- Quantitative confidence scoring – 0-100% signal reliability weighting
═══════════════════════════════════════════════════════════════════════════════
CORE METHODOLOGY
═══════════════════════════════════════════════════════════════════════════════
• NEER Calculation (Nominal Effective Exchange Rate)
The NEER measures a currency's value against a trade-weighted basket of its seven major trading partners, geometrically averaged in log-space to ensure symmetry:
1. All seven G7 FX pairs are normalized to USD-pivot (A/USD format)
2. Each currency's log-normalized rate is compared to the arithmetic mean of the other six
3. Formula: NEER_i = (8/7) × log(CCY_i/USD) - mean(log(CCY_others/USD))
This construction ensures that:
- A rising NEER indicates currency appreciation against the basket
- The methodology is symmetric and avoids base-currency bias
- Changes reflect multilateral competitive dynamics, not just bilateral moves
• REER Calculation (Real Effective Exchange Rate)
The REER adjusts the NEER for inflation differentials using Consumer Price Index (CPI) data:
Formula: REER_i = NEER_i + log(CPI_i) - mean(log(CPI_others))
By incorporating CPI differentials, the REER provides a purchasing-power-parity-adjusted valuation metric that accounts for relative inflation rates. This is the institutional standard for assessing fundamental currency equilibrium levels.
Data Sources :
- FX rates: TradingView composite feed (FX:), OANDA, FXCM, FOREXCOM
- CPI data: ECONOMICS namespace (monthly frequency, official statistical releases)
- Supported currencies: USD, EUR, JPY, GBP, CHF, AUD, CAD, NZD
• Valuation Bias Detection
Each currency pair is classified as overvalued (bias = -1, "Short") or undervalued (bias = +1, "Long") based on two independent criteria:
1. Percentage Band Deviation – Relative Index distance from 100 baseline
• Overvalued: Index > 100 × (1 + deviation%), default +5%
• Undervalued: Index < 100 × (1 - deviation%), default -5%
2. Z-Score Threshold – Statistical extremes in rolling lookback window
• Overvalued: Z-Score > +1.5 (default)
• Undervalued: Z-Score < -1.5 (default)
Either condition triggers a bias classification. This dual-filter approach captures both absolute deviations and relative extremes within recent historical context.
• Trend Confirmation (Ichimoku + Aroon)
To avoid counter-trend entries in strong momentum regimes, the suite integrates two independent trend filters:
Ichimoku Cloud
- Bull: Price > Cloud AND Conversion > Base Line
- Bear: Price < Cloud AND Conversion < Base Line
- Parameters: Conv(9), Base(26), Span B(52), Displacement(26)
Aroon Oscillator
- Bull: Aroon Up > 70 AND Aroon Down < 30
- Bear: Aroon Down > 70 AND Aroon Up < 30
- Default lookback: 25 periods
Trend is confirmed only when both indicators agree (Ichimoku + Aroon ≥ +1 for bull, ≤ -1 for bear).
• Setup Classification Logic
The framework combines Bias (fundamental valuation) with Trend (technical momentum) to generate four distinct setup types:
- Long↗︎ (Setup = 1) – Undervalued + Bullish Trend
Context : Mean reversion opportunity with momentum confirmation. Currency trading at fundamental discount while technical trend supports upside.
- Short↘︎ (Setup = -1) – Overvalued + Bearish Trend
Context : Mean reversion opportunity with momentum confirmation. Currency trading at fundamental premium while technical trend supports downside.
- Watch (Setup = 2) – Valuation bias present, but no clear trend
Context : Fundamental mispricing without directional conviction. Monitor for trend emergence before entering.
- Conflict (Setup = 3) – Bias and trend pointing opposite directions
Context : Overvalued currency in uptrend OR undervalued currency in downtrend. Avoid—either trend continuation or valuation mean reversion, but unclear which dominates.
• Confidence Score (0-100%)
Each setup receives a quantitative confidence weighting based on three factors:
1. Band Distance (40%) – How far the Relative Index deviates from 100 baseline
2. Z-Score Magnitude (40%) – Statistical extremeness within lookback window
3. Trend Confluence (20%) – Agreement between Ichimoku and Aroon signals
Score interpretation:
- 70-100% = High confidence (both valuation and trend extremes aligned)
- 40-69% = Moderate confidence (one factor strong, others weak)
- 0-39% = Low confidence (marginal signals, questionable reliability)
═══════════════════════════════════════════════════════════════════════════════
VISUAL COMPONENTS
═══════════════════════════════════════════════════════════════════════════════
• Dashboard Table (Top-Right)
Displays real-time valuation metrics for all seven major pairs:
Column 1: Pair – Currency pair identifier
Column 2: RelIdx – Relative Index (100 = baseline at first valid bar)
Column 3: Z – Z-Score vs. rolling lookback window
Column 4: Bias – Long/Short/Neutral valuation classification
Column 5: Trend – ↑/↓/– trend direction (Ichimoku + Aroon)
Column 6: Setup – Long↗︎/Short↘︎/Watch/Conflict (color-coded)
Column 7: Conf – Confidence score 0-100% (color-coded)
Column 8: Quelle – REER (inflation-adjusted) or NEER (nominal only)
Color coding :
- Green = Long↗︎ setup
- Red = Short↘︎ setup
- Orange = Watch (no trend)
- Purple = Conflict (bias/trend divergence)
• Optional Chart Plot
Select any of the seven pairs to plot its Relative Index on the chart with:
- Baseline at 100 (horizontal gray line)
- +Band at 100 × (1 + deviation%), dashed red
- -Band at 100 × (1 - deviation%), dashed green
- Aqua line tracking the selected pair's Relative Index evolution
• Signal Labels
When a pair transitions into Long↗︎ or Short↘︎ setup:
- Green label below bar = Long↗︎ entry signal
- Red label above bar = Short↘︎ entry signal
- Positioned using ATR offset for visibility
═══════════════════════════════════════════════════════════════════════════════
KEY FEATURES
═══════════════════════════════════════════════════════════════════════════════
- Institutional valuation methodology – REER/NEER framework used by central banks and sovereign wealth funds
- Macro-fundamental integration – CPI inflation differentials adjust for purchasing power parity
- Multi-timeframe flexibility – Daily (D), Weekly (W), Monthly (M) resolution options
- Seven simultaneous pairs – Monitors all G7 FX majors in single unified dashboard
- No repainting – All signals confirm on bar close
- Automated alerts – TradingView notifications when setups transition (Long/Short triggers)
- Confidence weighting – Quantitative scoring allows position sizing calibration
- Fallback logic – Automatically switches to NEER if CPI data incomplete
═══════════════════════════════════════════════════════════════════════════════
HOW TO USE
═══════════════════════════════════════════════════════════════════════════════
1. Apply to any chart – The indicator pulls multi-security data; chart symbol does not matter (commonly applied to SPY or DXY for reference)
2. Select data feed – Default FX: (TradingView composite) is recommended; alternatives: OANDA, FXCM, FOREXCOM
3. Choose timeframe :
• Daily (D) = Swing trading, medium-term mean reversion (2-8 week horizons)
• Weekly (W) = Position trading, macro regime shifts (1-6 month horizons)
• Monthly (M) = Strategic allocation, long-term equilibrium analysis (6-24 month horizons)
4. Configure parameters :
• Z-Score Lookback : Default 252 (one trading year on Daily); adjust for timeframe (52 for Weekly, 36 for Monthly)
• Deviation Band : Default ±5%; tighten to ±3% for more signals, widen to ±7% for higher conviction
• Z-Threshold : Default ±1.5; increase to ±2.0 for extreme-only signals
5. Monitor dashboard table :
• Focus on pairs showing Long↗︎ or Short↘︎ setups with Conf ≥ 70%
• Watch for Watch setups transitioning to directional signals
• Avoid Conflict setups unless you have strong macro conviction
6. Execute mean-reversion trades :
• Long↗︎ = Buy undervalued currency (e.g., EURUSD Long if EUR undervalued)
• Short↘︎ = Sell overvalued currency (e.g., USDJPY Short if JPY overvalued)
• Target: Mean reversion toward 100 baseline or opposite band
7. Position sizing by confidence :
• High confidence (70-100%) → Standard position size
• Moderate confidence (40-69%) → Reduce size by 50%
• Low confidence (<40%) → Avoid or use minimal pilot size
8. Risk management :
• Stop loss: Place beyond recent swing high/low or 1.5× ATR
• Take profit: Opposite valuation band or 100 baseline
• Time stop: Exit if setup reverses (Long→Neutral→Short or vice versa)
═══════════════════════════════════════════════════════════════════════════════
LIMITATIONS
═══════════════════════════════════════════════════════════════════════════════
- CPI data lag – Consumer Price Index releases are monthly and report with 2-4 week delay. REER calculations may lag real-time inflation dynamics.
- Structural shifts ignored – The baseline (100) is set at first valid bar. Long-term structural appreciation/depreciation (e.g., 20-year USD bull market) is not accounted for. Suitable for cyclical mean reversion, not secular trend analysis.
- Equal-weighting assumption – All seven currencies are equally weighted in basket construction. Actual trade-weighted indices use GDP or trade volume weights, which this framework simplifies.
- No emerging market currencies – Limited to G7 majors (USD, EUR, JPY, GBP, CHF, AUD, CAD, NZD). Does not cover EM FX (e.g., CNY, BRL, MXN).
- Technical filter limitations – Ichimoku and Aroon are lagging indicators. In fast-moving markets (e.g., central bank interventions, geopolitical shocks), trend signals may arrive late.
- Mean reversion assumption – The framework assumes currencies revert to equilibrium. During regime changes (e.g., monetary policy divergence, crisis flows), deviations can persist or expand before eventual reversal.
═══════════════════════════════════════════════════════════════════════════════
TECHNICAL SPECIFICATIONS
═══════════════════════════════════════════════════════════════════════════════
- Pine Script v6
- Non-repainting (signals confirmed on bar close)
- Multi-security data feeds (7 FX pairs + 8 CPI series)
- Automated alert system (transitions to Long↗︎/Short↘︎)
- Real-time dashboard table (8 columns × 8 rows)
- Maximum 500 labels supported (100 per pair direction)
- Fallback logic: NEER used if CPI data unavailable
═══════════════════════════════════════════════════════════════════════════════
NOTES
═══════════════════════════════════════════════════════════════════════════════
This indicator is designed for experienced FX traders, macro strategists, and portfolio managers familiar with:
- Real and nominal effective exchange rate concepts
- Purchasing power parity theory and inflation differentials
- Multi-currency portfolio construction and basket hedging
- Carry trade and convergence strategies
- Central bank policy impacts on FX equilibrium levels
The framework provides objective valuation signals but does not account for:
- Interest rate differentials (carry)
- Capital flow dynamics (risk-on/risk-off)
- Central bank intervention zones
- Geopolitical risk premiums
Always combine REER/NEER valuation analysis with macro event calendars, positioning data (CFTC COT reports), and fundamental policy divergence assessments.
═══════════════════════════════════════════════════════════════════════════════
Developed for institutional FX valuation analysis based on central bank REER/NEER methodologies.

BIG Options Strategy Regime Scanner═══════════════════════════════════════════════════════════════════════════════
BIG OPTIONS STRATEGY REGIME SCANNER
═══════════════════════════════════════════════════════════════════════════════
OVERVIEW
The BIG Options Strategy Regime Scanner is a quantitative regime detection framework designed to identify optimal entry conditions for directional and convexity-based options strategies. This indicator analyzes market structure (trend), volatility environment (VIX), and momentum (RSI) to classify markets into distinct trading regimes and signal appropriate options deployment strategies.
The indicator was developed specifically for systematic options traders who require objective, rule-based regime identification rather than discretionary interpretation. It integrates institutional volatility metrics with technical momentum filters to produce high-probability entry signals for three core strategies: Call Tail Convexity , Put Tail Convexity , and Bull Put Income .
═══════════════════════════════════════════════════════════════════════════════
CORE METHODOLOGY
═══════════════════════════════════════════════════════════════════════════════
• Regime Detection Logic
The indicator operates on a three-factor regime classification system:
1. Trend Filter – Identifies directional bias using SMA 200 as the primary trend delimiter. Position relative to this level determines bull/bear regime classification.
2. Volatility Environment – Uses VIX (CBOE Volatility Index) thresholds to categorize market conditions:
• Low Vol: VIX < 17 (favors premium buying / convexity strategies)
• Mid Vol: VIX 17-22 (transition zone, tactical income strategies)
• High Vol: VIX ≥ 22 (risk-off, defensive positioning)
3. Momentum Confirmation – RSI(14) provides tactical entry timing to avoid premature signals and improve entry quality.
• Strategy Deployment Rules
Call Tail Entry (Bull Convexity)
Triggers when:
- Close > SMA 200 (bull trend confirmed)
- VIX < 17 (low volatility, cheap premium)
- RSI < 45 (tactical pullback for entry)
Context : This regime identifies periods where upside convexity is underpriced. Appropriate for OTM call buying or call spreads designed to capture trend acceleration during low-vol environments.
Put Tail Entry (Bear Convexity)
Triggers when:
- Close < SMA 200 (bear trend confirmed)
- VIX < 17 (low volatility, cheap premium)
- RSI > 65 (tactical bounce for entry)
Context : Signals opportunities to buy downside protection or OTM puts during complacent market conditions. Designed for convexity-seeking traders anticipating volatility expansion in bearish structures.
Bull Put Income
Triggers when:
- Close > SMA 200 (bull trend confirmed)
- VIX 17-20 (mid-range volatility, elevated premium)
- Close > SMA 50 (short-term strength)
Context : Identifies favorable conditions for selling OTM put spreads or cash-secured puts. Targets premium collection in constructive markets with sufficient volatility to generate income but not excessive tail risk.
═══════════════════════════════════════════════════════════════════════════════
VISUAL COMPONENTS
═══════════════════════════════════════════════════════════════════════════════
• Chart Signals
- Purple Triangle (below bar) = Call Tail Entry
- Red Triangle (above bar) = Put Tail Entry
- Green Triangle (below bar) = Bull Put Income
• Background Coloring
Chart background dynamically highlights active signals with semi-transparent overlays:
- Purple = Call Tail active
- Red = Put Tail active
- Green = Bull Put Income active
• Strategy Table
Top-right table displays real-time strategy status:
- Strategy name
- Condition Met (✅/❌)
- Color-coded for quick visual scan
• Moving Averages
- SMA 50 (Orange) – Short-term trend filter
- SMA 200 (Blue) – Primary trend delimiter
═══════════════════════════════════════════════════════════════════════════════
KEY FEATURES
═══════════════════════════════════════════════════════════════════════════════
- Multi-timeframe flexibility – Works on Daily, 4H, 1H timeframes for different deployment horizons
- No repainting – All signals confirm on bar close
- Institutional volatility integration – Uses VIX directly from CBOE data feed
- Clean visual hierarchy – Minimal clutter, maximum signal clarity
- Regime-aware strategy allocation – Matches strategy type to market environment
═══════════════════════════════════════════════════════════════════════════════
HOW TO USE
═══════════════════════════════════════════════════════════════════════════════
1. Apply to target underlying – Works on indices (SPX, NDX, RUT), equity ETFs (SPY, QQQ, IWM), or individual equities with liquid options markets.
2. Monitor regime table – Top-right table shows which strategies are currently valid based on real-time conditions.
3. Execute on signal confirmation – When triangle appears + table shows ✅, deploy corresponding options strategy.
4. Timeframe considerations :
• Daily = Swing options (30-60 DTE typical)
• 4H = Shorter-duration tactical (14-30 DTE)
• 1H = Ultra-short-term (0-7 DTE, requires precision execution)
5. Combine with position sizing rules – This indicator identifies when to deploy strategies, not how much . Use appropriate risk management and position sizing frameworks.
═══════════════════════════════════════════════════════════════════════════════
LIMITATIONS
═══════════════════════════════════════════════════════════════════════════════
- VIX dependency – Signals are calibrated for US equity volatility regimes. May require recalibration for other asset classes.
- No options-specific calculations – This indicator identifies favorable regimes but does not calculate Greeks, IV percentile, or specific strike selection. Traders must perform their own options analysis.
- Trend-following bias – The 200-day SMA filter creates a structural bias toward trend-following systems. May underperform in mean-reverting, range-bound markets.
- Signal frequency – Depending on market conditions, signals may be infrequent. This is by design to maintain signal quality over quantity.
═══════════════════════════════════════════════════════════════════════════════
TECHNICAL SPECIFICATIONS
═══════════════════════════════════════════════════════════════════════════════
- Pine Script v5
- Non-repainting (signals confirmed on close)
- Multi-security data feed (VIX via request.security() )
- Maximum 500 labels supported
- Real-time table updates with color-coded status indicators
═══════════════════════════════════════════════════════════════════════════════
NOTES
═══════════════════════════════════════════════════════════════════════════════
This indicator is designed as a decision-support tool for experienced options traders. It provides objective regime classification and timing signals but does not constitute financial advice or a complete trading system. Always perform independent analysis and risk assessment before deploying options strategies.
Appropriate for traders familiar with:
- Volatility term structure
- Options Greeks and pricing dynamics
- Position construction (spreads, naked positions, hedged structures)
- Capital allocation and risk management
═══════════════════════════════════════════════════════════════════════════════
Developed for systematic options deployment based on quantitative regime detection.

BIG Fibo-X MTF✨ BIG Fibo-X MTF – Multi-Timeframe Fibo/EMA Cross System with RSI & Volume Confirmation
The BIG Fibo-X MTF indicator is a rule-based trend and momentum system that combines Fibo-EMA cross signals, RSI filtering, volume confirmation, multi-timeframe validation and ATR-based risk management. It generates precise long and short entries and automatically plots dynamic stop-loss and take-profit levels on the chart.
---
🔥 Key Features
• 📈 Fibo/EMA Cross Logic
Uses a dual EMA structure to detect trend shifts.
– Long signal: short EMA crosses above long EMA
– Short signal: short EMA crosses below long EMA
Reliable for identifying trend reversals and trend continuation phases.
• 📊 RSI Filtering (Current TF + Higher TF)
Signals must pass RSI conditions on both:
– the current timeframe
– a higher timeframe (MTF confirmation)
This ensures only high-probability momentum zones trigger an entry.
• 📉 Volume Confirmation
Signals require volume exceeding the moving average multiplied by your chosen factor.
This filters out low-activity market phases and increases signal accuracy.
• 📐 ATR-Based Stop-Loss & Take-Profit
The indicator automatically calculates:
– Entry level
– ATR-based dynamic stop-loss
– Take-profit using a customizable risk-reward ratio
Ideal for systematic and automated trading setups.
• ⏰ CEST Session Filter
Signals appear only within the defined trading session.
This is especially useful for DAX, Forex and Futures during European market hours.
• 🔔 Visuals & Alerts
The indicator provides:
– Long/Short labels
– Dynamic ATR SL/TP lines
– RSI with overbought/oversold levels
– Data-window signal output
– Alert conditions for long and short entries
Fully compatible with alert-based automation.
---
🎯 Ideal For
• Scalping
• Intraday trading
• Swing trading
• Breakout strategies
• Trend & momentum systems
• Systematic RR-based setups
---
⭐ Advantages
• Clear rule-based signals
• Multi-timeframe validation
• Volume-enhanced filtering
• Dynamic ATR risk management
• Clean visual structure
• Works for manual trading and automated alerts

ATR Trailing StopShows a trailing stop loss based on ATR (Average True Range).
The user can select ATR period and multiple, to adjust to the volatility of the current chart.
Only for long positions.

Fractal Fade Pro IndicatorA revolutionary contrarian trading indicator that applies chaos theory, fractal mathematics, and market entropy to generate high-probability reverse signals. This indicator fades traditional technical signals, providing BUY signals when conventional indicators say SELL, and SELL signals when they say BUY.
Full Description:
Most traders follow the herd. QFCI does the opposite. It identifies when conventional technical analysis is about to fail by detecting mathematical patterns of exhaustion in market structure.
How It Works (Technical Overview):
The indicator combines three sophisticated mathematical approaches:
Fractal Dimension Analysis: Measures the "roughness" of price movements using fractal mathematics
Market Entropy Calculation: Quantifies the randomness and disorder in price returns using information theory
Phase Space Reconstruction: Analyzes price evolution in multi-dimensional state space from chaos theory
Signal Generation Process:
Step 1: Market Regime Detection
Chaotic Regime: High fractal complexity + rising entropy (avoid trading)
Trending Regime: Low fractal complexity + high phase space distance (fade breakouts)
Mean-Reverting Regime: Very low fractal complexity (fade extremes)
Step 2: Reverse Signal Logic
When traditional indicators would give:
BUY signal (breakout, oversold bounce, volatility spike) → QFCI shows SELL
SELL signal (breakdown, overbought rejection, volatility crash) → QFCI shows BUY
Step 3: Smart Signal Filtering
No consecutive same-direction signals
Adjustable minimum bars between signals
Multiple confirmation layers required
Unique Features:
1. Mathematical Innovation:
Original fractal dimension algorithm (not standard indicators)
Market entropy calculation from information theory
Phase space reconstruction from chaos theory
Multi-regime adaptive logic
2. Trading Psychology Advantage:
Contrarian by design - profits from market overreactions
Fades retail trader mistakes - enters when others are exiting
Reduces overtrading - strict signal frequency controls
3. Clean Visual Interface:
Only BUY/SELL labels - no chart clutter
Clear directional arrows - immediate signal recognition
Built-in alerts - never miss a trade
Recommended Settings:
Default (Balanced Approach):
Fractal Depth: 20
Entropy Period: 200
Min Bars Between Signals: 100
Aggressive Trading:
Fractal Depth: 10-15
Entropy Period: 100-150
Min Bars Between Signals: 50-75
Conservative Trading:
Fractal Depth: 30-40
Entropy Period: 300-400
Min Bars Between Signals: 150-200
Optimal Timeframes:
Primary: Daily, Weekly (best performance)
Secondary: 4-Hour, 12-Hour
Can work on: 1-Hour (with adjusted parameters)
How to Use:
For Beginners:
Apply indicator to chart
Use default settings
Wait for BUY/SELL labels
Enter on next candle open
Use 2:1 risk/reward ratio
Always use stop losses
For Advanced Traders:
Adjust parameters for your trading style
Combine with support/resistance levels
Use volume confirmation
Scale in/out of positions
Track performance by regime
Risk Management Guidelines:
Position Sizing:
Conservative: 1-2% risk per trade
Moderate: 2-3% risk per trade
Aggressive: 3-5% risk per trade (not recommended)
Stop Loss Placement:
BUY signals: Below recent swing low or -2x ATR
SELL signals: Above recent swing high or +2x ATR
Take Profit Targets:
Primary: 2x risk (minimum)
Secondary: Previous support/resistance
Tertiary: Trailing stops after 1.5x risk
IMPORTANT RISK DISCLOSURE
This indicator is for educational and informational purposes only. It is not financial advice. Past performance does not guarantee future results. Trading involves substantial risk of loss and is not suitable for every investor. The risk of loss in trading can be substantial. You should therefore carefully consider whether such trading is suitable for you in light of your financial condition.

Trinity ATR Real Move DetectorTrinity ATR Real Move Detector
This ATR Energy Table indicator is one of the simplest yet most powerful filters you can have on a chart when trading short-dated or 0DTE options or swing trades on any timeframe from 1-minute up to 4-hour. Its entire job is to answer the single most important question in intraday and swing trading: “Does the underlying actually have enough short-term explosive energy right now to make a directional position worth the theta and the spread, or is this just pretty candles that will die in ten minutes?”
Most losing 0DTE and short-dated option trades happen because people buy or sell direction on a “nice-looking” breakout or pullback while the underlying is actually in low-energy grind mode. The premium decays faster than the move develops, and you lose even when you’re “right” on direction. This little table stops that from ever happening again.
Here’s what it does in plain English:
Every bar it measures two things:
- The current ATR on whatever timeframe you are using (1 min, 3 min, 5 min, 10 min, etc.). This tells you how big the average true range of the last 14 bars has been — in other words, how violently the stock or index is actually moving right now.
- The daily ATR (14-period on the daily chart). This is your benchmark for “normal” daily movement over the last two–three weeks.
It then multiplies the daily ATR by a small number (the multiplier you set) and compares the two. If the short-term ATR is bigger than that percentage of the daily ATR, the table turns bright green and says “ENOUGH ENERGY”. If not, it stays red and says “NOT ENOUGH”.
Why this works so well:
- Real explosive moves that carry for 0DTE and 1–3 DTE options almost always show a short-term ATR spike well above the recent daily average. Quiet grind moves never do.
- The comparison is completely adaptive — on a high-vol day the threshold automatically rises, on a low-vol day it automatically drops. You never have to guess if “2 points on SPY is big today”.
- It removes emotion completely. You simply wait for green before you even think about clicking buy or sell on an option.
Key settings and what to do with them:
- Energy Multiplier — this is the only number you ever touch. It is expressed as a decimal (0.15 = 15 % of the daily ATR). Lower = more signals, higher = stricter and higher win rate. The tooltip gives you the exact sweet-spot numbers for every popular timeframe (0.09 for 1-minute scalping, 0.13 for 3-minute, 0.14–0.16 for 5-minute, 0.15–0.19 for 10-minute, etc.). Just pick your timeframe once and type the number — done forever.
- ATR Length — leave it at 14. That’s the standard and works perfectly.
- Table Position — move the table to wherever you want on the chart (top-right, bottom-right, bottom-left, top-left).
- Table Size — make the text Tiny, Small, Normal or Large depending on how much screen space you have.
How this helps you make money and stop losing it:
- On most days you will see red 80–90 % of the time — that’s good! It is forcing you to sit on your hands instead of overtrading low-energy chop that eats premium.
- When it finally flips green you know institutions are actually pushing size right now — follow-through probability jumps from ~40 % to 65–75 % depending on the stock and timeframe.
- You stop buying calls on every green candle and puts on every red candle. You only strike when the market is genuinely “awake”.
- Over a week you take dramatically fewer trades, but your win rate and average winner size go way up — which is exactly how consistent intraday option profits are made.
In short, this tiny table is the closest thing to an “edge on/off switch” that exists for short-dated options. Red = preserve capital and go do something else. Green = pull the trigger with confidence. Use it religiously and you’ll immediately feel the difference in your P&L.

IC Torrente ProTrendIC Torrente ProTrend is an institutional trend engine that combines volume flow, ATR volatility, dynamic trend logic and directional bias using EMA structure. The indicator intelligently detects market phases and aligns entries only when trend, momentum and session volume agree. Unlike conventional moving averages, IC Torrente ProTrend uses dynamic volatility distance and flow confirmation to prevent early invalid trend flips.
This model is optimized for precision execution on Gold (XAUUSD), but also capable across FX majors and indices. Includes integrated Take Profit, Stop Loss and 3-phase exit mapping that visualizes logical institutional exits directly on chart.
