Volume Profile Bar-Magnified Order Blocks [MyTradingCoder]Introducing "Volume Profile Bar-Magnified Order Blocks", an innovative and unique trading indicator designed to provide traders with a comprehensive understanding of market dynamics. This tool takes the concept of identifying order blocks on your chart and elevates it by integrating a detailed volume profile within each order block zone.
Unlike standard order block indicators, Volume Profile Bar-Magnified Order Blocks pulls data from lower timeframe bars and assigns it to various segments of the order block. By providing this volume profile inside the order block, the indicator supplies a deeper, multi-dimensional view of market activity that can enhance your trading decisions.
Crucially, users have the ability to fine-tune the detection of order blocks. This is made possible through a single input setting called "Tuning". This integer value allows you to control the significance and frequency of the order blocks. Higher numbers will produce more significant order blocks, though they will appear less frequently. Lower numbers, on the other hand, will yield less significant order blocks, but they will occur more often. This enables you to adjust the sensitivity of the indicator according to your specific trading strategy and style.
Key Settings:
Number of Segments: Customize the level of detail in your volume profile by selecting the number of segments you want inside each order block.
Tuning: Adjust the sensitivity of order block detection to align with your trading strategy. Higher values produce more significant but less frequent order blocks, while lower values yield less significant but more frequent order blocks.
Color Inputs: Personalize the look of your chart by selecting the colors for various elements of the indicator. This ensures a seamless integration with your current chart aesthetics and improves visual clarity.
Here is a s creenshot that beautifully demonstrates the power of this indicator. You'll see how the price rejects perfectly off the highest volume segment in an order block, showcasing the indicator's potential for pinpointing high-impact price levels.
While Volume Profile Bar-Magnified Order Blocks offers many unique features, it should be used in conjunction with other indicators and forms of analysis for a complete trading strategy. As with all tools, it does not guarantee profitable trades but is intended to give traders more information to base their decisions on. Use it to complement your existing analysis and enhance your understanding of market behavior.
Experience a new level of clarity in your trading with Volume Profile Bar-Magnified Order Blocks - an indicator that goes beyond the surface to help you navigate the markets more effectively.
出来高プロファイル

Volume Support and Resistance*In a cutting system, from the lowest price of the red momentum to the highest price of the green momentum of the range of candles, cuts of different heights are created and the volume of transactions is calculated.
*Volumes in red and green candles each layer are calculated separately.
*The start of the candles can be from a candle other than zero.
*The maximum number of cuts for support or resistance will be separate and user-opinionated. This will help us see the most accurate support or resistance independently and quickly.
*The layer that has (1) the highest volume ratio of green to red, (2) the lowest number of red candles and (3) the highest number of green candles is considered as the best resistance and vice versa as the best support. Therefore, by changing the maximum number of cuts, we should look for the largest ratio of green to red volume for resistance and vice versa for support.
*If the current price is in the range of the momentum candle, the distance of the highest or lowest price of the momentum to hlc3 of the momentum candle will be checked.
*if you get an error message (> 500ms), reduce high_slice or loockback.
*Trading volume is formatted because it varies from very small to very large numbers in different markets and time periods.

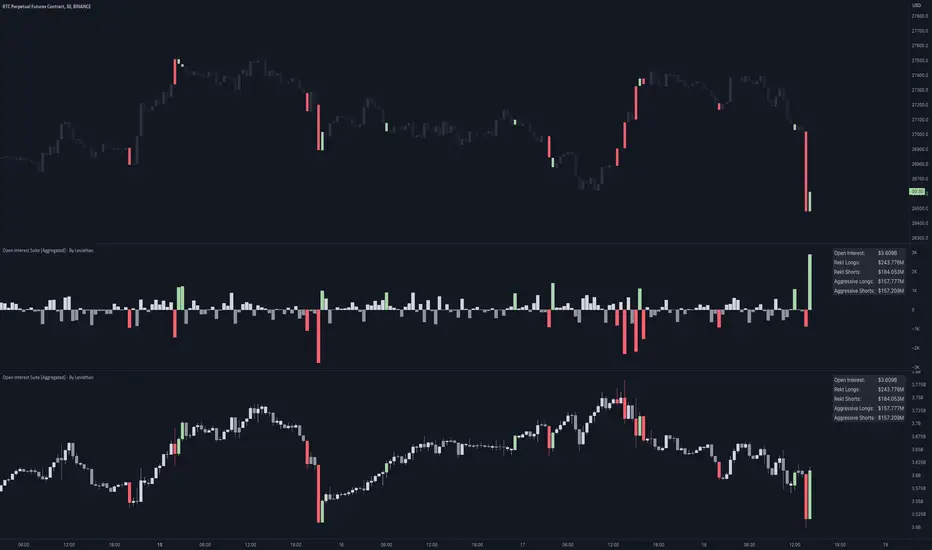
Open Interest Suite [Aggregated] - By LeviathanThis script is an all-in-one indicator that uses aggregated Open Interest data to plot OI candles, Open Interest Delta, OI x rVOL, and OI RSI. It also includes tools such as an OI Distribution profile, large OI increase/decrease coloring, a Stats Screener, and much more.
You can select and have the script plot the following:
- Open Interest in the form of OHLC candles
- Open Interest Delta in the form of a histogram
- Open Interest x Relative Volume in the form of a histogram
- Open Interest RSI in the form of a line
Additional features include:
- OI Distribution Profile (It shows the distribution of open interest in the visible range on y axis. This makes it easier to identify when Open Interest is relatively high or low and at which values most of the action took place)
- Stats screener (The screener includes the real-time net Open Interest value, Rekt Longs/Rekt Shorts based on large OI decreases and Aggressive Longs/Shorts based on large OI increases)
- Coloring (You can color OI Delta nodes, background and chart candles based on large OI increases/decreases)
- more
Instructions for the settings will be provided in the tooltips shortly.
Full credit goes to @KioseffTrading for the profile generation code.
Open Interest Profile [Fixed Range] - By LeviathanThis script generates an aggregated Open Interest profile for any user-selected range and provides several other features and tools, such as OI Delta Profile, Positive Delta Levels, OI Heatmap, Range Levels, OIWAP, POC and much more.
The indicator will help you find levels of interest based on where other market participants are opening and closing their positions. This provides a deeper insight into market activity and serves as a foundation for various different trading strategies (trapped traders, supply and demand, support and resistance, liquidity gaps, imbalances,liquidation levels, etc). Additionally, this indicator can be used in conjunction with other tools such as Volume Profile.
Open Interest (OI) is a key metric in derivatives markets that refers to the total number of unsettled or open contracts. A contract is a mutual agreement between two parties to buy or sell an underlying asset at a predetermined price. Each contract consists of a long side and a short side, with one party consenting to buy (long) and the other agreeing to sell (short). The party holding the long position will profit from an increase in the asset's price, while the one holding the short position will profit from the price decline. Every long position opened requires a corresponding short position by another market participant, and vice versa. Although there might be an imbalance in the number of accounts or traders holding long and short contracts, the net value of positions held on each side remains balanced at a 1:1 ratio. For instance, an Open Interest of 100 BTC implies that there are currently 100 BTC worth of longs and 100 BTC worth of shorts open in the market. There might be more traders on one side holding smaller positions, and fewer on the other side with larger positions, but the net value of positions on both sides is equivalent - 100 BTC in longs and 100 BTC in shorts (1:1). Consider a scenario where a trader decides to open a long position for 1 BTC at a price of $30k. For this long order to be executed, a counterparty must take the opposite side of the contract by placing a short order for 1 BTC at the same price of $30k. When both long and short orders are matched and executed, the Open Interest increases by 1 BTC, indicating the introduction of this new contract to the market.
The meaning of fluctuations in Open Interest:
- OI Increase - signifies new positions entering the market (both longs and shorts).
- OI Decrease - indicates positions exiting the market (both longs and shorts).
- OI Flat - represents no change in open positions due to low activity or a large number of contract transfers (contracts changing hands instead of being closed).
Typically, we monitor Open Interest in the form of its running value, either on a chart or through OI Delta histograms that depict the net change in OI for each price bar. This indicator enhances Open Interest analysis by illustrating the distribution of changes in OI on the price axis rather than the time axis (akin to Volume Profiles). While Volume Profile displays the volume that occurred at a given price level, the Open Interest Profile offers insight into where traders were opening and closing their positions.
How to use the indicator?
1. Add the script to your chart
2. A prompt will appear, asking you to select the “Start Time” (start of the range) and the “End Time” (end of the range) by clicking anywhere on your chart.
3. Within a few seconds, a profile will be generated. If you wish to alter the selected range, you can drag the "Start Time" and "End Time" markers accordingly.
4. Enjoy the script and feel free to explore all the settings.
To learn more about each input in indicator settings, please read the provided tooltips. These can be accessed by hovering over or clicking on the ( i ) symbol next to the input.

Volume Profile Matrix [LuxAlgo]The Volume Profile Matrix indicator extends from regular volume profiles by also considering calculation intervals within the calculation window rather than only dividing the calculation window in rows.
Note that this indicator is subject to repainting & back-painting, however, treating the indicator as a tool for identifying frequent points of interest can still be very useful.
🔶 SETTINGS
Lookback: Number of most recent bars used to calculate the indicator.
Columns: Number of columns (intervals) used to calculate the volume profile matrix.
Rows: Number of rows (intervals) used to calculate the volume profile matrix.
🔶 USAGE
The Volume Profile Matrix indicator can be used to obtain more information regarding liquidity on specific time intervals. Instead of simply dividing the calculation window into equidistant rows, the calculation is done through a grid.
Grid cells with trading activity occurring inside them are colored. More activity is highlighted through a gradient and by default, cells with a color that are closer to red indicate that more trading activity took place within that cell. The cell with the highest amount of trading activity is always highlighted in yellow.
Each interval (column) includes a point of control which highlights an estimate of the price level with the highest traded volume on that interval. The level with the highest traded volume of the overall grid is extended to the most recent bar.

Range Sentiment Profile [LuxAlgo]The Range Sentiment Profile indicator is inspired from the volume profile and aims to indicate the degree of bullish/bearish variations within equidistant price areas inside the most recent price range.
The most bullish/bearish price areas are highlighted through lines extending over the entire range.
🔶 SETTINGS
Length: Most recent bars used for the calculation of the indicator.
Rows: Number of price areas the price range is divided into.
Use Intrabar: Use intrabar data to compute the range sentiment profile.
Timeframe: Intrabar data timeframe.
🔶 USAGE
This tool can be used to easily determine if a certain price area contain more significant bullish or bearish price variations. This is done by obtaining an estimate of the accumulation of all the close to open variations occurring within a specific profile area.
A blue range background indicates a majority of bullish variations within each area while an orange background indicates a majority of bearish variations within each area.
Users can easily identify the areas with the most bullish/bearish price variations by looking at the bullish/bearish maximums.
It can be of interest to see where profile bins might have no length, these can indicate price areas with price variations with alternating signs (bullish variations are followed by a bearish sign) and similar body. They can also indicate a majority of either bullish or bearish variations alongside a minority of more significant opposite variations.
These areas can also provide support/resistance, as such price entering these areas could reverse.
Users can obtain more precise results by allowing the profile to use intrabar data. This will change the calculation of the profile, see the details section for more information.
🔶 DETAILS
The Range Sentiment Profile's design is similar to the way a volume profile is constructed.
First the maximum/minimum values over the most recent Length bars are obtained, these define the calculation range of the profile.
The range is divided into Rows equidistant areas. We then see if price lied within a specific area, if it's the case we accumulate the difference between the closing and opening price for that specific area.
Let d = close - open . The length of the bin associated to a specific area is determined as follows:
length = Width / 100 * Area / Max
Where Area is the accumulated d within the area, and Max the maximum value between the absolute value of each accumulated d of all areas.
The percentage visible on each bin is determined as 100 multiplied by the accumulated d within the area divided by the total absolute value of d over the entire range.
🔹 Intrabar Calculation
When using intrabar data the range sentiment profile is calculated differently.
For a specific area and candle within the interval, the accumulated close to open difference is accumulated only if the intrabar candle of the user selected timeframe lies within the area.
This can return more precise results compared to the standard method, at the cost of a higher computation time.

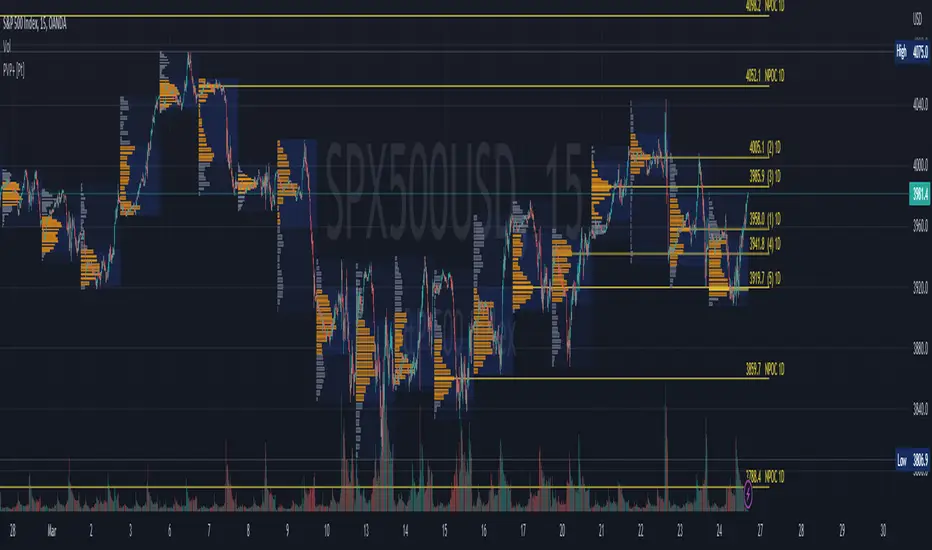
Volume Profile Fixed Range Support and Resistance LevelsThis script is based on the excellent Volume Profile / Fixed Range indicator by @LonesomeTheBlue, so all credit for the foundations of this indicator goes to @LonesomeTheBlue
I basically made 5 instances of the original script and added horizontal lines at the beginning and end of the each Value Area. To use the script as a support and resistance tool without the Value Areas and Point of Control (POC) labels you just need to untick "Boxes" and "Labels" in the "Style" section of the “Settings”.
The default look-back periods (in bars) are 7, 30, 60, 180 and 365, but you can change this or the colour of the lines easily in the “Settings”.
The dashed lines are the respective POC.
I find this tool to be very useful for quickly identifying interest levels on any chart while also ensuring a certain amount of objectivity in your TA.
Hope you find it useful and thanks again to @LonesomeTheBlue for going through the trouble of coding this and being so generous to share it with the rest of us!
Good luck out there!

Periodic Volume Profile+ [Pt]This is a + version of my original Periodic Volume Profile indicator
This script includes the following extra unique features.
Show last X number of POC levels
- automatically draws these POC lines
- labels are shown as
- Naked POCs are labelled as NPOC
- label position and text size can be adjusted
Profile Range and Value Area background colors
- Option to color background based on periodic open/close price
Option to show Value Area High (VAH) and Value Area Low (VAL) Prices
What is Volume Profile?
Volume profile is a technical analysis tool that shows the volume of trades at different prices for a given security or market over a specific period of time.
How to effectively use it?
Identify key levels of support and resistance: The Periodic Volume Profile indicator can be used to identify key levels of support and resistance based on the volume of trades at different price levels. High volume areas can indicate strong support or resistance levels, while low volume areas can indicate areas of weakness or potential breakouts.
Assess overall supply and demand: The Periodic Volume Profile indicator can help traders assess overall supply and demand for a security. If there is high volume at a particular price level, this can indicate a high level of demand, while low volume can indicate low demand.
Use it in conjunction with other indicators: The Periodic Volume Profile indicator is best used in conjunction with other technical analysis tools. For example, you can use it with moving averages, trend lines, or other indicators to confirm signals or identify potential entry and exit points.
Consider the overall market context: It's important to consider the overall market context when interpreting volume profile data. For example, a high volume area may not necessarily indicate a strong level of support or resistance if the overall market is in a downtrend.
Monitor changes over time: Keep an eye on how the volume profile changes over time. If there are significant changes in the volume of trades at certain price levels, this could indicate a shift in market sentiment or a change in the underlying fundamentals of the security.
Angled Volume Profile [Trendoscope]Volume profile is useful tool to understand the demand and supply zones on horizontal level. But, what if you want to measure the volume levels over trend line? In trending markets, the feature to measure volume over angled levels can be very useful for traders who use these measures. Here is an attempt to provide such tool.
🎲 How to use
🎯 Interactive input for selecting starting point and angle.
Upon loading the script, you will be prompted to select
Start time and price - this is a point which you can select by moving the maroon highlighted label.
End price - though this is shown as maroon bullet, this is price only input. Hence, when you click on the bullet, a horizontal line will appear. Users can move the line to use different End price.
Start and End price are used for identifying the angle at which volume profile need to be calculated. Whereas start time is used as starting time of the volume profile. Last bar of the chart is considered as ending bar.
🎯 Other settings.
From settings, users can select the colour of volume profile and style. Step multiplier defines the distance at which the profile lines needs to be drawn. Higher multiplier leads to less dense profile lines whereas lower multiplier leads to higher density of profile lines.
🎲 Limitations
🎯 Max 500 lines
Pinescript only allows max 500 lines on an indicator. Due to this, if we set very low multiplier - this can lead to more than 500 profile lines. Due to this some lines can get removed.
On the contrary, if multiplier is too high, then you will see very few lines which may not be meaningful.
Hence, it is important to select optimal multiplier based on your timeframe
🎯 No updates on new bar
Since the profile can spawn many bars, it is not possible to recalculate the whole volume profile when price creates new bars. Hence, there will not be visual update when new bars are created. But, to update the chart, users only need to make another movement of Start or ending point on interactive input.

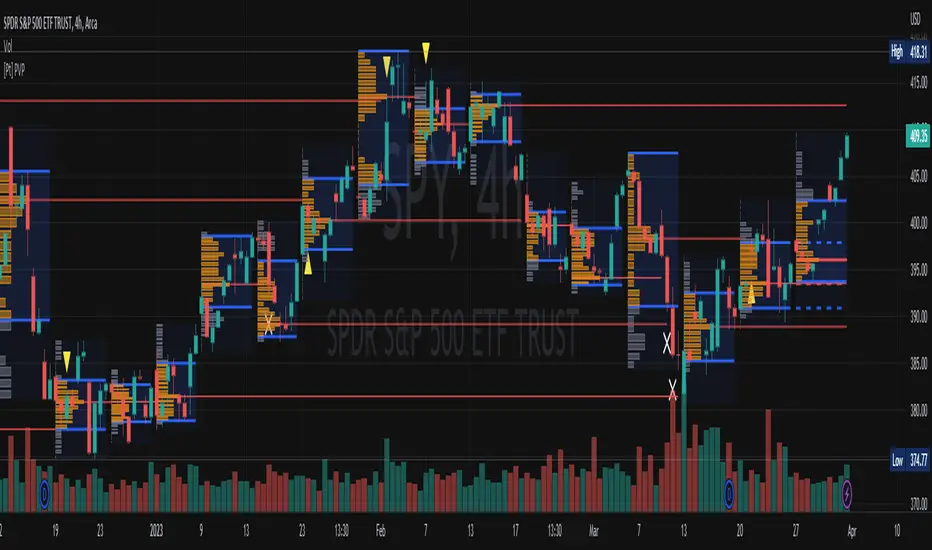
Bar Magnified Volume Profile/Fixed Range [ChartPrime]This indicator draws a volume profile by utilizing data from the lower timeframe to get a more accurate representation of where volume occurred on a bar to bar basis. The indicator creates a price range, and then splits that price range into 100 grids by default. The indicator then drops down to the lower timeframe, approximately 16 times lower than the current timeframe being viewed on the chart, and then parses through all of the lower timeframe bars, and attributes the lower timeframe bar volume to all grids that it is touching. The volume is dispersed proportionally to the grids which it is touching by whatever percent of the candle is inside each grid. For example, if one of the lower timeframe bars is interacting with "2" of the grids in the profile, and 60% of the candle is inside of the top grid, 60% of the volume from said candle will be attributed to the grid.
To make all of this magic happen, this script utilizes a quadratic time complexity algorithm while parsing and attributing the volume to all of the grids. Due to this type of algorithm being used in the script, many of the user inputs have been limited to allow for simplicity, but also to prevent possible errors when executing loops. For the most part, all of the settings have been thoroughly tested and configured with the right amount of limitations to prevent these errors, but also still give the user a broad range of flexibility to adjust the script to their liking.
📗 SETTINGS
Lookback Period: The lookback period determines how many bars back the script will search for the "highest high" and the "lowest low" which will then be used to generate the grids in-between
Number Of Levels: This setting determines how many grids there will be within the volume profile/fixed range. This is personal preference, however it is capped at 100 to prevent time complexity issues
Profile Length: This setting allows you to stretch or thin the volume profile. A higher number will stretch it more, vise versa a smaller number will thin it further. This does not change the volume profiles results or values, only its visual appearance.
Profile Offset: This setting allows you to offset the profile to the left or right, in the event the user does not appreciate the positioning of the default location of the profile. A higher number will shift it to the right, vise versa a lower number will shift it to the left. This is personal preference and does not affect the results or values of the profile.
🧰 UTILITY
The volume profile/fixed range can be used in many ways. One of the most popular methods is to identify high volume areas on the chart to be used as trade entries or exits in the event of the price revisiting the high volume areas. Take this picture as an example. The image clearly demonstrates how the 2 highest areas of volume within this magnified volume profile also line up to great areas of support and resistance in the market.
Here are some other useful methods of using the volume profile/fixed range
Identify Key Support and Resistance Levels for Setups
Determine Logical Take Profits and Stop Losses
Calculate Initial R Multiplier
Identify Balanced vs Imbalanced Markets
Determine Strength of Trends

Open Interest with Heikin Ashi candlesA simple modification of the Tradingview free script of futures Open Interest to Heikin Ashi candles. It displays the volume of the Open Interest futures contracts by applying the HA formula.
I use it to clear out the "noise" of up's and down's especially in intraday small time frames when I am scalping in crypto.
Background color can be turned on/off.
Just to give back a little something to a community that gave me A LOT!
Let me know what you think and if you need anything to add.
Have fun :)
P.S. The way I use it is to try to find traps in the market and take (fast) advantage of them. When the OI are going up really fast in small time frames (which means either longs or shorts are going up) this creates a good opportunity for a squeeze (the trap).
Of course I use other indicators/oscillators to determine that but it gets me on my toes to look for... something ;)

Volume and vPOC InsightsThe vPOC or volume point of control shows where most of the volume was traded. This is important because this is where the institutions and market makers have opened their positions, and these are the ones that move the markets!
This indicator is designed to cut through the volume noise, and enable the hiding of lower volume data.
The main setting allows you to define a lookback, and obscure the candles whose volume is less than x % of the highest volume in this lookback.
Of the remaining candles, their vPOC will be displayed. There are extra settings to extend naked vPOCs, as well as the highs and lows of these high volume candles, plus an EMA based on the vPOC price levels.
I must credit quantifytools @quantifytools who allowed me to utilize his code, for finding vPOCs using lower timeframe candles - there are comments in the code also. It works perfectly so why reinvent the wheel?

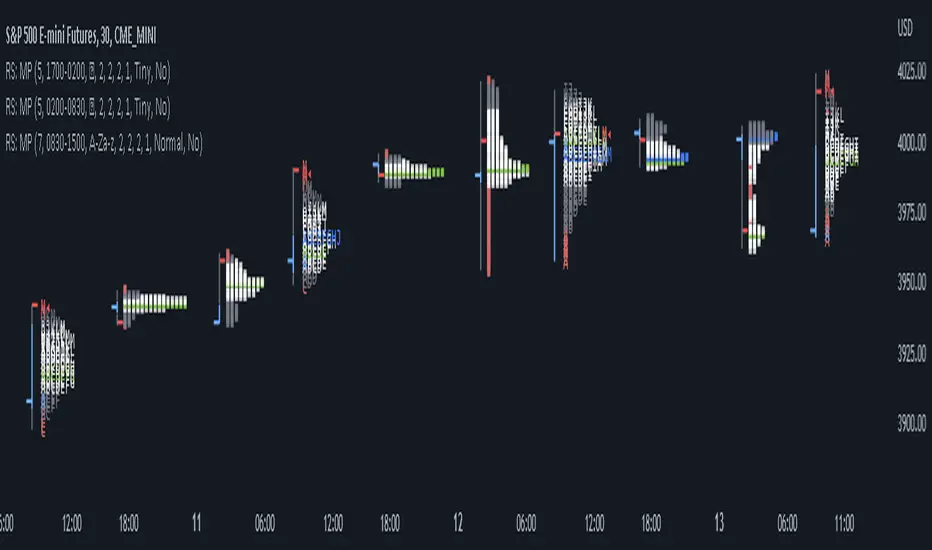
RS: Market ProfileA Market Profile (time price opportunity) implementation with an option to mark a point of control (POC) based on volume.
Config: Hide default candles. Select a session time using exchange timezone. Experiment with tick multiplier value to achieve desired level of detail. Choose the symbols of your choice, e.g. squares or A-Z chars. For multiple sessions you will have to add additional instances of this script with a different time configuration.
Limitations: TradingView has a hard limit for the number of characters (500), if it's reached, label rendering stops. Try increasing tick multiplier value to reduce the number of labels rendered or reduce the window size.
Features:
Use symbols or A-Z chars for TPOs
Mark POC
Calculate Value Area (volume or time based)
Highlight single prints (SP)
Highlight VWAP
Show daily bar
Highlight Open and Close
Highlight current price row (during live market)
Highlight initial balance (IB)
[potatoshop] Volume Profile lower timeframeThis script is a volume profile that displays the volume of transactions in price blocks over a recent period of time.
For a more detailed representation, OHCLV values on the time frame lower than the time zone on the chart were called and expressed.
Low time frames are adjustable.
You can adjust the number of blocks and the most recent time period that you want to view.
Although it cannot be compared to the volume indicators provided for paid users of Trading-View, it has functioned by displaying transactions that are difficult to find on open source.
Displays the amount traded in each block and the percentage of the total over a given period.
POC represents the middle value of the block with the highest transaction volume as a line.
TPOC represents the block that stayed the longest regardless of the volume of transaction.
The reversal line appears when you determine the trading advantage of the rising and falling closing on a block basis and then have a different value from the neighboring blocks.
(I didn't mean it much, but I just put it in for fun.)
It represents the total volume of transactions traded in each block, and there are also check boxes in the settings window that represent the volume of transactions that closed higher and closed lower.
You can specify the color of each block.
The highest and lowest values for the set period and the total sum of each block are displayed at the bottom of the box.
Because it was made using a lot of arrays, the total transaction volume was marked separately to check the value.
When expressing the price block according to the trading volume percentage, it was a pity that the minimum pixel was 1 bar, so it could not be expressed delicately.
Although set to bar_time in Box properties xloc, 1 bar was actually the minimum unit of the X-axis value.
The logic used to place the transaction volume for each block is as follows.
1. Divide the difference between the high and low values of 1 LTF bar by the transaction volume .
2. Find the percentage of this LTF bar within each block.
3. Multiply the ratio by the transaction volume again.
4. Store the value in each block cell.
Below are the codes of the people I referred to this time.
1. ‘Time & volume point of control (TPOC & VPOC)’ by quantifytools
2. ‘Volume Profile ’ by LuxAlgo
3. ‘Volume Profile and Volume Indicator by DGT’ by dgtrd
The script is for informational and educational purposes only.
이 스크립트는 최근 일정 기간동안의 거래량을 가격 블록단위로 표시해 주는 볼륨 프로화일입니다.
좀 더 자세한 표현을 위해 차트상의 시간대보다 낮은 시간 프레임상의 OHCLV 값들을 호출하여 표현하였습니다.
낮은 시간 프레임은 조절 가능합니다..
보고 싶은 최근 일정 기간과 블럭 갯수를 조절할 수 있습니다.
트뷰 유료 사용자들을 위해 제공하는 지표와는 비교할 수는 없지만, 오픈 소스상에서는 찾기 힘든 거래량을 표시해 기능을 넣었습니다.
각 블럭에서 거래되었던 양 과 주어진 기간 동안의 총량 대비 퍼센트를 표시해 줍니다.
POC는 거래량이 가장 많았던 블럭의 중간값을 라인으로 표현해 줍니다.
TPOC는 거래량에 상관없이 가장 오랜 시간 머물렸던 블럭을 표현해 줍니다.
반전선은 블럭 단위로 상승 마감과 하락 마감의 거래량 우세를 결정한 뒤, 이웃 블럭들하고 다른 값을 가질 때 나타납니다.
(어떤 뜻을 갖고 만든 건 아니고 그냥 재미로 넣어 보았습니다.)
각 블럭에서 거래되었던 총거래량을 표현해 주며, 또한 설정창에서 상승 마감한 거래량과 하락 마감한 거래량을 표현하는 체크 박스가 있습니다.
각 블럭의 색깔을 지정하실 수 있습니다.
설정된 기간 동안의 최고값과 최저값, 각 블럭을 합친 총량을 박스 하단에 표시해 두었습니다.
어레이를 많이 사용하여 만들었기 때문에 값의 확인을 위해 전체 거래량을 따로 표시하였습니다.
가격 블럭을 거래량 퍼센트에 따라 표현할 때, 최소 픽셀이 1bar 이어서 섬세하게 표현 할 수 없어 안타까웠습니다.
박스 속성을 xloc.bar_time 로 설정하였지만 실제로는 1 bar가 X축 값의 최소 단위였습니다.
각 블록 별로 거래량을 배치 할 때 쓰인 로직은 다음과 같습니다.
1. 1 LTF bar의 하이 와 로우 값의 차이를 거래량으로 나누어 줍니다.
2. 각 블록 안에서 이 LTF bar가 차지 하는 비율을 구합니다.
3. 그 비율에 다시 거래량을 곱해 줍니다.
4. 그 값을 각 블록 셀에 저장해 줍니다.
밑에 제가 이번에 참고한 분들의 코드들입니다.
1. ‘Time & volume point of control (TPOC & VPOC)’ by quantifytools
2. ‘Volume Profile ’ by LuxAlgo
3. ‘Volume Profile and Volume Indicator by DGT’ by dgtrd

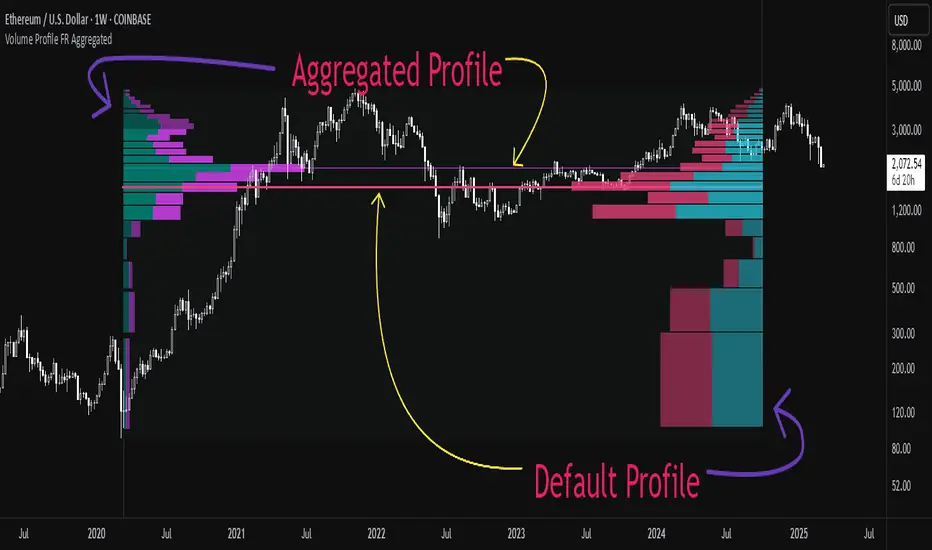
Aggregated Volume Profile Spot & Futures ⚉ OVERVIEW ⚉
Aggregate Volume Profile - Shows the Volume Profile from 9 exchanges. Works on almost all CRYPTO Tickers!
You can enter your own desired exchanges, on/off any others, as well as select the sources of SPOT, FUTURES and others.
The script also includes several input parameters that allow the user to control which exchanges and currencies are included in the aggregated data.
The user can also choose how volume is displayed (in assets, U.S. dollars or euros) and how it is calculated (sum, average, median, or dispersion).
WARNING Indicator is for CRYPTO ONLY.
______________________
⚉ SETTINGS ⚉
‾‾‾‾‾‾‾‾‾‾‾‾‾‾‾‾‾‾‾‾‾‾
Data Type — Choose Single or Aggregated data.
• Single — Show only current Volume.
• Aggregated — Show Aggregated Volume.
Volume By — You can also select how the volume is displayed.
• COIN — Volume in Actives.
• USD — Volume in United Stated Dollar.
• EUR — Volume in European Union.
• RUB — Volume in Russian Ruble.
Calculate By — Choose how Aggregated Volume it is calculated.
• SUM — This displays the total volume from all sources.
• AVG — This displays the average price of the volume from all sources.
• MEDIAN — This displays the median volume from all sources.
• VARIANCE — This displays the variance of the volume from all sources.
• Delta Type — Select the Volume Profile type.
• Bullish — Shows the volume of buyers.
• Bearish — Shows the volume of sellers.
• Both — Shows the total volume of buyers and sellers.
Additional features
The remaining functions are responsible for the visual part of the Volume Profile and are intuitive and I recommend that you familiarize yourself with them simply by using them.
________________
⚉ NOTES ⚉
‾‾‾‾‾‾‾‾‾‾‾‾‾‾‾‾
If you have any ideas what to add to my work to add more sources or make calculations cooler, suggest in DM .
Also I recommend exploring and trying out my similar work.
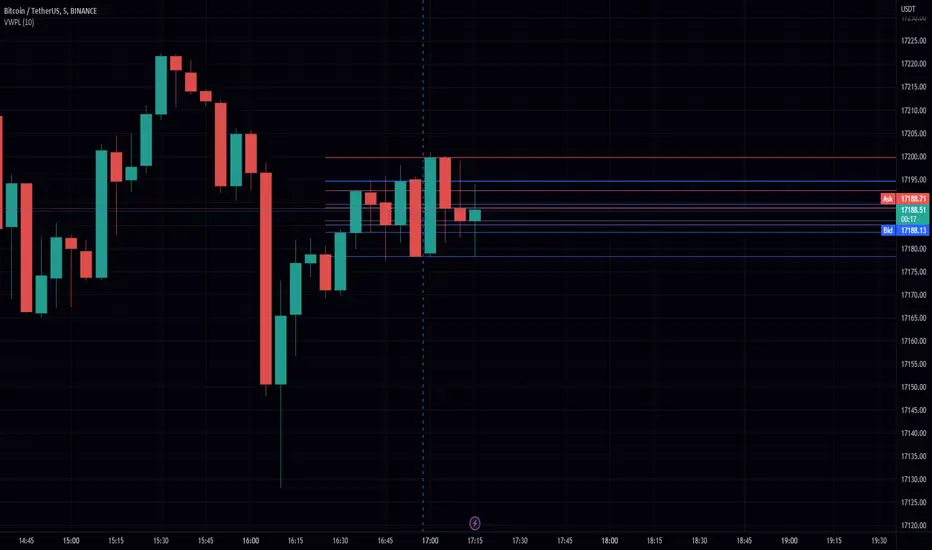
Volume-Weighted Price Levels (VWPL)Introduction:
In this script, we will be creating an indicator that plots horizontal lines on the chart for each unique price in a given range, and colors them based on the volume of that price.
Explanation:
First, we define the input "Length" as an integer. This will determine the number of bars back from the current bar to include in the range.
We then create two arrays: "price" and "vol." The "price" array will store all the unique prices in the given range, and the "vol" array will store the corresponding volumes for those prices.
Using a for loop, we iterate through the range of bars and check if the current close price is already included in the "price" array. If it is not, we add it to the array and also add the corresponding volume to the "vol" array. If it is already included, we find the index of that price in the "price" array and add the current volume to the volume stored at that index in the "vol" array.
After the for loop, we find the maximum volume in the "vol" array and use that to find the corresponding price in the "price" array. This will be the price at which we draw the horizontal line.
We then create an array of lines called "lines" and, using another for loop, we iterate through the "price" array and add a line to the "lines" array for each price. The color of each line is determined by the volume of that price, using a color gradient from blue (lowest volume) to red (highest volume).
Finally, we use an if statement to check if the current bar is the last bar in the chart, and if it is, we use another for loop to iterate through the "lines" array and delete all the lines. This is to prevent the lines from being carried over to the next bar and potentially being plotted multiple times.
Conclusion:
This script can be useful for visualizing the price levels with the highest volume in a given range, as well as seeing how volume is distributed among different price levels. It can be helpful for identifying areas of significant buying or selling pressure.
Volume profile zonesHi all!
This script calculates and shows the volume profile for the range of a higher timeframe candle. It then shows support or resistance (/supply or demand) zones based on the volume profiles with the most volume. The defaults are just my preferred settings so feel free to play with them! Also feel free to let me know about bugs and features. I already have a list of features to make, e.g.:
base on pivots
more info zone calculations, e.g. breaks and retests, virgin point of control etc.
add alerts
get rid of getPriceLevels()
get rid of _barVolumeProfile prefix
handle realtime
...
Best of trading luck!

[Pt] Periodic Volume ProfileThis script is an attempt to recreate the Periodic Volume Profile that is built-in by TradingView, with slightly different features. Related blog: www.tradingview.com
This script is based on another script "Volume Profile, Pivot Anchored" by @dgtrd
*Note that only limited number Volume Profile can be displayed on the chart due to limitations on displaying boxes and lines.
Description
This Periodic Volume Profile (PVP) indicator allows trades to view volume profiles for periods longer than the current timeframe. The indicator builds one general volume profile for each new period, set by the user through the “Periodic Timeframe” input parameter.
This script also has the option to extend Point of Control (POC) lines with optional end conditions: Until Bar Touch, Until Last Bar, Until Bar Cross, or None, which extends to the right.
Signals are generated for Naked POC touches and crosses by a triangle symbol and a cross symbol, by default.
Alerts are available for POC touches and crosses.
What is Volume Profile?
Volume profile is a technical analysis tool that shows the volume of trades at different prices for a given security or market over a specific period of time.
Volume profile can be used to identify key levels of support and resistance, as well as to assess the overall supply and demand for a security. For example, if there is a high volume of trades at a particular price level, this may indicate that there is a significant level of support or resistance at that price. On the other hand, if there is relatively low volume at a particular price, this may indicate that there is not much interest in trading at that level.
Traders can use volume profile to identify trends, make trading decisions, and set stop-loss and take-profit orders. It can also be useful for identifying patterns such as "pockets of liquidity," which are areas where there is a high volume of trades but relatively little price movement.
It is important to note that volume profile should be used in conjunction with other technical analysis tools and should not be relied upon in isolation. It is also important to consider the overall context and market conditions when interpreting volume profile data.
Key Difference with TradingView's PVP indicator - TradingView's PVP intraday period does not align with standard intraday timeframes as it is determined by # of bars. This script provides volume profiles that aligns with higher timeframe periods.
Enjoy~!
Open Interest Profile (OI)- By LeviathanThis script implements the concept of Open Interest Profile, which can help you analyze the activity of traders and identify the price levels where they are opening/closing their positions. This data can serve as a confluence for finding the areas of support and resistance , targets and placing stop losses. OI profiles can be viewed in the ranges of days, weeks, months, Tokyo sessions, London sessions and New York sessions.
A short introduction to Open Interest
Open Interest is a metric that measures the total amount of open derivatives contracts in a specific market at a given time. A valid contract is formed by both a buyer who opens a long position and a seller who opens a short position. This means that OI represents the total value of all open longs and all open shorts, divided by two. For example, if Open Interest is showing a value of $1B, it means that there is $1B worth of long and $1B worth of short contracts currently open/unsettled in a given market.
OI increasing = new long and short contracts are entering the market
OI decreasing = long and short contracts are exiting the market
OI unchanged = the net amount of positions remains the same (no new entries/exits or just a transfer of contracts occurring)
About this indicator
*This script is basically a modified version of my previous "Market Sessions and Volume Profile by @LeviathanCapital" indicator but this time, profiles are generated from Tradingview Open Interest data instead of volume (+ some other changes).
The usual representation of OI shows Open Interest value and its change based on time (for a particular day, time frame or each given candle). This indicator takes the data and plots it in a way where you can see the OI activity (change in OI) based on price levels. To put it simply, instead of observing WHEN (time) positions are entering/exiting the market, you can now see WHERE (price) positions are entering/exiting the market. This is the same concept as when it comes to Volume and Volume profile and therefore, similar strategies and ways of understanding the given data can be applied here. You can even combine the two to gain an edge (eg. high OI increase + Volume Profile showing dominant market selling = possible aggressive shorts taking place)
Green nodes = OI increase
Red nodes = OI decrease
A cluster of large green nodes can be used for support and resistance levels (*trapped traders theory) or targets (lots of liquidations and stop losses above/below), OI Profile gaps can present an objective for the price to fill them (liquidity gaps, imbalances, inefficiencies, etc), and more.
Indicator settings
1. Session/Lookback - Choose the range from where the OI Profile will be generated
2. OI Profile Mode - Mode 1 (shows only OI increase), Mode 2 (shows both OI increase and decrease), Mode 3 (shows OI decrease on left side and OI increase on the right side).
3. Show OI Value Area - Shows the area where most OI activity took place (useful as a range or S/R level )
4. Show Session Box - Shows the box around chosen sessions/lookback
5. Show Profile - Show/hide OI Profile
6. Show Current Session - Show/hide the ongoing session
7. Show Session Labels - Show/hide the text labels for each session
8. Resolution - The higher the value, the more refined a profile is, but fewer profiles are shown on the chart
9. OI Value Area % - Choose the percentage of VA (same as in Volume Profile's VA)
10. Smooth OI Data - Useful for assets that have very large spikes in OI over large bars, helps create better profiles
11. OI Increase - Pick the color of OI increase nodes in the profile
12. OI Decrease - Pick the color of OI decrease nodes in the profile
13. Value Area Box - Pick the color of the Value Area Box
14. Session Box Thickness - Pick the thickness of the lines surrounding the chosen sessions
Advice
The indicator calculates the profile based on candles - the more candles you can show, the better profile will be formed. This means that it's best to view most sessions on timeframes like 15min or lower. The only exception is the Monthly profile, where timeframes above 15min should be used. Just take a few minutes and switch between timeframes and sessions and you will figure out the optimal settings.
This is the first version of Open Interest Profile script so please understand that it will be improved in future updates.
Thank you for your support.
** Some profile generation elements are inspired by @LonesomeTheBlue's volume profile script

Volume Profile Visible Range For All AccountsVolume Profile Visible Range For All Accounts is displaying volume from price perspective. It’s done by summing volume by the “estimated” transaction price. This version is estimating it based on public volume data so it can be used with any account.
Volume Profile is a powerful tool commonly used by PRO users, to disseminate its use also by users who operate on basic volume data, we have prepared a set of scripts:
Volume Profile For All Accounts – Analyze last 50-20000 bars.
Volume Profile From Date For All Accounts – Analyze all bars since start date.
Volume Profile Range For All Accounts – Analyze bars in a range between start and end date.
Volume Profile Visible Range For All Accounts – Analyze bars in the range visible on the screen.
If after reading script description something is not clear, do not hesitate to ask. We are helping all users.
Script Settings:
| SCANNER VISUALIZATION |
Rows – Number of rows
Width – Width of the visualization.
Position – Position of the visualization:
S_DU – At START of the area (left edge of the screen), DOWN first
S_UD – At START of the area (left edge of the screen), UP first
BE_DU – At BEFORE END of the area, DOWN first
BE_UD – At BEFORE END of the area, UP first
E_DU – At END of the area, DOWN first
E_UD – At END of the area, UP first
Color Up – Color of volume classified as move Up, or Both if separation is off.
Color Down - Color of volume classified as move Down
Color Border – Border color.
Up/Down separate – Draw separate volume classified as Up and Down
Show values – Showing volume values of the bars.
Troubleshooting:
In case of any problems, send error details to the author of the script.
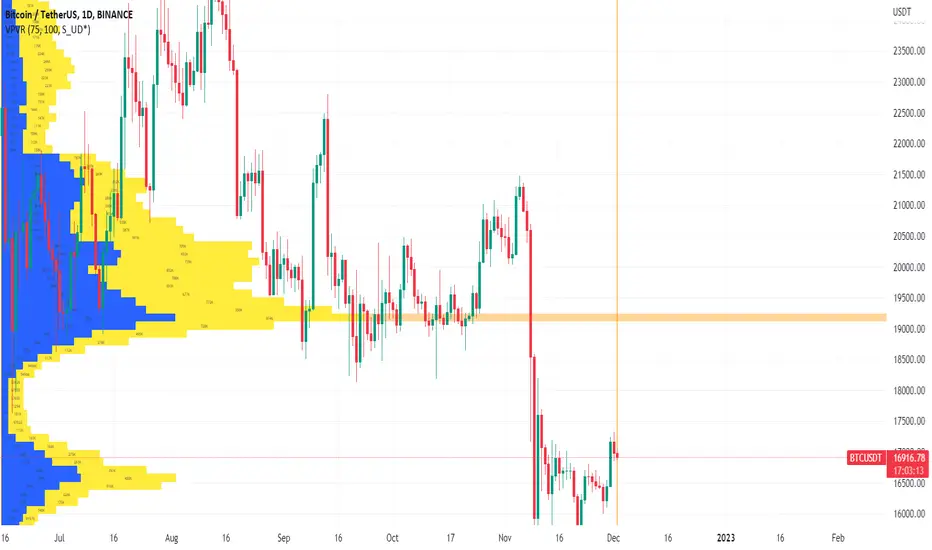
TwV Multi-timeframe Dynamic VRVPMulti-timeframe Dynamic Visible Range Volume Profile
The volume profile is an indicator that displays trading activity over a specified period and plots a histogram on the chart which reveals dominant and significant price levels based on volume and in essence gives a clear indication of Supply or demand at a certain price rather than volume in a certain period.
What makes this VRVP indicator different from other is that it is multi-timeframe and dynamic, meaning that it has the ability to show the POC for a higher timeframe and that it also recalculates the main POC every single time traders adjust the chart.
Most VRVP need to be adjusted to a fixed position for the Main POC, I made an improvement by giving the indicator the ability to identify the bars that are being look at in the screen, this really gives traders the possibility and agility to identify potential support and resistance areas without the need to be changing any settings on the indicator.
Furthermore, giving the ability to the indicator to be multi-timeframe allows traders not only to work with a point of control in one timeframe, but also have a dashed line plotting the Point of Control of a HIGHER timeframe, which could potentially be a strongest support or resistance. The multi-timeframe point of control is fixed only.
This VRVP is completely similar to the official Trading View paid subscription one.
Fundamentals
Point of Control (POC): The price level for the time period with the highest traded volume. The POC is represented by an amber line within the indicator.
Profile High: The highest reached price level during the specified time period
Profile Low: The lowest reached price level during the specified time period.
Value Area (VA): The range of price levels in which a specified percentage of all volume was traded during the time period. Typically, this percentage is set to 70% however it is up to the trader’s discretion.
Value Area High (VAH): The highest price level within the value area.
Value Area Low (VAL): The lowest price level within the value area.
Usage
The Resistance and Support levels can be provided by the Volume profile using a reactive method so they constantly change with price action and give a clearer picture to predict future price movements. The Reactive method relies on past price movements at certain price levels and applies a more significant understanding of price reaction at certain meaningful levels
Support levels will be areas where price will be supported on the way down.
Resistance levels will be areas that resist price on the way up.
A basic understanding of this is that Buyers will enter the market at the bottom of a profile and sellers will enter the market at the top of the profile.
Configuration
By the default the indicator has enabled plotting the charts timeframe Volume Profile.
Multi-timeframe option needs to be enabled and desired timeframe chosen from selector menu.
Bars back value for fixed calculation of the multi-timeframe point of control.
Traders can adjust default settings as follows:
Charts timeframe VRVP
Main POC color – Yellow
Positive Volume – Green
Negative Volume – Red
VRVP Width – 100 (Refers to the plotting width for better suiting on small screens)
Multi timeframe VRVP
Enable or disable calculations
Bars back - Fixed numbers of bars for calculation (Consider that max bars back limit is 5000, but it considers 5000 bars on the current charts timeframe, therefore traders need to take into consideration converting number of bars in higher timeframe to charts timeframe)
e.g.
Charts timeframe 15m – MTF desired 1H
1H = 60 min 15m = 15 min – 100 bars back equivalent to (60 min * 100) / 15 = 400
Lower than 5000 then calculations takes place, otherwise calculations will be disabled.
Multi-timeframe POC color = Light blue DASHED
Timeframe desired – 1H by default
Summary box
Enable or disable box
Box shows information regarding the exact price where Main POC and MTF POC reside
Table Size for better fitting on mobile devices
able Position for adjusting to each trader’s preference or use in combination with other indicators

Volume Profile Volume Delta OI Delta [Kioseff Trading]Hello!
This script serves to distinguish volume delta for any asset and open interest delta for Binance perpetual futures.
The image above provides further explanation of functionality and color correspondence.
The image above shows the indicator calculating volume at each tick level and displaying the metric.
The label color outline (neon effect) is configurable; the image above is absent the feature.
The image above shows Open Interest (OI) Delta calculated - similar to how the script calculates volume delta - for a Binance Perpetual Future pair.
This feature only works for Binance Futures pairs; the script will not load when trying to calculate OI Delta on other assets.
Additionally, a heatmap is displayable should you configure the indicator to calculate it.
The image above shows a heatmap using volume delta calculations.
The image above shows a heatmap using OI delta calculations.
Of course, these calculations - when absent requisite data - require some assumptions to better replicate calculations with access to requisite data.
The indicator assumes a 60/40 split when a tick level is traded at and only one metric - "buy volume" or "sell volume" is recorded. This means there shouldn't be any levels recorded where "buy volume" is greater than 0 and "sell volume" equals 0 and vice versa. While this assumption was performed arbitrarily, it may help better replicate volume delta and OI delta calculations seen on other charting platforms.
This option is configurable; you can select to have the script not assume a 60/40 split and instead record volume "as is" at the corresponding tick level.
The script also divides volume and open interest if a one-minute bar violates multiple tick levels. The volume or open interest generated on the one-minute bar will be divided by the number of tick levels it exceeds. The results are, subsequently, appended to the violated tick levels.
Further, the script can be set to recalculate after a user-defined time threshold is exceeded. You can also define the percentage or tick distance between levels.
Also, it'd be great if this indicator can nicely replicate volume delta indicators on other charting platforms. If you've any ideas on how price action can be used to better assume volume at the corresponding price area please let me know!
Thank you (:

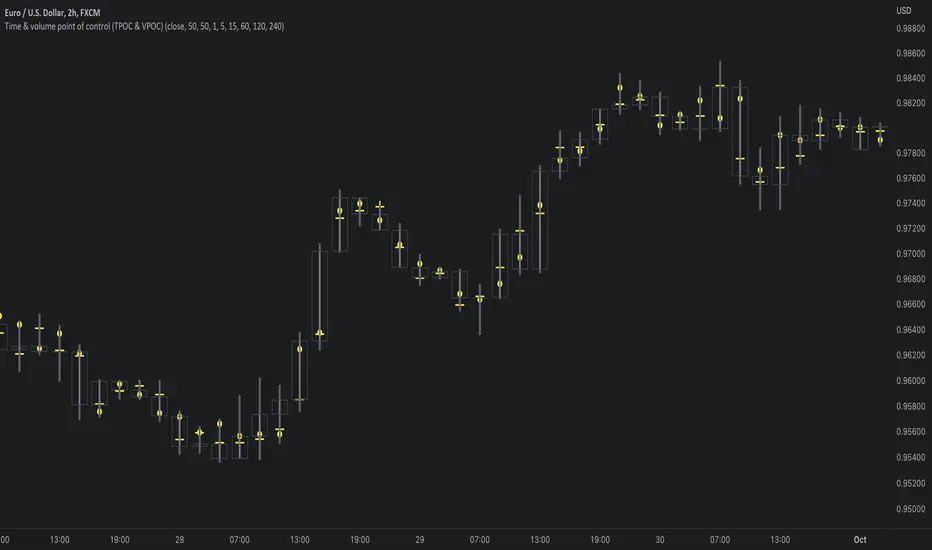
Time & volume point of control / quantifytoolsWhat are TPOC & VPOC?
TPOC (time point of control) and VPOC (volume point of control) are points in price where highest amount of time/volume was traded. This is considered key information in a market profile, as it shows where market participant interest was highest. Unlike full fledged market profile that shows total time/volume distribution, this script shows the points of control for each candle, plotted with a line (time) and a dot (volume). The script hides your candles/bars by default and forms a line in the middle representing candle range. In case of candles, borders will still be visible. This feature can be turned off in the settings.
Volume and time data are fetched from a lower timeframe that is automatically adjusted to fit the timeframe you're using. By default, the following settings are applied:
Charts <= 30 min: 1 minute timeframe
Charts > 30 min & <= 3 hours : 5 minute timeframe
Charts > 3 hours & <= 8 hours : 15 minute timeframe
Charts > 8 hours & <= 1D: 1 hour timeframe
Charts > 1D & <= 3D : 2 hour timeframe
Charts > 3D: 4 hour timeframe
Timeframe settings can be changed via input menu. The lower the timeframe, the more precision you get but with the cost of less historical data and slower loading time. Users can also choose which source to use for determining price for points of control, e.g. using close as source, the point of control is set to match the value of lower timeframe candle close. This could be replaced with OHLC4 for example, resulting in a point of control based on OHLC average.
To identify more profound points of market participant interest, TPOC & VPOC as percentage of total time/volume thresholds can be set via input menu. When a point of control is equal to or greater than the set percentage threshold, visual elements will be highlighted in a different color, e.g. 50% VPOC threshold will activate a highlight whenever volume traded at VPOC is equal to or greater than 50% of total volume. All colors are customizable.
VPOC is defined by fetching lower timeframe candle with the most amount of volume traded and using its close (by default) as a mark for point of control. For TPOC, each candle is divided into 10 lots which are used for calculating amount of closes taking place within the bracket values. The lot with highest amount of closes will be considered a point of control. This mark is displayed in the middle point of a lot:
How to utilize TPOC & VPOC
Example #1: Trapped market participants
One or both points of control at one end of candle range (wick tail) and candle close at the other end serves as an indication of market participants trapped in an awkward position. When price runs away further from these trapped participants, they are eventually forced to cover and drive price even further to the opposite direction:
Example #2: Trend initiation
A large move that leaves TPOC behind while VPOC is supportive serves as an indication of a trend initiation. Essentially, this is one way to identify an event where price traded sideways most of the time and suddenly moved away with volume:
Example #3: POC supported trend
A trend is healthy when it's supported by a point of control. Ideally you want to see either time or volume supporting a trend: