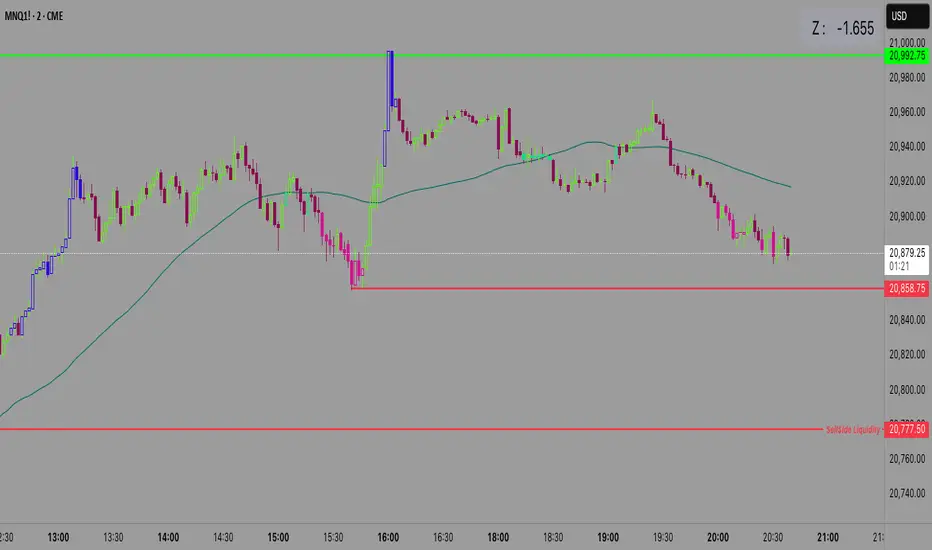
Z Score CANDLE and Exciting candle signal [DJ D]This script paints candles when their zscore reaches above 2 standard deviations in price from the mean. The blue candle represents up candle above 2. Magenta candle below -2. The candles can signal the beginning of a move and also importantly exhaustion.
The script also signals when a candle has volatility above 6. The higher the sensitivity the less frequent it will paint. These are real time paints and signals. You can adjust for higher time frames by adjusting the length of the z score and adjust the sensitivity of the volatility candles.
The yellow candle is a mean candle and can signify consolidation and/or indecision. Drawing a Darvis type box around around mean candles can give you a zone to watch.
These settings are for 1 minute scalping. The volatility sensitivity range between 1- 2 is good for 15, 30, (ie 1.0 or 1.2) and your discretion....
Zscore
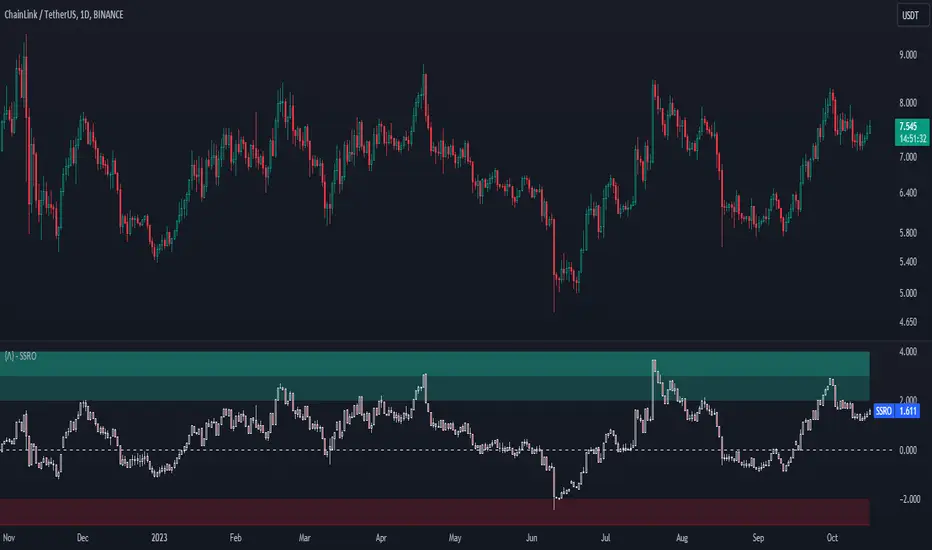
Stablecoin Supply Ratio Oscillator
The Stablecoin Supply Ratio Oscillator (SSRO) is a cryptocurrency indicator designed for mean reversion analysis and sentiment assessment. It calculates the ratio of CRYPTO:BTCUSD 's market capitalization to the sum of stablecoins' market capitalization and z-scores the result, offering insights into market sentiment and potential turning points.
Methodology:
The SSRO is calculated as follows-
method ssro(float src, array stblsrc, int len) =>
float ssr = src / stblsrc.sum() // Source of the underlying divided by the sum of stablecoin sources
(ssr - ta.sma(ssr, len)) / ta.stdev(ssr, len) // Z-Score Transformed
This ratio is Z-Scored to provide a standardized measure, allowing users to identify periods of market fear or greed based on the allocation of capital between the underlying and Stablecoins ( CRYPTOCAP:USDT , CRYPTOCAP:USDC , CRYPTO:TUSD , CRYPTOCAP:BUSD , CRYPTOCAP:DAI , CRYPTOCAP:USDD , CRYPTOCAP:FRAX ). The z-scored values indicate potential areas of discount (buying opportunities) or premium (selling opportunities) relative to historical patterns.
Customization:
Underlying Asset: SSRO is customizable to different underlying assets, offering a versatile tool for various cryptocurrencies.
Calculation Length: Users can adjust the length of the calculation, tailoring the indicator to short or long-term analysis.
Visualization: SSRO can be displayed as candles, providing a visual representation of premium and discount areas.
Interpretation:
Market Sentiment: Lower SSRO values may indicate market fear, suggesting a preference for stablecoins as a relatively safer haven for capital. Conversely, higher values may suggest market greed, as more capital is allocated to the underlying asset.
Utility and Use Cases:
1. Mean Reversion Analysis: SSRO identifies potential mean reversion opportunities, guiding traders on optimal entry and exit points.
2. Sentiment Analysis: The indicator provides insights into market sentiment, aiding traders in understanding market dynamics.
3. Macro Analysis: The majority of cryptos follow \ correlate to CRYPTO:BTCUSD , Therefore by assessing premium and discount areas of CRYPTO:BTCUSD relative to the chosen underlying asset, users gain insights into potential market tops and bottoms.
4. Divergence Analysis: SSRO divergence from price trends can signal potential reversals, providing traders with additional confirmation for their decisions.
The Stablecoin Supply Ratio Oscillator is a valuable tool for cryptocurrency traders, offering a nuanced perspective on market sentiment and mean reversion opportunities. Its customization options and visual representation make it a versatile and powerful addition to the crypto analyst's toolkit.
Extreme Reversal SignalThe Extreme Reversal Signal is designed to signal potential pivot points when the price of an asset becomes extremely overbought or oversold. Extreme conditions typically signal a brief or extensive price reversal, offering valuable entry or exit points. It's important to note that this indicator may produce multiple signals, making it essential to corroborate these signals with other forms of analysis to determine their validity. While the default settings provide valuable insights, it might be beneficial to experiment with different configurations to ensure the indicator's efficacy.
Two primary conditions define extremely overbought and oversold states. The first condition is that the price must deviate by two standard deviations from the 20-day Simple Moving Average (SMA). The second condition is that the 3-day SMA of the 14-day Stochastic Oscillator (STO) derived from the 14-day Relative Strength Index (RSI) is above or below the upper or lower limit.
Oversold states arise when the first condition is met and the 3-day SMA of the 14-day Stochastic RSI falls below the lower limit, suggesting a buy signal. These are visually represented by green triangles below the price bars. Overbought states arise when the first condition is met and the 3-day SMA of the 14-day Stochastic RSI rises above the upper limit, suggesting a sell signal. These are visually represented by red triangles above the price bars. It's also possible to set up automated alerts to get notifications when either of these two conditions is met to avoid missing out.
While this indicator has traditionally identified overbought and oversold conditions in various different assets, past performance does not guarantee future results. Therefore, it is advisable to supplement this indicator with other technical tools. For instance, trend indicators can greatly improve the decision-making process when planning for entries and exit points.

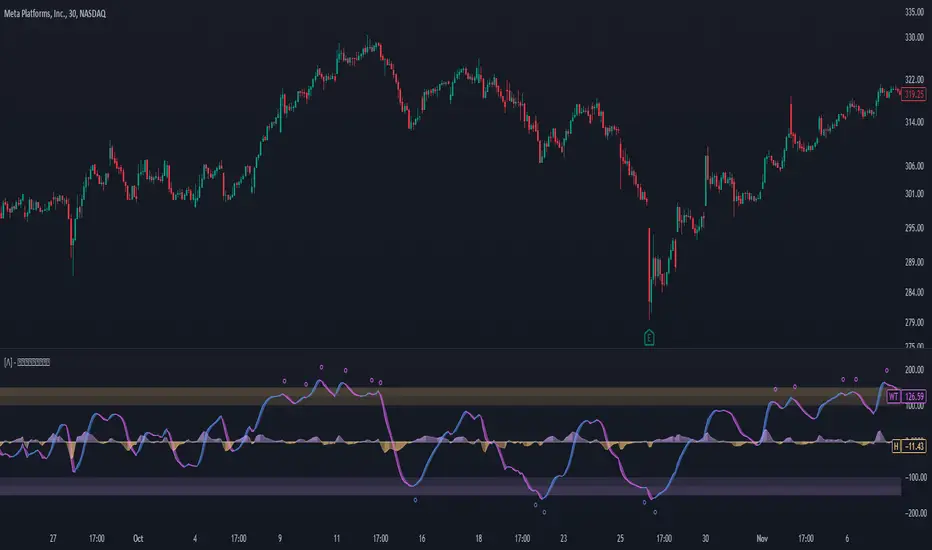
Enhanced WaveTrend OscillatorThe Enhanced WaveTrend Oscillator is a modified version of the original WaveTrend. The WaveTrend indicator is a popular technical analysis tool used to identify overbought and oversold conditions in the market and generate trading signals. The enhanced version addresses certain limitations of the original indicator and introduces additional features for improved analysis and comparison across assets.
WaveTrend:
The original WaveTrend indicator calculates two lines based on exponential moving averages and their relationship to the asset's price. The first line measures the distance between the asset's price and its EMA, while the second line smooths the first line over a specific period. The result is divided by 0.015 multiplied by the smoothed difference ('d' for reference). The indicator aims to identify overbought and oversold conditions by analyzing the relationship between the two lines.
In the original formula, the rudimentary estimation factor 0.015 times 'd' fails to accomodate for approximately a quarter of the data, preventing the indicator from reaching the traditional stationary levels of +-100. This limitation renders the indicator quantitatively biased, as it relies on the user's subjective adjustment of the levels. The enhanced version replaces this factor with the standard deviation of the asset's price, resulting in improved estimation accuracy and provides a more dynamic and robust outcome, we thereafter multiply the result by 100 to achieve a more traditional oscillation.
Enhancements and Features:
The enhanced version of the WaveTrend indicator addresses several limitations of the original indicator and introduces additional features-
Dynamic Estimation: The original indicator uses an arbitrary estimation factor, while the enhanced version replaces it with the standard deviation of the asset's price. This modification provides a more dynamic and accurate estimation, adapting to the specific price characteristics of each asset.
Stationary Support and Resistance Levels: The enhanced version provides stationary key support and resistance levels that range from -150 to 150. These levels are determined based on the analysis of the indicator's data and encompass more than 95% of the indicator's values. These levels offer important reference points for traders to identify potential price reversals or significant price movements.
Comparison Across Assets: The enhanced version allows for better comparison and analysis across different assets. By incorporating the standard deviation of the asset's price, the indicator provides a more consistent and comparable interpretation of the market conditions across multiple assets.
Upon closer inspection of the modification in the enhanced version, we can observe that the resulting indicator is a smoothed variation of the Z-Score!
f_ewave(src, chlen, avglen) =>
basis = ta.ema(src, chlen)
dev = ta.stdev(src, chlen)
wave = (src - basis) / dev * 100
ta.ema(wave, avglen)
Z-Score Analysis:
The Z-Score is a statistical measurement that quantifies how far a particular data point deviates from the mean in terms of standard deviations. In the enhanced version, the calculation involves determining the basis (mean) and deviation (standard deviation) of the asset's price to calculate its Z-Score, thereafter applying a smoothing technique to generate the final WaveTrend value.
Utility:
The 𝗘𝗻𝗵𝗮𝗻𝗰𝗲𝗱 𝗪𝗧 indicator offers traders and investors valuable insights into overbought and oversold conditions in the market. By analyzing the indicator's values and referencing the stationary support and resistance levels, traders can identify potential trend reversals, evaluate market strength, and make better informed analysis.
It is important to note that this indicator should be used in conjunction with other technical analysis tools and indicators to confirm trading signals and validate market dynamics.
Credit:
The 𝗘𝗻𝗵𝗮𝗻𝗰𝗲𝗱 𝗪𝗧 indicator is a modification of the original WaveTrend Oscillator developed by @LazyBear on TradingView.
Example Charts:
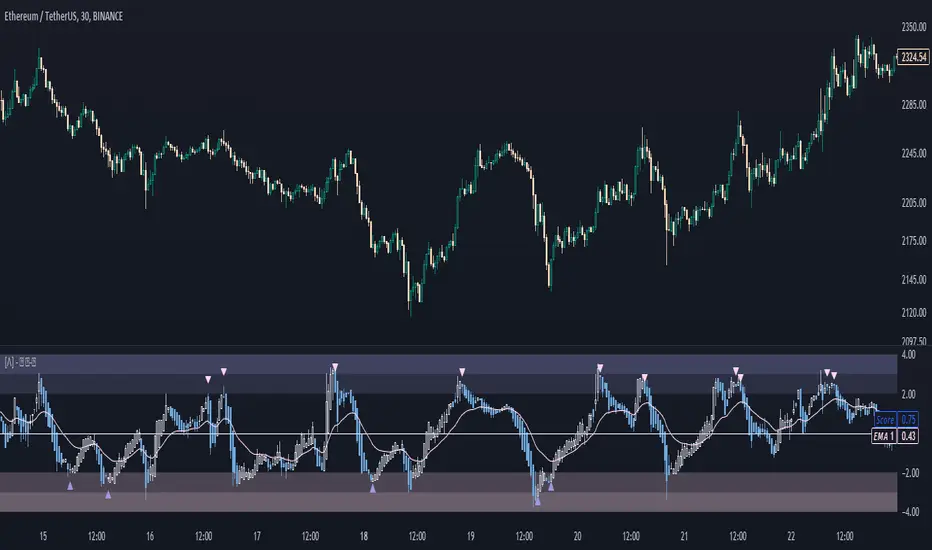
Z-Score Heikin-Ashi TransformedThe Z-Score Heikin-Ashi Transformed (𝘡 𝘏-𝘈) indicator is a powerful technical tool that combines the principles of Z-Score and Heikin Ashi to provide traders with a smoothed representation of price movements and a standardized measure of market volatility.
The 𝘡 𝘏-𝘈 indicator applies the Z-Score calculation to price data and then transforms the resulting Z-Scores using the Heikin Ashi technique. Understanding the individual components of Z-Score and Heikin Ashi will provide a foundation for comprehending the methodology and unique features of this indicator.
Z-Score:
Z-Score is a statistical measure that quantifies the distance between a data point and the mean, relative to the standard deviation. It provides a standardized value that allows traders to compare different data points on a common scale. In the context of the 𝘡 𝘏-𝘈 indicator, Z-Score is calculated based on price data, enabling the identification of extreme price movements and the assessment of their significance.
Heikin Ashi:
Heikin Ashi is a popular charting technique that aims to filter out market noise and provide a smoother representation of price trends. It involves calculating each candlestick based on the average of the previous candle's open, close, high, and low prices. This approach results in a chart that reduces the impact of short-term price fluctuations and reveals the underlying trend more clearly.
Methodology:
The 𝘡 𝘏-𝘈 indicator starts by calculating the Z-Score of the price data, which provides a standardized measure of how far each price point deviates from the mean. Next, the resulting Z-Scores are transformed using the Heikin Ashi technique. Each Z-Score value is modified according to the Heikin Ashi formula, which incorporates the average of the previous Heikin Ashi candle's open and close prices. This transformation smooths out the Z-Score values and reduces the impact of short-term price fluctuations, providing a clearer view of market trends.
This tool enables traders to identify significant price movements and assess their relative strength compared to historical data. Positive transformed Z-Scores indicate that prices are above the average, suggesting potential overbought conditions, while negative transformed Z-Scores indicate prices below the average, suggesting potential oversold conditions. Traders can utilize this information to identify potential reversals, confirm trend strength, and generate trading signals.
Utility:
The indicator offers valuable insights into price volatility and trend analysis. By combining the standardized measure of Z-Score with the smoothing effect of Heikin Ashi, traders can make more informed trading decisions and improve their understanding of market dynamics. 𝘡 𝘏-𝘈 can be used in various trading strategies, including identifying overbought or oversold conditions, confirming trend reversals, and establishing entry and exit points.
Note that the 𝘡 𝘏-𝘈 should be used in conjunction with other technical indicators and analysis tools to validate signals and avoid false positives. Additionally, traders are encouraged to conduct thorough backtesting and experimentation with different parameter settings to optimize the effectiveness of the indicator for their specific trading approach.
Key Features:
Optional Reversion Doritos
Adjustable Reversion Threshold
2 Adjustable EMAs
Example Charts:
See Also:
On Balance Volume Heikin-Ashi Transformed
Z-Score CandlesThe Z-Score Candles indicator is a powerful tool designed to help traders identify overbought and oversold conditions in the market. It utilizes the concept of the Z-score, which measures the deviation of a data point from its mean in terms of standard deviations.
By applying a sigmoid transformation to the Z-score values of the price candles, this indicator provides a visual representation of the market sentiment. The resulting sigmoid candles offer a clearer view of potential trend reversals and market extremes.
Parameters:
Length: The length parameter determines the number of bars used in the calculations. A higher value results in a smoother representation of the Z-scores, while a lower value makes the indicator more responsive to short-term price movements.
Features:
Sigmoid Function: The indicator incorporates a sigmoid function to transform the Z-score values, making them more suitable for visual analysis.
Original Price Candles: The indicator plots the sigmoid candles, representing the open, high, low, and close values of the price action. Green candles indicate a positive sentiment (szopen < szclose), while red candles indicate a negative sentiment (szopen >= szclose).
Oversold and Overbought Areas: The indicator creates horizontal lines at 0.1 and 0.9 on the y-axis, representing oversold and overbought levels, respectively. Additionally, it adds shaded areas to highlight the extreme regions.
Usage: Traders can utilize the Z-Score Candles indicator to identify potential market turning points, reversals, and overextended price levels. When the sigmoid candles reach the oversold or overbought areas, it may suggest a possible trend reversal or the initiation of a new trend.
Note: This indicator should be used in conjunction with other technical analysis tools and indicators to confirm trading decisions.

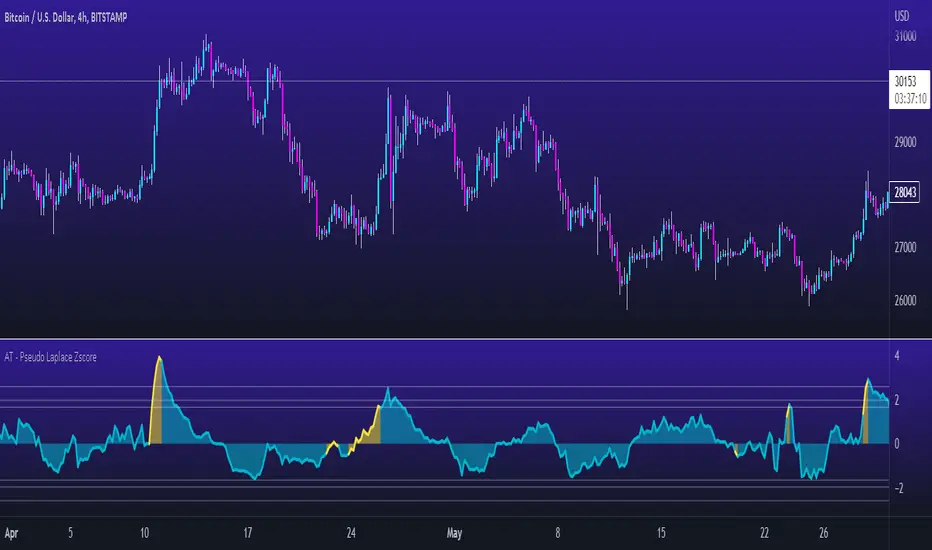
Alpha Trading - Pseudo Laplace Z ScoreAlpha Trading - Pseudo Laplace Z Score
Slowly, very slowly a lot of quant and statistical methods have diffused the world of traditional technical analysis with the world of real math - VEPS (Volatility, Entropy, Probability and Statistics).
‘Alpha Trading' is showing the world how VEPS can show the best probabilities of success with your trading journey.
We send a big thank you to tradingview platform and pine coding team, for this great platform and the possibility to show the methods to trade with quant and statistical methods.
There appears to be resistance in the industry about these methods, so it is even more important now than ever, to support this awesome platform and amazing talented team at trading view and pine coders who enable us all with this wonderful platform to produce tools based on VEPS (Volatility, Entropy, Probability and Statistics).
The newest indicator from the Alpha Trading stable is the “Pseudo Laplace Z Score” which combines the established statistical method of z score applied on asset data. Which is based on our previous indicator called the “Alpha Trading – RMS-Z score”. We have made some optimizations, to give an even better fit to the specific returns of price. Optimizations are on the observation that returns are more Laplace distributed than Normal distributed.
figure 1: pink distribution of the real signal (BTC, 2D), gray is perfect theoretical Laplace distribution.
Therefore, the data is not Normal distributed, but Laplace distributed. Our new indicator calculates the real Z-Score of an underlying asset.
As Z Score is a standardized Normal distribution, it relies upon the definition of Normal distribution. If it deviates from this, it still can give useful information, but the absolute value (distance from the mean in standard deviations) is not reliable, and therefore the use of Normal distribution has some uncertainties.
Therefore, this indicator calculates a pseudo standard deviation, based on the Laplace distribution formulas and the relating Z Score.
By looking at the resulting distribution of the indicator itself, it is close to a perfect theoretical Normal distribution. It is much closer to the theoretical curve (gray), and thus indicates that the use of this approach is correct. Now we can show absolute values (i.e. distance to mean, in standard deviations) which can thus be considered to assist in determining the probabilities with your trading.
figure 2: distribution of indicator AT - Pseudo Laplace Z Score vs a theoretical perfect Normal distribution on BTC 4h
Looking at the indicator directly, it appears that the probability of 99% is crossed very rarely, like expected. Because only 1% of all candles we would expect this probability line to be exceeded.
figure 3: BTC 8h with AT-Pseudo Laplace Z Score
Coming back to the method of a Z Score in general. What is a Z-Score?
A Z-score is a numerical measurement that describes a value's relationship to the mean of a group of values. Z-score is measured in terms of standard deviations from the mean. If a Z-score is 0, it indicates that the data point's score is identical to the mean score. A Z-score of 1.0 would indicate a value that is one standard deviation from the mean. Z-scores may be positive or negative, with a positive value indicating the score is above the mean and a negative score indicating it is below the mean.
Simply put, a z-score (also called a standard score) gives you an idea of how far from the mean a data point is.
Basic guidelines How to Use this indicator:
Consider Entering a Long Position when the indicator is low. Best moves are generally when the indicator Turns yellow(outlier)
Consider Entering a Short Position when the indicator is high. Best moves are generally when the indicator Turns yellow(outlier)
Consider the 3 confidence interval lines (gray lines) at 90%, 95%, and 99%, as possible reversal point (with related probability that it is not getting exceeded 🡪 reversal)
gZScoreMETA currently has a strong bullish trend and is the distance from its yearly average too.
But, how much META is distant from the mean?
With this indicator, you can see an absolute value useful to determine support and resistance when the price is so far.
In this example, applied to the daily chart, currently, META is distant 3 standard deviations that could be seen as interesting resistance looking the past
This indicator could be applied as a filter for all your mean reversion strategies.

VolatilityIndicatorsLibrary "VolatilityIndicators"
This is a library of Volatility Indicators .
It aims to facilitate the grouping of this category of indicators, and also offer the customized supply of
the parameters and sources, not being restricted to just the closing price.
@Thanks and credits:
1. Dynamic Zones: Leo Zamansky, Ph.D., and David Stendahl
2. Deviation: Karl Pearson (code by TradingView)
3. Variance: Ronald Fisher (code by TradingView)
4. Z-score: Veronique Valcu (code by HPotter)
5. Standard deviation: Ronald Fisher (code by TradingView)
6. ATR (Average True Range): J. Welles Wilder (code by TradingView)
7. ATRP (Average True Range Percent): millerrh
8. Historical Volatility: HPotter
9. Min-Max Scale Normalization: gorx1
10. Mean Normalization: gorx1
11. Standardization: gorx1
12. Scaling to unit length: gorx1
13. LS Volatility Index: Alexandre Wolwacz (Stormer), Fabrício Lorenz, Fábio Figueiredo (Vlad) (code by me)
14. Bollinger Bands: John Bollinger (code by TradingView)
15. Bollinger Bands %: John Bollinger (code by TradingView)
16. Bollinger Bands Width: John Bollinger (code by TradingView)
dev(source, length, anotherSource)
Deviation. Measure the difference between a source in relation to another source
Parameters:
source (float)
length (simple int) : (int) Sequential period to calculate the deviation
anotherSource (float) : (float) Source to compare
Returns: (float) Bollinger Bands Width
variance(src, mean, length, biased, degreesOfFreedom)
Variance. A statistical measurement of the spread between numbers in a data set. More specifically,
variance measures how far each number in the set is from the mean (average), and thus from every other number in the set.
Variance is often depicted by this symbol: σ2. It is used by both analysts and traders to determine volatility and market security.
Parameters:
src (float) : (float) Source to calculate variance
mean (float) : (float) Mean (Moving average)
length (simple int) : (int) The sequential period to calcule the variance (number of values in data set)
biased (simple bool) : (bool) Defines the type of standard deviation. If true, uses biased sample variance (n),
degreesOfFreedom (simple int) : (int) Degrees of freedom. The number of values in the final calculation of a statistic that are free to vary.
Default value is n-1, where n here is length. Only applies when biased parameter is defined as true.
Returns: (float) Standard deviation
stDev(src, length, mean, biased, degreesOfFreedom)
Measure the Standard deviation from a source in relation to it's moving average.
In this implementation, you pass the average as a parameter, allowing a more personalized calculation.
Parameters:
src (float) : (float) Source to calculate standard deviation
length (simple int) : (int) The sequential period to calcule the standard deviation
mean (float) : (float) Moving average.
biased (simple bool) : (bool) Defines the type of standard deviation. If true, uses biased sample variance (n),
else uses unbiased sample variance (n-1 or another value, as long as it is in the range between 1 and n-1), where n=length.
degreesOfFreedom (simple int) : (int) Degrees of freedom. The number of values in the final calculation of a statistic that are free to vary.
Default value is n-1, where n here is length.
Returns: (float) Standard deviation
zscore(src, mean, length, biased, degreesOfFreedom)
Z-Score. A z-score is a statistical measurement that indicates how many standard deviations a data point is from
the mean of a data set. It is also known as a standard score. The formula for calculating a z-score is (x - μ) / σ,
where x is the individual data point, μ is the mean of the data set, and σ is the standard deviation of the data set.
Z-scores are useful in identifying outliers or extreme values in a data set. A positive z-score indicates that the
data point is above the mean, while a negative z-score indicates that the data point is below the mean. A z-score of
0 indicates that the data point is equal to the mean.
Z-scores are often used in hypothesis testing and determining confidence intervals. They can also be used to compare
data sets with different units or scales, as the z-score standardizes the data. Overall, z-scores provide a way to
measure the relative position of a data point in a data
Parameters:
src (float) : (float) Source to calculate z-score
mean (float) : (float) Moving average.
length (simple int) : (int) The sequential period to calcule the standard deviation
biased (simple bool) : (bool) Defines the type of standard deviation. If true, uses biased sample variance (n),
else uses unbiased sample variance (n-1 or another value, as long as it is in the range between 1 and n-1), where n=length.
degreesOfFreedom (simple int) : (int) Degrees of freedom. The number of values in the final calculation of a statistic that are free to vary.
Default value is n-1, where n here is length.
Returns: (float) Z-score
atr(source, length)
ATR: Average True Range. Customized version with source parameter.
Parameters:
source (float) : (float) Source
length (simple int) : (int) Length (number of bars back)
Returns: (float) ATR
atrp(length, sourceP)
ATRP (Average True Range Percent)
Parameters:
length (simple int) : (int) Length (number of bars back) for ATR
sourceP (float) : (float) Source for calculating percentage relativity
Returns: (float) ATRP
atrp(source, length, sourceP)
ATRP (Average True Range Percent). Customized version with source parameter.
Parameters:
source (float) : (float) Source for ATR
length (simple int) : (int) Length (number of bars back) for ATR
sourceP (float) : (float) Source for calculating percentage relativity
Returns: (float) ATRP
historicalVolatility(lengthATR, lengthHist)
Historical Volatility
Parameters:
lengthATR (simple int) : (int) Length (number of bars back) for ATR
lengthHist (simple int) : (int) Length (number of bars back) for Historical Volatility
Returns: (float) Historical Volatility
historicalVolatility(source, lengthATR, lengthHist)
Historical Volatility
Parameters:
source (float) : (float) Source for ATR
lengthATR (simple int) : (int) Length (number of bars back) for ATR
lengthHist (simple int) : (int) Length (number of bars back) for Historical Volatility
Returns: (float) Historical Volatility
minMaxNormalization(src, numbars)
Min-Max Scale Normalization. Maximum and minimum values are taken from the sequential range of
numbars bars back, where numbars is a number defined by the user.
Parameters:
src (float) : (float) Source to normalize
numbars (simple int) : (int) Numbers of sequential bars back to seek for lowest and hightest values.
Returns: (float) Normalized value
minMaxNormalization(src, numbars, minimumLimit, maximumLimit)
Min-Max Scale Normalization. Maximum and minimum values are taken from the sequential range of
numbars bars back, where numbars is a number defined by the user.
In this implementation, the user explicitly provides the desired minimum (min) and maximum (max) values for the scale,
rather than using the minimum and maximum values from the data.
Parameters:
src (float) : (float) Source to normalize
numbars (simple int) : (int) Numbers of sequential bars back to seek for lowest and hightest values.
minimumLimit (simple float) : (float) Minimum value to scale
maximumLimit (simple float) : (float) Maximum value to scale
Returns: (float) Normalized value
meanNormalization(src, numbars, mean)
Mean Normalization
Parameters:
src (float) : (float) Source to normalize
numbars (simple int) : (int) Numbers of sequential bars back to seek for lowest and hightest values.
mean (float) : (float) Mean of source
Returns: (float) Normalized value
standardization(src, mean, stDev)
Standardization (Z-score Normalization). How "outside the mean" values relate to the standard deviation (ratio between first and second)
Parameters:
src (float) : (float) Source to normalize
mean (float) : (float) Mean of source
stDev (float) : (float) Standard Deviation
Returns: (float) Normalized value
scalingToUnitLength(src, numbars)
Scaling to unit length
Parameters:
src (float) : (float) Source to normalize
numbars (simple int) : (int) Numbers of sequential bars back to seek for lowest and hightest values.
Returns: (float) Normalized value
lsVolatilityIndex(movingAverage, sourceHvol, lengthATR, lengthHist, lenNormal, lowerLimit, upperLimit)
LS Volatility Index. Measures the volatility of price in relation to an average.
Parameters:
movingAverage (float) : (float) A moving average
sourceHvol (float) : (float) Source for calculating the historical volatility
lengthATR (simple int) : (float) Length for calculating the ATR (Average True Range)
lengthHist (simple int) : (float) Length for calculating the historical volatility
lenNormal (simple int) : (float) Length for normalization
lowerLimit (simple int)
upperLimit (simple int)
Returns: (float) LS Volatility Index
lsVolatilityIndex(sourcePrice, movingAverage, sourceHvol, lengthATR, lengthHist, lenNormal, lowerLimit, upperLimit)
LS Volatility Index. Measures the volatility of price in relation to an average.
Parameters:
sourcePrice (float) : (float) Source for measure the distance
movingAverage (float) : (float) A moving average
sourceHvol (float) : (float) Source for calculating the historical volatility
lengthATR (simple int) : (float) Length for calculating the ATR (Average True Range)
lengthHist (simple int) : (float) Length for calculating the historical volatility
lenNormal (simple int)
lowerLimit (simple int)
upperLimit (simple int)
Returns: (float) LS Volatility Index
bollingerBands(src, length, mult, basis)
Bollinger Bands. A Bollinger Band is a technical analysis tool defined by a set of lines plotted
two standard deviations (positively and negatively) away from a simple moving average (SMA) of the security's price,
but can be adjusted to user preferences. In this version you can pass a customized basis (moving average), not only SMA.
Parameters:
src (float) : (float) Source to calculate standard deviation used in Bollinger Bands
length (simple int) : (int) The time period to be used in calculating the standard deviation
mult (simple float) : (float) Multiplier used in standard deviation. Basically, the upper/lower bands are standard deviation multiplied by this.
basis (float) : (float) Basis of Bollinger Bands (a moving average)
Returns: (float) A tuple of Bollinger Bands, where index 1=basis; 2=basis+dev; 3=basis-dev; and dev=multiplier*stdev
bollingerBands(src, length, aMult, basis)
Bollinger Bands. A Bollinger Band is a technical analysis tool defined by a set of lines plotted
two standard deviations (positively and negatively) away from a simple moving average (SMA) of the security's price,
but can be adjusted to user preferences. In this version you can pass a customized basis (moving average), not only SMA.
Also, various multipliers can be passed, thus getting more bands (instead of just 2).
Parameters:
src (float) : (float) Source to calculate standard deviation used in Bollinger Bands
length (simple int) : (int) The time period to be used in calculating the standard deviation
aMult (float ) : (float ) An array of multiplies used in standard deviation. Basically, the upper/lower bands are standard deviation multiplied by this.
This array of multipliers permit the use of various bands, not only 2.
basis (float) : (float) Basis of Bollinger Bands (a moving average)
Returns: (float ) An array of Bollinger Bands, where:
index 1=basis; 2=basis+dev1; 3=basis-dev1; 4=basis+dev2, 5=basis-dev2, 6=basis+dev2, 7=basis-dev2, Nup=basis+devN, Nlow=basis-devN
and dev1, dev2, devN are ```multiplier N * stdev```
bollingerBandsB(src, length, mult, basis)
Bollinger Bands %B - or Percent Bandwidth (%B).
Quantify or display where price (or another source) is in relation to the bands.
%B can be useful in identifying trends and trading signals.
Calculation:
%B = (Current Price - Lower Band) / (Upper Band - Lower Band)
Parameters:
src (float) : (float) Source to calculate standard deviation used in Bollinger Bands
length (simple int) : (int) The time period to be used in calculating the standard deviation
mult (simple float) : (float) Multiplier used in standard deviation
basis (float) : (float) Basis of Bollinger Bands (a moving average)
Returns: (float) Bollinger Bands %B
bollingerBandsB(src, length, aMult, basis)
Bollinger Bands %B - or Percent Bandwidth (%B).
Quantify or display where price (or another source) is in relation to the bands.
%B can be useful in identifying trends and trading signals.
Calculation
%B = (Current Price - Lower Band) / (Upper Band - Lower Band)
Parameters:
src (float) : (float) Source to calculate standard deviation used in Bollinger Bands
length (simple int) : (int) The time period to be used in calculating the standard deviation
aMult (float ) : (float ) Array of multiplier used in standard deviation. Basically, the upper/lower bands are standard deviation multiplied by this.
This array of multipliers permit the use of various bands, not only 2.
basis (float) : (float) Basis of Bollinger Bands (a moving average)
Returns: (float ) An array of Bollinger Bands %B. The number of results in this array is equal the numbers of multipliers passed via parameter.
bollingerBandsW(src, length, mult, basis)
Bollinger Bands Width. Serve as a way to quantitatively measure the width between the Upper and Lower Bands
Calculation:
Bollinger Bands Width = (Upper Band - Lower Band) / Middle Band
Parameters:
src (float) : (float) Source to calculate standard deviation used in Bollinger Bands
length (simple int) : (int) Sequential period to calculate the standard deviation
mult (simple float) : (float) Multiplier used in standard deviation
basis (float) : (float) Basis of Bollinger Bands (a moving average)
Returns: (float) Bollinger Bands Width
bollingerBandsW(src, length, aMult, basis)
Bollinger Bands Width. Serve as a way to quantitatively measure the width between the Upper and Lower Bands
Calculation
Bollinger Bands Width = (Upper Band - Lower Band) / Middle Band
Parameters:
src (float) : (float) Source to calculate standard deviation used in Bollinger Bands
length (simple int) : (int) Sequential period to calculate the standard deviation
aMult (float ) : (float ) Array of multiplier used in standard deviation. Basically, the upper/lower bands are standard deviation multiplied by this.
This array of multipliers permit the use of various bands, not only 2.
basis (float) : (float) Basis of Bollinger Bands (a moving average)
Returns: (float ) An array of Bollinger Bands Width. The number of results in this array is equal the numbers of multipliers passed via parameter.
dinamicZone(source, sampleLength, pcntAbove, pcntBelow)
Get Dynamic Zones
Parameters:
source (float) : (float) Source
sampleLength (simple int) : (int) Sample Length
pcntAbove (simple float) : (float) Calculates the top of the dynamic zone, considering that the maximum values are above x% of the sample
pcntBelow (simple float) : (float) Calculates the bottom of the dynamic zone, considering that the minimum values are below x% of the sample
Returns: A tuple with 3 series of values: (1) Upper Line of Dynamic Zone;
(2) Lower Line of Dynamic Zone; (3) Center of Dynamic Zone (x = 50%)
Examples:

Regularized-Moving-Average Oscillator SuiteThe Regularized-MA Oscillator Suite is a versatile indicator that transforms any moving average into an oscillator. It comprises up to 13 different moving average types, including KAMA, T3, and ALMA. This indicator serves as a valuable tool for both trend following and mean reversion strategies, providing traders and investors with enhanced insights into market dynamics.
Methodology:
The Regularized MA Oscillator Suite calculates the moving average (MA) based on user-defined parameters such as length, moving average type, and custom smoothing factors. It then derives the mean and standard deviation of the MA using a normalized period. Finally, it computes the Z-Score by subtracting the mean from the MA and dividing it by the standard deviation.
KAMA (Kaufman's Adaptive Moving Average):
KAMA is a unique moving average type that dynamically adjusts its smoothing period based on market volatility. It adapts to changing market conditions, providing a smoother response during periods of low volatility and a quicker response during periods of high volatility. This allows traders to capture trends effectively while reducing noise.
T3 (Tillson's Exponential Moving Average):
T3 is an exponential moving average that incorporates additional smoothing techniques to reduce lag and provide a more responsive indicator. It aims to maintain a balance between responsiveness and smoothness, allowing traders to identify trend reversals with greater accuracy.
ALMA (Arnaud Legoux Moving Average):
ALMA is a moving average type that utilizes a combination of linear regression and exponential moving average techniques. It offers a unique way of calculating the moving average by providing a smoother and more accurate representation of price trends. ALMA reduces lag and noise, enabling traders to identify trend changes and potential entry or exit points more effectively.
Z-Score:
The Z-Score calculation in the Regularized-MA Oscillator Suite standardizes the values of the moving average. It measures the deviation of each data point from the mean in terms of standard deviations. By normalizing the moving average through the Z-Score, the indicator enables traders to assess the relative position of price in relation to its mean and volatility. This information can be valuable for identifying overbought and oversold conditions, as well as potential trend reversals.
Utility:
The Regularized-MA Oscillator Suite with its unique moving average types and Z-Score calculation offers traders and investors powerful analytical tools. It can be used for trend following strategies by analyzing the oscillator's position relative to the midline. Traders can also employ it as a mean reversion tool by identifying peak values above user-defined deviations. These features assist in identifying potential entry and exit points, enhancing trading decisions and market analysis.
Key Features:
Variety of 13 MA types.
Potential reversal point bubbles.
Bar coloring methods - Trend (Midline cross), Extremities, Reversions, Slope
Example Charts:

Ichimoku Z-Score Stochastic Oscillator with Kumo Depth Analysis---
Ichimoku Z-Score Stochastic Oscillator with Kumo Depth Analysis
---
Script Overview
Welcome to the Advanced Ichimoku Z-Score Stochastic Oscillator with Kumo Depth Analysis. This unique strategy is designed to provide a comprehensive, multi-timeframe trading view by leveraging the Ichimoku Cloud, Z-Score, Stochastic Oscillator, and an innovative implied volatility measure – the Kumo Depth. By integrating these powerful tools into one script, traders can make more informed decisions by considering trend strength, volatility, and volume in one holistic view.
Rationale & Strategy
The script was created with the rationale that trading decisions should not only be based on price action and volume, but also on market trend strength and implied volatility. The script integrates these various elements:
The Ichimoku Cloud, a versatile indicator that provides support and resistance levels, trend direction, and momentum all at once.
The Z-Score, a statistical measurement of a value's relationship to the mean (average) of a group of values.
The Stochastic Oscillator, a momentum indicator that uses support and resistance levels to determine probable trend reversals.
The Kumo Depth Analysis, an innovative measure of implied volatility and market trend strength derived from the thickness of the Ichimoku Cloud.
How It Works
This script works by providing visual buy and sell signals based on the confluence of the aforementioned tools.
Ichimoku Cloud and Z-Score: The script first calculates the Ichimoku Cloud lines for both a higher and lower timeframe and measures how much current prices deviate from the cloud using Z-Score.
Stochastic Oscillator: This Z-Score is then inputted into a Stochastic Oscillator, thus giving the oscillator a more normalized range.
Kumo Depth Analysis: Simultaneously, the thickness of the Ichimoku Cloud (Kumo) is calculated as an implied volatility indicator. This depth is normalized and used as a filter to ensure we are trading in a market with substantial trend strength.
Signals: Buy and sell signals are triggered based on the crossover and crossunder of the Stochastic Oscillator lines. Signals are then filtered based on their location relative to the Ichimoku Cloud (price should be above the cloud for buy signals and below for sell signals) and the normalized Kumo Depth.
How to Use
Signal Types: The script provides both strong and weak signals. Strong signals are accompanied by high volume, while weak signals are not. Strong buy signals are indicated with a green triangle at the top, strong sell signals with a red triangle at the bottom. Weak signals are shown as blue and yellow circles, respectively.
Trend Strength: The trend strength is shown by the normalized Kumo Depth. The greater the Kumo Depth, the stronger the trend.
Timeframes: You can customize the timeframes used for the calculations in the input settings.
Adjustments: Users can adjust parameters such as the Ichimoku settings, Stochastic Oscillator settings, timeframes, and Kumo Depth settings to suit their trading style and the characteristics of the asset they are trading.
This script is a complete trading strategy tool providing multi-timeframe, trend-following, and volume-based signals. It's best suited for traders who understand the concepts of trend trading, stochastic oscillators, and volatility measures and want to incorporate them all into one powerful, comprehensive trading strategy.

Z-Score(Slope(OBV(LBC)))Summary : Market price is simply a dance of liquidity to the specific market.
tl;dr: "Cash come-in, market moon; Cash go-out, market doom"
In Simple Language : Large changes in the money flow to an asset often mark local price extremia.
Academic paper:
Title: Z-Score(Slope(OBV)): An Efficient Indicator for Identifying Local Extremes in Asset Prices
Abstract: This paper presents a novel trading indicator, Z-Score(Slope(OBV)), that aims to predict local extremes in asset prices by analyzing the patterns of money flow. The indicator is constructed using the Z-score of the slope of the On Balance Volume (OBV).
Hypothesis: The price levels at which the money flows into and out of an asset often mark local extremes. This notion underpins our exploration of the Z-Score(Slope(OBV)) indicator's potential in identifying these critical points.
1. On Balance Volume (OBV): The OBV is a momentum indicator that leverages the volume flow to forecast potential changes in asset prices. It operates on the premise that changes in volume often presage shifts in price. The OBV algorithm adds a period's volume to the cumulative total when the closing price is up and subtracts it when the closing price is down. Therefore, an ascending OBV suggests positive volume pressure, potentially heralding higher prices, while a declining OBV signifies negative volume pressure, possibly indicating lower prices.
2. Slope: In this context, the slope represents the rate of change of the OBV. It is a measure of the rise-over-run for a linear regression line through the OBV data points. By evaluating the slope of the OBV, we can extract valuable insights into the momentum of the volume. A positive slope indicates increasing volume momentum, suggesting growing interest in the asset, while a negative slope implies declining volume momentum, potentially reflecting dwindling interest.
3. Z-Score: The Z-score is a statistical measure that delineates a data point's relationship to the mean of a group of values, expressed in terms of standard deviations from the mean. For instance, a Z-score of 0 reveals that the data point's score aligns with the mean score. Positive Z-scores indicate values higher than the mean, and negative Z-scores represent values lower than the mean. Applying the Z-score to the slope of the OBV allows us to comprehend the degree of deviation of the current OBV slope from its historical mean.
A Z-score of 1 suggests that the OBV's slope is one standard deviation from the mean, which implies that the slope is within the range of values where approximately 68% (not 67%) of all values lie.
A Z-score of 2 implies that the slope is two standard deviations from the mean, thus within the range where roughly 95% of all values lie.
A Z-score of 3 indicates that the slope is three standard deviations from the mean, putting it within the range where about 99.7% of all values lie.
Z-scores of 4 and 5 and beyond are increasingly rare and represent extreme values.
4. The Z-Score(Slope(OBV)) Indicator and Line Break Chart Synergy: The Z-Score(Slope(OBV)) indicator's efficiency is further amplified when visualized using a Line Break chart. This chart type disregards time, concentrating solely on price changes, thus providing a clear visualization of market trends. When combined with the Line Break chart, the Z-Score(Slope(OBV(LBC))) indicator can help traders identify trend shifts more accurately and promptly, reinforcing the hypothesis that price levels where money flows into and out of an asset often mark local extremes.
In summary, the Z-Score(Slope(OBV)) indicator, combining volume, momentum, and statistical analysis, provides a robust tool for traders to predict local extremes in asset prices.
Regarding Implementation:
- This is implemented using Pinescript V5
- Uses inbuilt ta module
- Very effective and simple and efficient computation in 30 lines of code

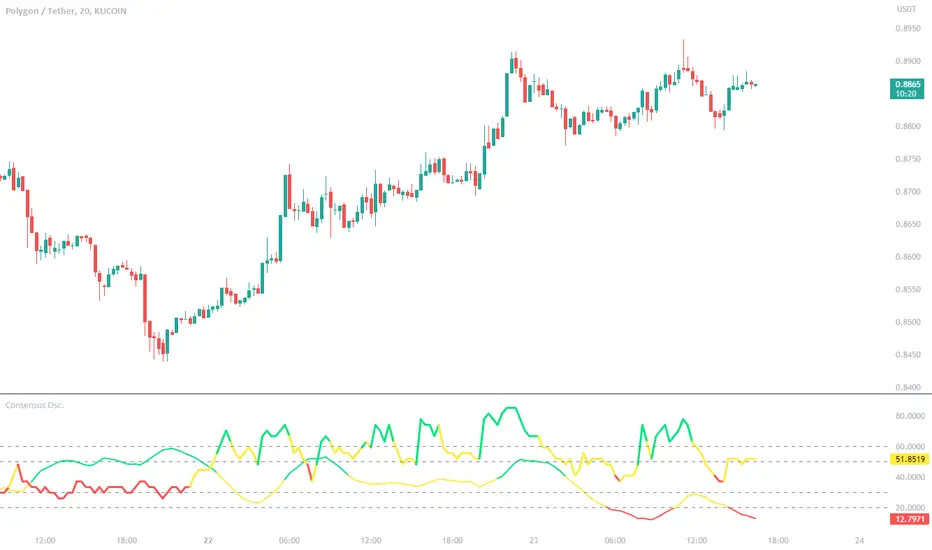
Consensus Oscillator with ADX (LeafAlgo)This indicator creates a normalized consensus from a set of other indicators -- Chande Momentum Oscillator (CMO), Detrended Price Oscillator (DPO), Momentum (MOM), Rate of Change (RoC), Relative Strength Index (RSI), the True Strength Index (TSI) Value line, Volume Oscillator, and a normalized Z-score.
The consensus is created by giving ranged values to each individual indicator. These individual values are added together, then put through a normalization function to create a 0-100 range. The scoring for each indicator is as follows:
CMO:
- If chandeMO <= -50, then the score is valued at -2
- If chandeMO > -50 and chandeMO <= -25, then the score is valued at -1
- If chandeMO > -25 and chandeMO < 25, then the score is valued at 0
- If chandeMO >= 25 and chandeMO < 50, then the score is valued at 1
- If chandeMO >= 50, then the score is valued at 2
DPO:
- If dpo <= -0.005, then the score is valued at -2
- If dpo > -0.005 and dpo <= -0.0025, then the score is valued at -1
- If dpo > -0.0025 and dpo < 0.0025, then the score is valued at 0
- If dpo >= 0.0025 and dpo < 0.005, then the score is valued at 1
- If dpo >= 0.005, then the score is valued at 2
MOM:
- If mom <= -0.05, then the score is valued at -2
- If mom > -0.05 and mom <= -0.025, then the score is valued at -1
- If mom > -0.025 and mom < 0.025, then the score is valued at 0
- If mom >= 0.025 and mom < 0.05, then the score is valued at 1
- If mom >= 0.05, then the score is valued at 2
ROC:
- If roc <= -20, then the score is valued at -2
- If roc > -20 and roc <= -10, then the score is valued at -1
- If roc > -10 and roc < 10, then the score is valued at 0
- If roc >= 10 and roc < 20, then the score is valued at 1
- If roc >= 20, then the score is valued at 2
RSI:
- If rsi <= 20, then the score is valued at -2
- If rsi > 20 and rsi <= 40, then the score is valued at -1
- If rsi > 40 and rsi < 60, then the score is valued at 0
- If rsi >= 60 and rsi < 80, then the score is valued at 1
- If rsi >= 80, then the score is valued at 2
TSI Value:
- If tsi <= -20, then the score is valued at -2
- If tsi > -20 and tsi <= -10, then the score is valued at -1
- If tsi > -10 and tsi < 10, then the score is valued at 0
- If tsi >= 10 and tsi < 20, then the score is valued at 1
- If tsi >= 20, then the score is valued at 2
Volume Oscillator:
- If vo <= -20, then the score is valued at -2
- If vo > -20 and vo <= -10, then the score is valued at -1
- If vo > -10 and vo < 10, then the score is valued at 0
- If vo >= 10 and vo < 20, then the score is valued at 1
- If vo >= 20, then the score is valued at 2
Normalized (-1 to +1) Z-Score:
- If z_n <= -0.5, then the score is valued at -2
- If z_n > -0.5 and z_n <= -0.25, then the score is valued at -1
- If z_n > -0.25 and z_n < 0.25, then the score is valued at 0
- If z_n >= 0.25 and z_n < 0.5, then the score is valued at 1
- If z_n >= 0.5, then the score is valued at 2
The consensus line is colored depending on the closing value of the line. The color is shown as lime if above 70, a darker green between 55 and 70, yellow between 45 and 55, orange between 30 and 45, and red below 30.
Additionally, there is a normalized ADX line added into the indicator to give further confirmation to trend strength. The normalized ADX line is shown as green if above 40, yellow between 40 and 20, and red below 20.
Horizontal lines have been added at 20/30 and 50/60 as semi-important levels to watch.
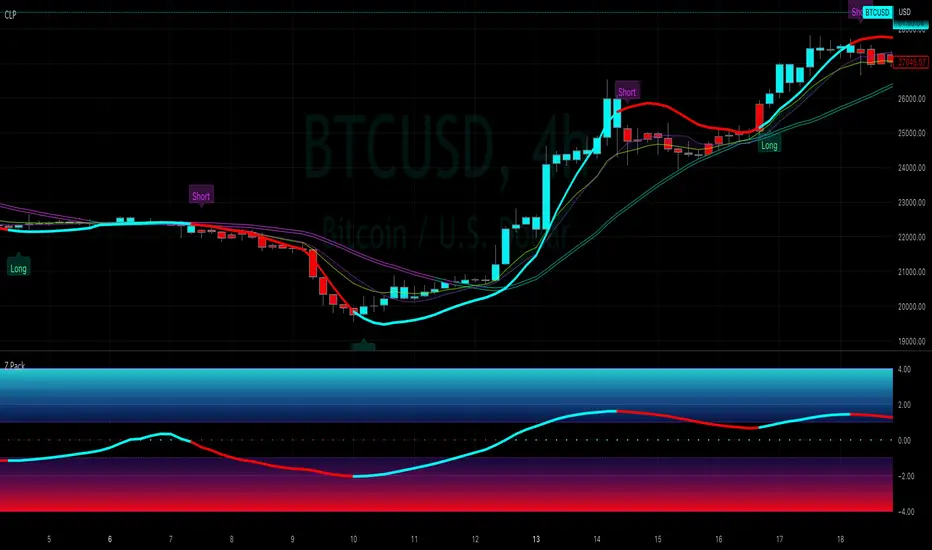
Capital Line PackThe Capital Line Pack ( CLP ) indicator is a technical analysis tool that is designed to help traders and investors identify potential buying and selling opportunities in financial markets by using, inter alia, kernel regression methodoliges. It is a standalone indicator that can be placed on top of price chart displaying the Base MA, Capital Line and standard deviation bands.
The Capital Line is calculated based on volatility, measured by a z-scores* of a selected price source and a moving average (Base MA). The Base MA serves as the foundation for the Capital Line calculation and plays a critical role in determining its behavior and responsiveness to price movements. By selecting different types of moving averages as the Base MA, traders can adjust the sensitivity of the Capital Line to changes in market conditions, which can impact the signals generated by the indicator. The Base MA can be set at the user's choice including: SMA, EMA, Volume Weighted Moving Average (VWMA), Kernel Regression MA, HEMA, DEMA, T3.
For example, if a trader selects a EMA as the Base MA, the Capital Line will respond more quickly to changes in price compared to a more smoothed moving average, like a Volume Weighted Moving Average (VWMA) or Kernel Regression MA. This means that the Capital Line will be more sensitive to short-term price fluctuations with a EMA as the Base MA, while a VWMA or Kernel Regression MA will be less reactive to short-term price movements and more focused on longer-term trends.
Therefore, the choice of Base MA can have a significant impact on the behavior of the Capital Line, and traders need to select the most appropriate Base MA that suits their trading strategy and risk management preferences.
*The z-scores are calculated by comparing the current price to the average price over a certain period of time, and then dividing the difference by the standard deviation of the prices over that same period of time.
The Bands are calculated by adding and subtracting a standard deviation from the Base MA.
Bands help identify the volatility of the market, and when the bands are narrow, it suggests that the market is in a range-bound or flat period.
Indicator incorporates trade signals (labels and alerts). The method by which signals are generated can be selected by the user from several options:
Cap line color switch: Turning blue when it rises and red when it starts to fall.
Cap Line crosses the Base MA: This can be useful when the Base MA is weighted, for example, by volume, and the Cap Line Bandwidth and Relative weighting are set to small values.
Price crosses the Base MA: This is a popular and widely-used method that can provide reliable signals during trending market conditions. However, it may generate false signals during range-bound or flat market conditions.
Crossing of secondary MAs which can be selected in the indicator settings: This method provides traders with more flexibility and control over the signals generated by the indicator, but it may also be more complex and require more advanced technical analysis skills.
One of the standout features of our indicator is the ability to choose from several different style themes:
Pro
Modern
and Stealth
The "Pro" and "Modern" themes offer a clean and visually appealing display, while the "Stealth" theme is perfect for traders who want to focus on the price action or other indicators. The "Stealth" theme shades all the elements of the indicator while still keeping them in the field of visibility, allowing traders to concentrate on the most important aspects of their charts.
In addition to its trade signals, alerts, labels, and customizable themes, the indicator also offers several trend highlighting options to help traders visually backtest their trades. These options include candle coloring, background coloring, and highlighting with a histogram.
The candle coloring feature allows traders to customize the color of the candlesticks on their chart based on the direction of the trend. For example, bullish candles could be colored in teal, while bearish candles could be colored purple etc. This can make it easier for traders to identify trend movements and backtest their strategy.
The background coloring feature works similarly to the candle coloring feature, but it applies a color to the background of the chart rather than the candlesticks. This can be a useful way to highlight trends on the chart without obscuring the price action.
The histogram highlighting feature displays a histogram on the chart to show the difference between the upper and lower bands. This can be a useful way to visualize the strength of the trend and backtest trades based on the histogram readings.
NB! Remember, it is important to have a solid trading plan in place and to properly manage risk when trading.
Some traders may, depending upon customized settings, use the Capital Line as a capital risk management feature in trading. Our Capital Line indicator can be a useful tool, but it should not be the only factor considered when making trade decisions.
MVRV Z Score and MVRV Free Float Z-ScoreIMPORTANT: This script needs as much historic data as possible. Please run it on INDEX:BTCUSD , BNC:BLX or another chart of sufficient length.
MVRV
The MVRV (Market Value to Realised Value Ratio) simply divides bitcoins market cap by bitcoins realized market cap. This was previously impossible on Tradingview but has now been made possible thanks to Coinmetrics providing us with the realized market cap data.
In the free float version, the free float market cap is used instead of the regular market cap.
Z-Score
The MVRV Z-score divides the difference between Market cap and realized market cap by the historic standard deviation of the market cap.
Historically, this has been insanely accurate at detecting bitcoin tops and bottoms:
A Z-Score above 7 means bitcoin is vastly overpriced and at a local top.
A Z-Score below 0.1 means bitcoin is underpriced and at a local bottom.
In the free float version, the free float market cap is used instead of the regular market cap.
The Z-Score, also known as the standard score is hugely popular in a wide range of mathematical and statistical fields and is usually used to measure the number of standard deviations by which the value of a raw score is above or below the mean value of what is being observed or measured.
Credits
MVRV Z Score initially created by aweandwonder
MVRV initially created by Murad Mahmudov and David Puell

Z Pack BollingerOur new "Z Pack" indicator is a modified version of the traditional Bollinger Bands indicator, with a bunch of additional features what makes it a powerful tool that allows traders to make informed decisions based on the market's volatility and short-term trend.
The z-score of the Bollinger Bands indicator is a measure of how many standard deviations the current price is away from the moving average. This provides a more normalized view of the price action, which can be especially useful in identifying potential trend changes. In this form of indicator it is much easier to notice the most extreme deviations from the mean.
One of the main advantages of using this indicator is that it can help traders identify market conditions that are unusually far away from the mean, which can be indicative of a potential trend reversal or that, with sustained momentum a new trend may be about to begin.
Another advantage of the Z-Score Bollinger Bands indicator is that it can help traders identify when a market is trending. This is because when the Z-score is consistently high or low, it can indicate that a trend is in progress or that a trend may be reversing, respectively.
As for the additional features with which we have charged this indicator, there are many of them and they will be explained now.
Capital line
"Capital line" is based on a kernel regression of z score value over time.
The kernel regression is a non-parametric method that allows to estimate the underlying probability density function of a random variable and this way provides a smooth representation of the data. By using this method, the "Сapital line" is able to react to market changes much faster than traditional methods and gives traders a more accurate representation of the short-term trend.
Also we have developed a filter that reduces the number of false signals (you can toggle it in the settings). It is also possible to enable the display of only the capital line to focus only on it.
Divergence search
One of the unique features of the indicator is its ability to search for divergence between the z score and the price. A divergence occurs when the indicator and the price are moving in opposite directions, indicating a potential trend reversal. This allows traders to identify potential market turning points and make informed decisions.
It is possible to search for divergence on a Z-score, although it is not a common practice. In technical analysis, divergence is a method of comparing the movement of an asset's price with an indicator, such as an oscillator, in order to identify potential trend reversals. The same concept of divergence can be applied to a Z-score by comparing the movement of a value's Z-score to the underlying data, for example, by comparing the change in Z-score to the change in the underlying price of a stock. However, this is not a widely used approach and requires thoughtful analysis, but according to our observations, it provides quite important information about the potential exhaustion of the current trend.
By combining the z-score with the price, traders can look for divergences that might not be as obvious when looking at the indicator or the price alone. For example, if the z-score is trending higher while the price is trending lower, this could indicate a potential bullish reversal. Similarly, if the z-score is trending lower while the price is trending higher, this could indicate a potential bearish reversal.
Price Labels
The labels indicating the price of an asset that corresponds to a specific level of the standard deviation are a useful feature for traders because it allows them to quickly identify key levels of support and resistance. By placing limit orders at these levels, traders can potentially enter or exit trades at more favorable prices. This can help to improve the risk-reward ratio of their trades, as well as potentially increase the chances of a profitable outcome. Additionally, having these labels readily available can save traders time in identifying key levels of support and resistance, allowing them to focus on other aspects of their trading strategy.
Additionally, there is an option to analyze the previous volatility of the instrument for a specified time period. If the instrument has crossed the maximum standard deviation level at least once during the specified time period, a separate dashed line will be drawn on the z score chart, demonstrating how volatile the instrument is in the context of the specified time period. This is known as Extreme Mode.
The feature of analyzing the previous volatility of an instrument using the z score indicator can be beneficial for traders in a number of ways. One major advantage is that it allows traders to quickly assess the historical volatility of an instrument and compare it to current volatility levels. This can be useful for determining if an instrument is currently experiencing unusually high or low volatility, which can in turn inform trading decisions.
Another advantage of this feature is that it allows traders to quickly identify key levels of volatility that have been historically significant for the instrument. For example, if an instrument has frequently crossed the maximum deviation level during a specified time period, a trader may choose to place limit orders at that level in anticipation of the instrument reaching it again in the future.
The ability to see the price at a particular moment in time when the price breaks through the 4th(selectable) level of the z score can be an advantage for traders as it allows them to quickly identify key price levels and potentially place limit orders at those levels. This feature can be useful for traders who want to take advantage of market volatility or for those who want to set stop-loss or take-profit levels.
Additionally, the feature can be useful for identifying key levels of support and resistance, as well as for identifying potential entry and exit points for trades. By having the ability to quickly identify these key levels, traders can make more informed decisions about their trades and potentially increase their chances of success in the market.
Alerts
The "Z pack" indicator also includes an advanced, customisable alerting system, with alerts for z level touches, zero crossings, changes in the direction of the capital line, and confirmed or potential divergence. It allows them to stay informed of key developments in the market in real-time and take action accordingly.
For example, if the indicator generates an alert for a z level touch, a trader can place a market order at that level knowing that the price has reached a significant level of volatility. Similarly, an alert for a zero crossing (up/down) can indicate a change in trend, and a trader can use this information to adjust their strategy accordingly.
The alerts of confirmed or potential divergence can be especially useful for identifying potential turning points in the market and make decisions based on that.
NB! Remember, it is important to have a solid trading plan in place and to properly manage risk when trading. Our custom indicator can be a useful tool, but it should not be the only factor considered when making trade decisions.

Z Score BandThis is a band based on Z Score. What is Z Score? In layman's terms it's a method of finding outliers within a sequence of numbers. It's highly effective to quantify pump and dumps in the crypto market.
The middle line is a simple Exponential Moving Average, you can configure this with whatever period you prefer. It comes default with a period of 247 to which I find suitable for my style of trading. The upper and lower bound are determined by the standard deviation you choose in the settings, it comes with a default of 1.69 although I've heard people saying 2.5 is a better number to really pinpoint outliers.
Trading with this indicator is like trading with any band based indicator. The main difference is that this indicator's sole purpose when I wrote it is to help me find shorting positions in the futures market. On the contrary though, longs are also achievable although I rarely long the futures market.
If prices hit the upper bound and get rejected, it's probably because the move was an outlier, it doesn't happen often and when it does usually it reveals crypto's nature of buying spot and hedging short in the futures market. When prices stay above the upper bound, switch to a higher timeframe until we can see that it's still have some ways upwards.
What's true about using this as a shorting tool is also true with longs. However, it might not be as effective, I'd like to be proven wrong.

Quantitative mean reversion v4The code uses the concept of mean reversion. Mean reversion suggests that price over a period of time reverts back to its statistical mean. In simple terms, it means if a price has drifted apart from the statistical mean, after a certain amount of time, it will revert back to its statistical mean. This drift is measured via z-score. When the z-score value is high, the price is expected to revert. Besides, the higher the time frame you use, the lesser the drift is, so reduce the z-score in the tabs if you use higher time frames, else, vice-versa.
Based on the parameters, the code will provide a trade signal - both long and short, and entry and exit. You can use notifications for alerts. Please use the parameters in the options to find the best combinations for your stocks.
In the properties, you can use your own brokers commission, capital, to see if the strategy is profitable for your ticker in the long run or not. This code has been tested for profits for various assets in both crypto - Bitcoin futures , Ethereum futures -, and stocks - AMD , Apple , MSFT , etc.
This is not get rich quick scheme, and you have to be patient with it for the long run.
If you have any query, please feel free to ask in the comments sections.
If you want some new changes, please feel free to suggest
Currently, I am optimising the maximum time for holding a trade. Till that's completed, use this and please feel free to leave a feedback to make it better

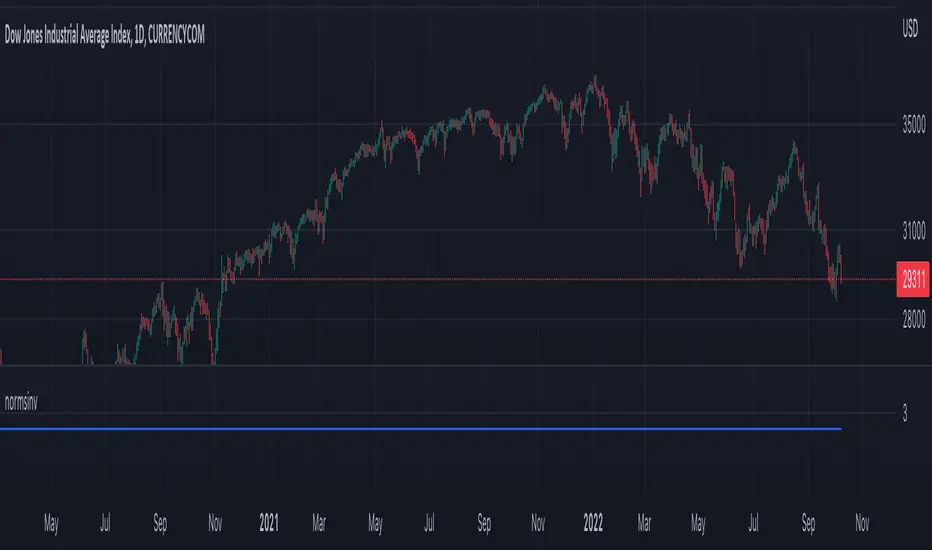
normsinvLibrary "normsinv"
Description:
Returns the inverse of the standard normal cumulative distribution.
The distribution has a mean of zero and a standard deviation of one; i.e.,
normsinv seeks that value z such that a normal distribtuion of mean of zero
and standard deviation one is equal to the input probability.
Reference:
github.com
normsinv(y0)
Returns the inverse of the standard normal cumulative distribution. The distribution has a mean of zero and a standard deviation of one.
Parameters:
y0 : float, probability corresponding to the normal distribution.
Returns: float, z-score
two_leg_spread_returns_zscoreThis script helps assess the relative returns of each leg in a two-legged spread. It shows the z-score of each period's returns, along with a moving average of the difference between the two returns. A negative moving average implies that the second leg is strengthening, on a relative return basis, against the first leg, and vice versa. The inputs are:
- timeframe: the timeframe for the calculations. the default is five minutes.
- leg1_sym: the symbol for the first leg
- leg2_sym: the symbol for the second leg
- ma_length: the length of the moving average. by default it is 48, or the previous four hours, given the default timeframe.
The default symbols are RB and HO, simply as an example of an intercommodity spread.

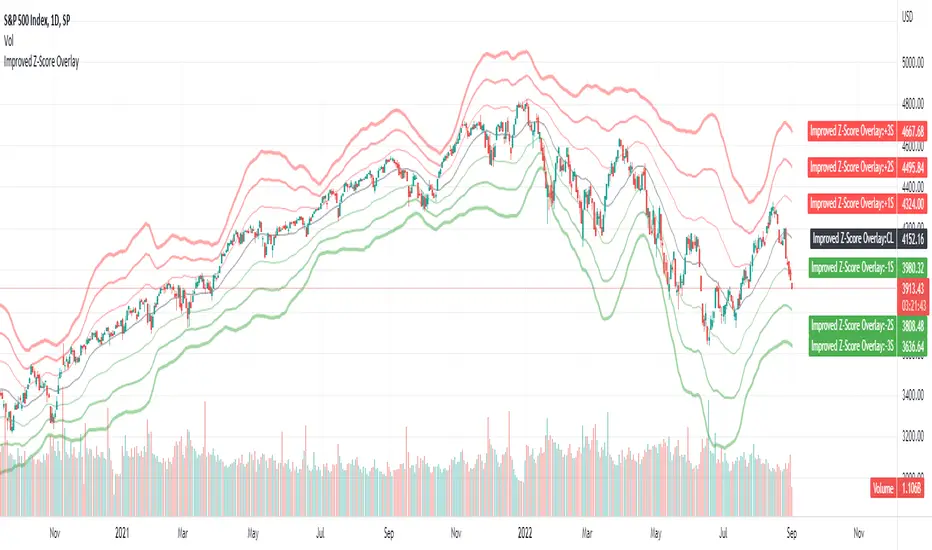
Improved Z-Score OverlayLast month I published an improved z-score script that goes underneath your chart, which helps to highlight overbought or oversold regimes. It is customizable, and allows changing the periods, whether smoothing capability is desired, whether to use simple or exponential moving averages, and which data source to use (open, high, low, close, ohlc4).
Some individuals may find that it is most useful not only to have the z-score visible underneath their price chart, but have the sigma values clearly visible on the chart itself to determine overbought or oversold levels.
Therefore, this improved z-score overlay script will place the centerline of price on the chart, and +3/+2/+1/0/-1/-2/-3 sigma.
These can be disabled if some values do not want to be shown, and the colors / opacity can be changed.
Additionally, you could also put this into a new pane below your chart and disable all of the +3 to -3 sigma values, and enable the "Z-Score" button. This will allow you to replicate the original Improved Z-Score Script.
If anyone has questions or would like to have any improvements made, let me know :)
- Jim Bosse
[Sidders]Std. Deviation from Mean/MA (Z-score)This indicator visualizes in a straight forward way the distance price is away from the mean in absolute standard deviations (Z-score) over a certain lookback period (can be configured). Additionally I've included a moving average of the distance, the MA type can be configured in the settings.
Personally using this indicator for some of my algo mean reversion strategies. Price reaching the extreme treshold (can be configured in settings, standard is 3) could be seen as a point where price will revert to the mean.
I've included alerts for when price crosses into extreme areas, as well as alerts for when crosses back into 'normal' territory again. Both are also plotted on the indicator through background coloring/shapes.
Since I've learned so much from other developers I've decided to open source the code. Let me know if you have any ideas on how to improve, I'll see if I can implement them.
Enjoy!

Candle Colored by Volume Z-score [Morty]This indicator colors the candles according to the z-score of the trading volume. You can easily see the imbalance on the chart. You can use it at any timeframe.
In statistics, the standard score (Z-score) is the number of standard deviations by which the value of a raw score (i.e., an observed value or data point) is above or below the mean value of what is being observed or measured. Raw scores above the mean have positive standard scores, while those below the mean have negative standard scores.
This script uses trading volume as source of z-score by default.
Due to the lack of volume data for some index tickers, you can also choose candle body size as source of z-score.
features:
- custom source of z-score
- volume
- candle body size
- any of above two
- all of above two
- custom threshold of z-score
- custom color chemes
- custom chart type
- alerts
default color schemes:
- green -> excheme bullish imbalance
- blue -> large bullish imbalance
- red -> excheme bearish imbalance
- purple -> large bearish imbalance
- yellow -> low volume bars, indicates "balance", after which volatility usually increases and tends to continue the previous trend
Examples:
* Personally, I use dark theme and changed the candle colors to black/white for down/up.
Volume as Z-score source
Any as Z-score source, more imbalances are showed
