Can Bulls Reclaim $262 or Will It Slip Back to $252? 🍏
1. Market Structure (1H & 15M)
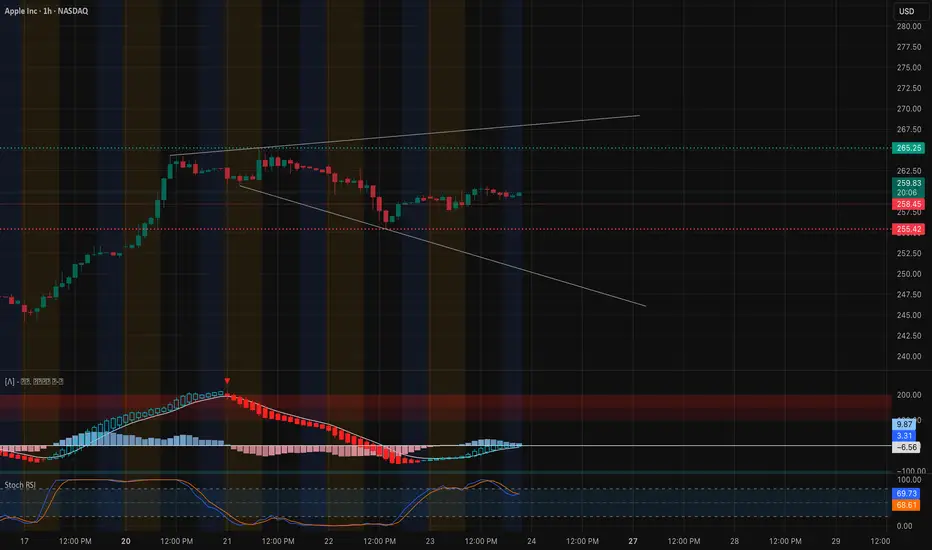
Apple’s recent price action shows a fragile equilibrium forming between supply and demand after a clean recovery from the $252 zone. On the 1-hour chart, we’ve got a CHoCH confirming short-term buyers stepping back in around $255, but price remains capped below a key mid-range resistance zone at $260–$262, where several prior breakdown candles originated.
The BOS from earlier in the week was followed by a retracement that created a local higher low structure, hinting at possible accumulation between $255–$258. However, the failure so far to push decisively through $262.50 shows hesitation — likely due to overhead liquidity and the GEX call wall there.
On the 15-minute chart,

Apple is consolidating inside a rising channel with small BOS/CHoCH rotations that reflect indecision. The latest CHoCH suggests short-term exhaustion, but as long as price respects $257–$258, bulls still have a chance to retake control into Friday.
2. Supply and Demand / Order Blocks
* Demand Zone (Support): $252.5–$255.5, aligning with a previous BOS level and high-volume accumulation area.
* Near-Term Demand: $257–$258 (15M fair value gap + local retest zone).
* Supply Zone (Resistance): $262–$265 — key order block cluster where sellers previously initiated the drop; breakout beyond this range could ignite a trend continuation toward $268+.
The chart shows clear liquidity resting above $262 and below $252 — suggesting that whichever side gets swept first will likely define Friday’s directional bias.
3. Indicator Confluence
* 9 EMA / 21 EMA: On the 15M, both EMAs are converging with a mild upward slope, indicating an early transition from consolidation to possible upside momentum. The 1H EMAs are flattening — a neutral but stabilizing signal.
* MACD: The 1-hour MACD is curling upward with histogram bars flipping positive, suggesting bulls are slowly regaining control. On the 15-minute, MACD shows mild bearish divergence but flattening momentum — setting up for a potential premarket expansion.
* RSI: 1-hour RSI is sitting near 68, close to bullish control but not yet overbought. 15M RSI oscillates between 52–60, ideal for a momentum reset phase.
* Volume: Volume picked up during the $252 bounce but has cooled — typical of compression before a possible breakout.
4. GEX (Gamma Exposure) & Options Sentiment

Friday’s GEX chart paints a tight battleground between the $252.5 HVL support and the $262–$265 gamma wall. The highest positive gamma lies right at $259–$260, meaning dealers may attempt to pin price near that zone through hedging.
Below that, the PUT support around $250 aligns perfectly with structural demand and previous BOS support — this is the line bulls must defend. Above, $265 represents the dominant call wall, making it the near-term ceiling unless a gamma squeeze takes hold.
The current IVR (20) and IVX avg (29.8) show low volatility, and call sentiment remains modest (7.1%), implying traders are cautious but not overly bearish. If momentum accelerates past $262, gamma positioning could flip and lead to a controlled squeeze toward $267–$270.
5. Trade Scenarios for Friday, Oct. 24
Bullish Setup 🟩
* Entry Zone: $258–$259 retest or breakout above $262.2
* Targets: $264 → $267 → $270
* Stop-Loss: Below $256.8
* Confirmation: Hold above 9 EMA on 15M + MACD histogram rising + RSI > 60
Bearish Setup 🟥
* Entry Zone: $261–$262.5 rejection or CHoCH under $257
* Targets: $255 → $252 → $248
* Stop-Loss: Above $263.5
* Confirmation: MACD crossdown + RSI divergence + BOS to downside
6. Closing Outlook for Oct. 24 (Friday)
Friday looks to be a compression breakout setup for Apple — momentum is tightening between $257 and $262. If bulls reclaim $262 with conviction, watch for a potential gamma-driven squeeze toward $267+. Conversely, a rejection there with fading volume could pull Apple back toward its $252–$255 accumulation base.
My personal view: AAPL remains neutral-to-bullish as long as $257 holds. Buyers have shown up at every dip this week, and Friday’s session might reveal whether that base was genuine accumulation or just short-term relief. Keep your eyes on $262 — that’s the key trigger level.
📊 Final Thought: “AAPL is balancing between $257 and $262 — the calm before the breakout. If bulls crack $262, the gamma unwind could send it flying toward $270. If not, expect a cool-off back to the $255 zone.”
This analysis is for educational purposes only and not financial advice. Always do your own research and manage your risk before trading.
1. Market Structure (1H & 15M)
Apple’s recent price action shows a fragile equilibrium forming between supply and demand after a clean recovery from the $252 zone. On the 1-hour chart, we’ve got a CHoCH confirming short-term buyers stepping back in around $255, but price remains capped below a key mid-range resistance zone at $260–$262, where several prior breakdown candles originated.
The BOS from earlier in the week was followed by a retracement that created a local higher low structure, hinting at possible accumulation between $255–$258. However, the failure so far to push decisively through $262.50 shows hesitation — likely due to overhead liquidity and the GEX call wall there.
On the 15-minute chart,
Apple is consolidating inside a rising channel with small BOS/CHoCH rotations that reflect indecision. The latest CHoCH suggests short-term exhaustion, but as long as price respects $257–$258, bulls still have a chance to retake control into Friday.
2. Supply and Demand / Order Blocks
* Demand Zone (Support): $252.5–$255.5, aligning with a previous BOS level and high-volume accumulation area.
* Near-Term Demand: $257–$258 (15M fair value gap + local retest zone).
* Supply Zone (Resistance): $262–$265 — key order block cluster where sellers previously initiated the drop; breakout beyond this range could ignite a trend continuation toward $268+.
The chart shows clear liquidity resting above $262 and below $252 — suggesting that whichever side gets swept first will likely define Friday’s directional bias.
3. Indicator Confluence
* 9 EMA / 21 EMA: On the 15M, both EMAs are converging with a mild upward slope, indicating an early transition from consolidation to possible upside momentum. The 1H EMAs are flattening — a neutral but stabilizing signal.
* MACD: The 1-hour MACD is curling upward with histogram bars flipping positive, suggesting bulls are slowly regaining control. On the 15-minute, MACD shows mild bearish divergence but flattening momentum — setting up for a potential premarket expansion.
* RSI: 1-hour RSI is sitting near 68, close to bullish control but not yet overbought. 15M RSI oscillates between 52–60, ideal for a momentum reset phase.
* Volume: Volume picked up during the $252 bounce but has cooled — typical of compression before a possible breakout.
4. GEX (Gamma Exposure) & Options Sentiment
Friday’s GEX chart paints a tight battleground between the $252.5 HVL support and the $262–$265 gamma wall. The highest positive gamma lies right at $259–$260, meaning dealers may attempt to pin price near that zone through hedging.
Below that, the PUT support around $250 aligns perfectly with structural demand and previous BOS support — this is the line bulls must defend. Above, $265 represents the dominant call wall, making it the near-term ceiling unless a gamma squeeze takes hold.
The current IVR (20) and IVX avg (29.8) show low volatility, and call sentiment remains modest (7.1%), implying traders are cautious but not overly bearish. If momentum accelerates past $262, gamma positioning could flip and lead to a controlled squeeze toward $267–$270.
5. Trade Scenarios for Friday, Oct. 24
Bullish Setup 🟩
* Entry Zone: $258–$259 retest or breakout above $262.2
* Targets: $264 → $267 → $270
* Stop-Loss: Below $256.8
* Confirmation: Hold above 9 EMA on 15M + MACD histogram rising + RSI > 60
Bearish Setup 🟥
* Entry Zone: $261–$262.5 rejection or CHoCH under $257
* Targets: $255 → $252 → $248
* Stop-Loss: Above $263.5
* Confirmation: MACD crossdown + RSI divergence + BOS to downside
6. Closing Outlook for Oct. 24 (Friday)
Friday looks to be a compression breakout setup for Apple — momentum is tightening between $257 and $262. If bulls reclaim $262 with conviction, watch for a potential gamma-driven squeeze toward $267+. Conversely, a rejection there with fading volume could pull Apple back toward its $252–$255 accumulation base.
My personal view: AAPL remains neutral-to-bullish as long as $257 holds. Buyers have shown up at every dip this week, and Friday’s session might reveal whether that base was genuine accumulation or just short-term relief. Keep your eyes on $262 — that’s the key trigger level.
📊 Final Thought: “AAPL is balancing between $257 and $262 — the calm before the breakout. If bulls crack $262, the gamma unwind could send it flying toward $270. If not, expect a cool-off back to the $255 zone.”
This analysis is for educational purposes only and not financial advice. Always do your own research and manage your risk before trading.
免責事項
この情報および投稿は、TradingViewが提供または推奨する金融、投資、トレード、その他のアドバイスや推奨を意図するものではなく、それらを構成するものでもありません。詳細は利用規約をご覧ください。
免責事項
この情報および投稿は、TradingViewが提供または推奨する金融、投資、トレード、その他のアドバイスや推奨を意図するものではなく、それらを構成するものでもありません。詳細は利用規約をご覧ください。